. 2024 Jun 29;15(1):5506.
doi: 10.1038/s41467-024-49633-y.

IFNγ-IL12 axis regulates intercellular crosstalk in metabolic dysfunction-associated steatotic liver disease

Affiliations

IFNγ-IL12 axis regulates intercellular crosstalk in metabolic dysfunction-associated steatotic liver disease

Randall H Friedline et al. Nat Commun. .

Erratum in

Abstract

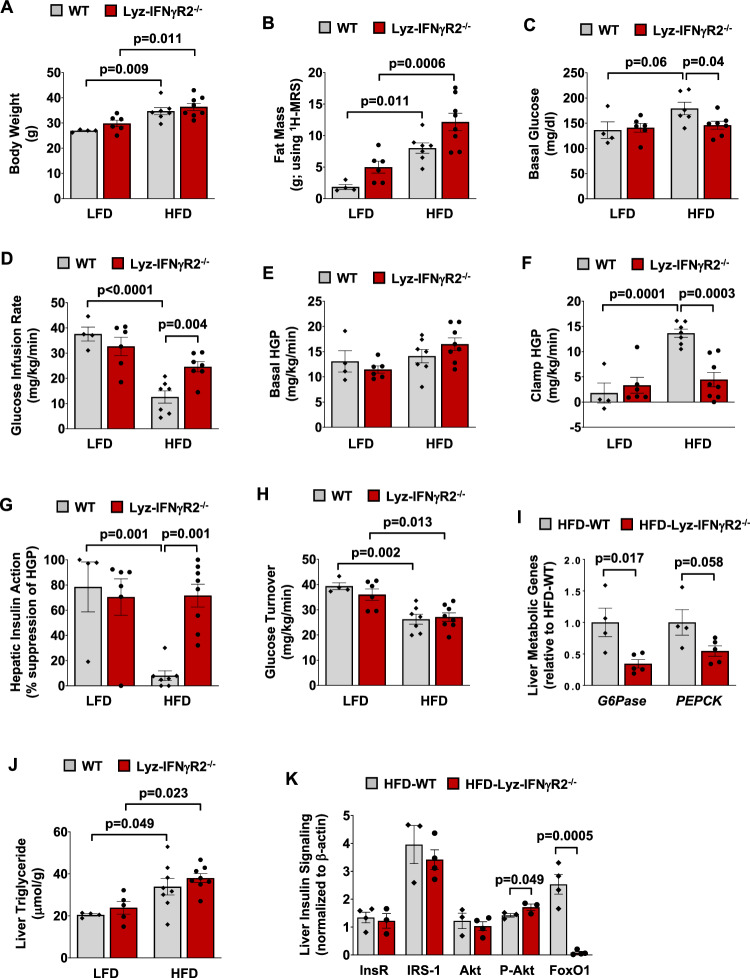
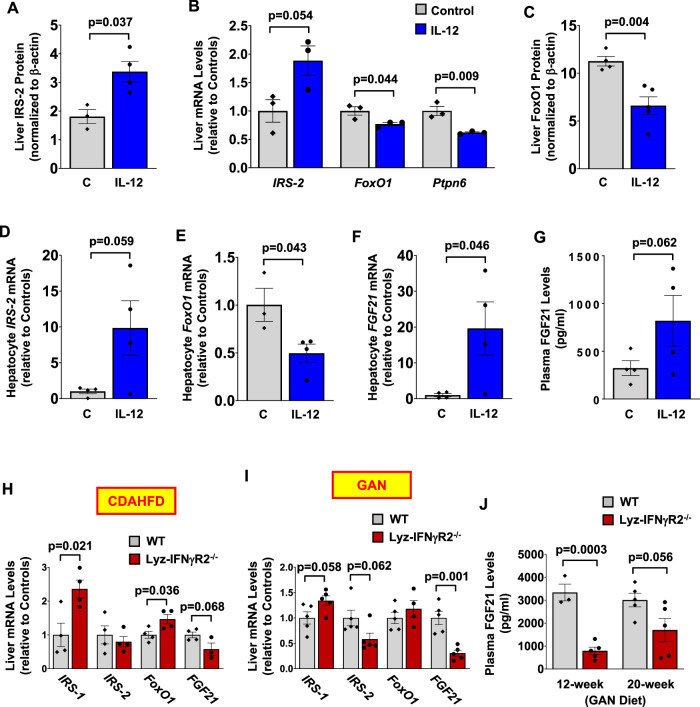
Obesity is a major cause of metabolic dysfunction-associated steatohepatitis (MASH) and is characterized by inflammation and insulin resistance. Interferon-γ (IFNγ) is a pro-inflammatory cytokine elevated in obesity and modulating macrophage functions. Here, we show that male mice with loss of IFNγ signaling in myeloid cells (Lyz-IFNγR2-/-) are protected from diet-induced insulin resistance despite fatty liver. Obesity-mediated liver inflammation is also attenuated with reduced interleukin (IL)-12, a cytokine primarily released by macrophages, and IL-12 treatment in vivo causes insulin resistance by impairing hepatic insulin signaling. Following MASH diets, Lyz-IFNγR2-/- mice are rescued from developing liver fibrosis, which is associated with reduced fibroblast growth factor (FGF) 21 levels. These results indicate critical roles for IFNγ signaling in macrophages and their release of IL-12 in modulating obesity-mediated insulin resistance and fatty liver progression to MASH. In this work, we identify the IFNγ-IL12 axis in regulating intercellular crosstalk in the liver and as potential therapeutic targets to treat MASH.


Conflict of interest statement

J.K.K. is on the scientific advisory board for Elevian Inc. and Imagine Pharma. D.L.G. is a consultant for The Jackson Laboratory. The remaining authors declare no competing interests.

Figures

Fig. 1
Fig. 1. Lyz-IFNγR2−/− mice are protected from obesity-mediated insulin resistance in the liver.
Metabolic and molecular experiments were performed in male Lyz-IFNγR2−/− and LysM-Cre+ (WT) mice at 6 ~ 7 months of age following 10 weeks of a high-fat diet (HFD; 7 WT and 8 Lyz-IFNγR2−/− mice) or a low-fat diet (LFD; 4 WT and 6 Lyz-IFNγR2−/− mice) serving as controls. A Body weight. B Whole-body fat mass, measured using 1H-magnetic resonance spectroscopy (MRS). C Basal plasma glucose levels after overnight fast. D Glucose infusion rate required to maintain euglycemia during a standardized 2-hour hyperinsulinemic-euglycemic clamp in awake mice. E Basal hepatic glucose production (HGP). F Clamp HGP during the insulin-stimulated state. G Hepatic insulin action expressed as insulin-mediated percent suppression of basal HGP. H Whole-body glucose turnover. I RT-qPCR analysis of liver glucose 6-phosphatase (G6Pase) and phosphoenolpyruvate carboxykinase (PEPCK) genes in HFD-fed mice (n = 4 HFD-WT and 5 HFD-Lyz-IFNγR2−/− mice). mRNA levels were normalized to HPRT as a housekeeping gene and are shown relative to HFD-WT mice. J Liver triglyceride levels (n = 4 LFD-WT, 5 LFD-Lyz-IFNγR2−/−, 8 HFD-WT, and 8 HFD-Lyz-IFNγR2−/− mice). K Liver protein expression of insulin receptor (InsR), insulin receptor substrate (IRS)-1, Akt, Ser473-phosphorylation of Akt, and forkhead box protein O1 (FoxO1) using the Jess Multiplexed Western Blot System in HFD-fed mice (n = 3 ~ 4 HFD-WT and 3 ~ 4 HFD-Lyz-IFNγR2−/− mice). Protein levels were normalized to β-actin as a loading control. Data are presented as mean ± SEM values. The statistical significance of the difference in mean values between Lyz-IFNγR2−/− mice and WT mice fed with a HFD or LFD was determined using a one-way analysis of variance (ANOVA) with Tukey’s multiple comparison test for post-hoc analysis (Fig. A-H and J). The statistical significance of the difference in mean values between HFD-fed Lyz-IFNγR2−/− mice versus HFD-fed WT mice was determined using a two-tailed Student’s t-test (Fig. I and K).
Fig. 2
Fig. 2. Reduced liver inflammation in HFD-fed Lyz-IFNγR2−/− mice.
Multiplexed-Luminex analysis of liver cytokines was performed in male Lyz-IFNγR2−/− and WT mice at 6 ~ 7 months of age following 10 weeks of an HFD. A IL-1β, IL-7, IL-15, IL-17, IFNγ, and vascular endothelial growth factor (VEGF) levels in the liver (n = 3 ~ 4 HFD-WT and 6 ~ 8 HFD-Lyz-IFNγR2−/− mice). B IL-9, KC (murine IL-8 homolog), and monokine-induced by IFNγ (MIG) levels in the liver (n = 4 HFD-WT and 7 ~ 8 HFD-Lyz-IFNγR2−/− mice). C IL-12 (p40) and IL-12 (p70) levels in the liver (n = 4 HFD-WT and 8 HFD-Lyz-IFNγR2−/− mice). Data are presented as mean ± SEM values. The statistical significance of the difference in mean values was determined using a two-tailed Student’s t-test.
Fig. 3
Fig. 3. IL-12 treatment in vivo causes liver insulin resistance in wild-type mice.
Mouse recombinant IL-12 (0.25 µg/hour; n = 5) or saline (C, Control; n = 4) was intravenously administered for 4 hours in male C57BL/6J mice at 4 ~ 5 months of age, and hyperinsulinemic-euglycemic clamps were performed to measure insulin action and glucose metabolism in awake mice. A Time course of glucose infusion rates required to maintain euglycemia (~ 100 mg/dl) during clamps. B Steady-state glucose infusion rates during 90-120 min of clamps. C Basal HGP. D Clamp HGP during the insulin-stimulated state. E Hepatic insulin action expressed as insulin-mediated percent suppression of basal HGP. F Liver samples were collected 1 hour after IL-12 injection (1 mg) with saline serving as control, and the Jess Multiplexed Western Blot System was used to measure the liver expression of signal transducer and activator of transcription 4 (STAT4), Tyr693-phosphorylation of STAT4, and a ratio of phospho-STAT4 to total STAT4 protein levels (n = 3 per group). Protein levels were normalized to GAPDH as a loading control. G Insulin signaling was analyzed using liver samples collected at the end of the insulin clamp following 4 hours of IL-12 (n = 3) or saline (n = 3) infusion. Liver protein levels of insulin receptor (InsR), IRS-1, Akt, and Ser473-phosphorylation of Akt were determined using the Jess Western Blot System (n = 3 per group). Protein levels were normalized to β-actin as a loading control. H RT-qPCR analysis of liver IRS-1 mRNA levels normalized to HPRT and shown relative to controls (n = 4 per group). I, J Primary hepatocytes were isolated from male C57BL/6J mice at 4 ~ 5 months of age following a 4-hour intravenous infusion of IL-12 (0.25 µg/hour; n = 4) or saline (control; n = 4) for RT-qPCR analysis of STAT4, p38-mitogen-activated protein kinase (MAPK), IRS-1, and Akt. mRNA levels were normalized to HPRT as a housekeeping gene and shown relative to controls. Data are presented as mean ± SEM values. The statistical significance of the difference in mean values was determined using a two-tailed Student’s t-test or a one-tailed Student’s t-test for Fig. F, I, and J.
Fig. 4
Fig. 4. Lyz-IFNγR2−/− mice are rescued from fatty liver progression to MASH.
Noninvasive ultrasound imaging and histological analyses were performed to assess MASH phenotypes in male Lyz-IFNγR2−/− and WT mice after 4 weeks of a methionine-choline deficient (MCD) diet starting at 6 ~ 7 months of age (n = 3 per genotype). A Representative ultrasound images showing axial, 3D, coronal, and sagittal views using Vega Wide-field Ultrasound Imaging System in mice after 4 weeks of MCD diet. B Liver fibrosis measured as stiffness using Young’s Modulus in MCD diet-fed mice. C Representative shear wave elastography (SWE) images showing shear wave elasticity in regions of high intensity (red-color nearing 20 kPa) and regions of low intensity (blue-color nearing 0 kPa) in MCD diet-fed mice. Additional cohorts of male Lyz-IFNγR2−/− and WT mice were used to assess MASH phenotypes during 20 weeks of a choline-deficient L-amino acid HFD (CDAHFD) starting at ~8 months of age (n = 6 per genotype). D Liver steatosis as shown in brightness during 20 weeks of CDAHFD in mice. The mean values of liver steatosis in Lyz-IFNγR2−/− and WT mice at 4, 8, 12, 16, and 20 weeks of CDAHFD versus 0 week are statistically significant (p < 0.0001). E Liver fibrosis as stiffness using Young’s Modulus during 20 weeks of CDAHFD in mice. The mean values of liver fibrosis in Lyz-IFNγR2−/− and WT mice at 12, 16, and 20 weeks of CDAHFD versus 0 week are statistically significant (p < 0.0001). F Representative liver photos and histology images with Masson’s trichrome stain (collagen stained in blue) from CDAHFD-fed mice. G Representative SWE images showing shear wave elasticity in regions of high and low intensity in CDAHFD-fed mice. Data are presented as mean ± SEM values. The statistical significance of the difference in mean values between Lyz-IFNγR2−/− mice versus WT mice at each time point (weeks of CDAHFD) was determined using a two-tailed Student’s t-test. The statistical significance of the difference in mean values between 4, 8, 12, 16, and 20 weeks of CDAHFD versus 0 week was determined using a one-way analysis of variance (ANOVA) with Tukey’s multiple comparison test for post-hoc analysis.
Fig. 5
Fig. 5. Obese Lyz-IFNγR2−/− mice are protected from liver fibrosis but not steatosis after the GAN diet.
Noninvasive ultrasound imaging and histological analyses were performed to assess MASH phenotypes in male Lyz-IFNγR2−/− and WT mice during 20 weeks of the Gubra Amylin NASH (GAN) diet starting at 6 months of age (n = 7 per genotype). A Body weight changes during 20 weeks of the GAN diet. B Liver steatosis as shown in brightness during 20 weeks of the GAN diet. C Liver fibrosis as stiffness using Young’s Modulus during 20 weeks of the GAN diet (n = 6 WT and 7 Lyz-IFNγR2−/− mice). D Representative SWE images showing shear wave elasticity in regions of high and low intensity in GAN diet-fed mice. E Liver samples collected after 20 weeks of the GAN diet were processed for hematoxylin & eosin (H&E) and Masson’s Trichrome stain, and histology slides were evaluated by a board-certified pathologist (Applied Pathology Systems). MASLD activity score (MAS) was calculated for individual Lyz-IFNγR2−/− and WT mice (n = 3 per genotype) by combining the histology scoring for lobular inflammation, macro-vesicular steatosis, and ballooning. F Representative histology images showing lobular and portal inflammation, and pericellular, bridging, and cirrhotic nodular fibrosis in WT2 mouse. Histology images showing lobular inflammation and pericentral fibrosis in KO1 mouse. Data are presented as mean ± SEM values. The statistical significance of the difference in mean values between Lyz-IFNγR2−/− mice versus WT mice at each time point (weeks of GAN diet) was determined using a two-tailed Student’s t-test. The statistical significance of the difference in mean values between 8, 12, 16, and 20 weeks of GAN diet versus 4 weeks was determined using a one-way analysis of variance (ANOVA) with Tukey’s multiple comparison test for post-hoc analysis.
Fig. 6
Fig. 6. Reduced biomarkers for liver fibrosis and HSC activation in Lyz-IFNγR2−/− mice following the GAN diet.
Liver hydroxyproline and α-smooth muscle actin (α-SMA) contents were measured as reliable markers of fibrosis and activation of hepatic stellate cells (HSC), respectively. A Hydroxyproline content in liver samples collected from WT mice (n = 10) and Lyz-IFNγR2−/− mice (KO; n = 11) after 20 weeks of the GAN diet. B Percent coverage of α-SMA stain in liver sections from WT and KO mice after the GAN diet (n = 3 per genotype). C Histology images showing α-SMA stain for WT1, WT2, KO1, and KO2 mice with stain areas highlighted in red. Data are presented as mean ± SEM values. The statistical significance of the difference in mean values was determined using a two-tailed Student’s t-test.
Fig. 7
Fig. 7. IL-12 regulates the IRS/FoxO1/FGF21 pathway in the liver.
Liver and plasma samples and primary hepatocytes were isolated from male WT mice (C57BL/6J) treated with IL-12 (0.25 µg/hour) or saline (C, Control) for molecular analyses. A Liver IRS-2 protein levels measured using Jess Multiplexed Western Blot System (n = 3 Controls and 4 IL12-treated mice). B RT-qPCR analysis of IRS-2, FoxO1, and protein-tyrosine phosphatase SHP1 (Ptpn6) mRNA levels in the liver. (n = 3 per group) C Liver FoxO1 protein levels measured using Jess Western Blot System. (n = 4 Controls and 5 IL12-treated mice). D-F Primary hepatocytes were isolated from male WT mice at 4 ~ 5 months of age following a 4-hour intravenous infusion of IL-12 (0.25 µg/hour; n = 4) or saline (Control; n = 4) for RT-qPCR analysis of IRS-2, FoxO1, and fibroblast growth factor 21 (FGF21). mRNA levels were normalized to HPRT and shown relative to controls. G Plasma FGF21 levels using ELISA. (n = 4 per group). H & I Liver samples were collected from male Lyz-IFNγR2−/− and WT mice after 20 weeks of CDAHFD or GAN diet for RT-qPCR analysis of IRS-1, IRS-2, FoxO1, and FGF21 mRNA levels in the liver. (n = 4 per genotype for CDAHFD-fed mice and n = 5 per genotype for GAN diet-fed mice). J Plasma FGF21 levels were measured using ELISA in male Lyz-IFNγR2−/− and WT mice after 12 and 20 weeks of the GAN diet. (n = 3 ~ 5 WT and 5 Lyz-IFNγR2−/− mice) All protein levels were normalized to β-actin as a loading control. All mRNA levels were normalized to HPRT as a housekeeping gene and shown relative to controls. Data are presented as mean ± SEM values. The statistical significance of the difference in mean values was determined using a two-tailed Student’s t-test.
Fig. 8
Fig. 8. IL-12 treatment re-establishes diet-induced insulin resistance, inflammation, and fibrosis in the liver of Lyz-IFNγR2−/− mice.
Male Lyz-IFNγR2−/− mice (KO; n = 3) and WT mice (n = 4) were fed an HFD for 12 weeks starting at 2 months of age, and a mouse recombinant IL-12 was chronically administered via osmotic pumps (1.2 ng/day/g body weight) during the last 2 weeks of HFD. A standardized hyperinsulinemic-euglycemic clamp was performed at the end to measure insulin action and glucose metabolism in awake mice. A Body weight in HFD-fed mice following IL-12 treatment. B Whole-body fat mass, measured using 1H-MRS. C Basal plasma glucose levels after overnight fast. D Glucose infusion rate required to maintain euglycemia during the clamp. E Basal and clamp (insulin) hepatic glucose production (HGP). F Hepatic insulin action expressed as insulin-mediated percent suppression of basal HGP. G Whole-body glucose turnover. Additional cohorts of male Lyz-IFNγR2−/− mice (KO; n = 4) and WT mice (n = 6) were fed a GAN diet for 8 weeks, and IL-12 was chronically administered via osmotic pumps (1.2 ng/day/g body weight) during the last 2 weeks of the GAN diet. Vega Wide-field Ultrasound Imaging System was used to noninvasively assess liver steatosis and fibrosis, and multiplexed-Luminex was used to measure liver cytokines at the end. H Liver steatosis in GAN diet-fed mice after IL-12 treatment. I Liver fibrosis measured as stiffness using Young’s Modulus. J Representative SWE images showing shear wave elasticity in regions of high and low intensity in mice. K Liver cytokines and chemokines, including IL-1β, IL-6, IL-7, IL-15, IL-17, IFNγ, VEGF, monocyte chemoattractant protein-1 (MCP-1), and IL-12 (p70) in GAN diet-fed mice after IL-12 treatment (n = 4 WT and 2 KO mice). L Liver cytokines (KC, IL-9, and MIG) in mice (n = 3 ~ 4 WT and 2 KO mice). Data are presented as mean ± SEM values. The statistical significance of the difference in mean values was determined using a two-tailed Student’s t-test. For Fig. K & L, a two-tailed Mann-Whitney test was performed using GraphPad Prism (Version 10.2.0) for statistical analysis.
Fig. 9
Fig. 9. Proposed model of the IFNγ-IL12 axis regulating liver insulin resistance and MASH.
Obesity activates macrophage IFNγ signaling, releasing a pro-inflammatory cytokine IL-12 that causes hepatic insulin resistance by downregulating IRS/Akt-associated insulin signaling via p38-MAPK and induces fatty liver progression to MASH by modulating IRS/FoxO1/FGF21 pathway in the liver.
Fig. 10
Fig. 10. IFNγ-IL12 axis is upregulated in human subjects with MASH.
PolyA-selected RNA-seq data from 206 patients diagnosed with MASLD/MASH from the NICBI GEO database (accession number: GSE135251) were analyzed to evaluate differential gene expression in human subjects with MASLD/MASH. The data were stratified into 5 groups: 51 patients with MASLD, 34 patients with MASH fibrosis stage F0-F1, 53 patients with F2-MASH, 54 patients with F3-MASH, and 14 patients with F4-MASH. A IFNγR1, B IFNγR2, C IL-12A, D IL-12B, and E FGF21. The counts were normalized to Fragments Per Kilobase of transcript per Million (FPKM). The statistical significance of the difference in mean values was determined using a two-sided Wilcoxon-Mann-Whitney test. Lower bound (Q1): 25%, upper bound (Q3): 75%, and centre (median): 50%. Interquartile Range (IQR): Q3-Q1. Minima (lower whisker end): Q1-1.5xIQR. Maxima (upper whisker end): Q3 + 1.5xIQR.

References

    1. Byrne, C. D. & Targher, G. NAFLD: a multisystem disease. J. Hepatol.62, S47–S64 (2015). 10.1016/j.jhep.2014.12.012 - DOI - PubMed
    1. Younossi, Z. M. Non-alcoholic fatty liver disease - A global public health perspective. J. Hepatol.70, 531–544 (2019). 10.1016/j.jhep.2018.10.033 - DOI - PubMed
    1. Younossi, Z. M. et al. Global epidemiology of nonalcoholic fatty liver disease-Meta-analytic assessment of prevalence, incidence, and outcomes. Hepatology64, 73–84 (2016). 10.1002/hep.28431 - DOI - PubMed
    1. Li, H. et al. Crosstalk between liver macrophages and surrounding cells in nonalcoholic steatohepatitis. Front Immunol.11, 1169 (2020). 10.3389/fimmu.2020.01169 - DOI - PMC - PubMed
    1. Dewidar, B., Kahl, S., Pafili, K. & Roden, M. Metabolic liver disease in diabetes - From mechanisms to clinical trials. Metabolism111S, 154299 (2020). 10.1016/j.metabol.2020.154299 - DOI - PMC - PubMed

MeSH terms

LinkOut - more resources