. 2024 Jun 29;15(1):5521.
doi: 10.1038/s41467-024-49833-6.

Microscale geometrical modulation of PIEZO1 mediated mechanosensing through cytoskeletal redistribution

Affiliations

Microscale geometrical modulation of PIEZO1 mediated mechanosensing through cytoskeletal redistribution

Haoqing Jerry Wang et al. Nat Commun. .

Abstract

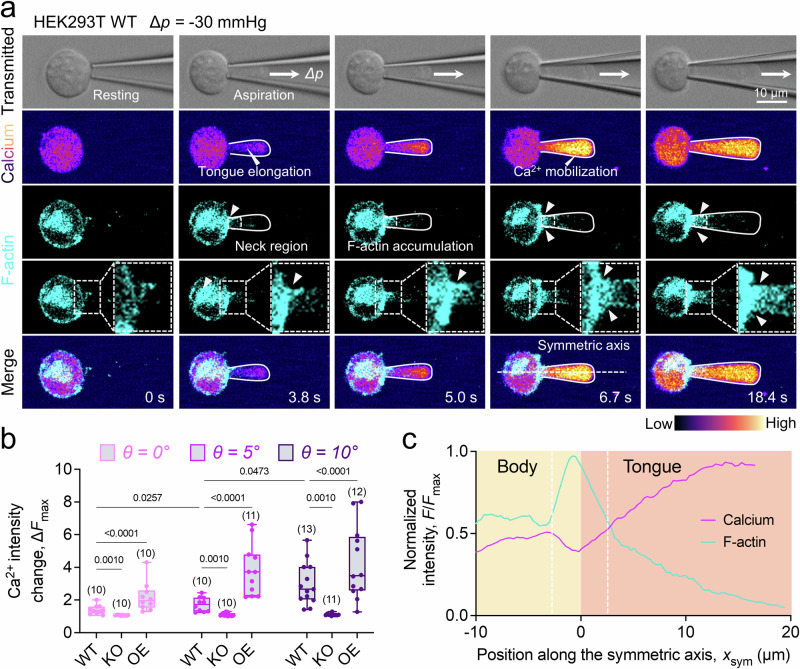
The microgeometry of the cellular microenvironment profoundly impacts cellular behaviors, yet the link between it and the ubiquitously expressed mechanosensitive ion channel PIEZO1 remains unclear. Herein, we describe a fluorescent micropipette aspiration assay that allows for simultaneous visualization of intracellular calcium dynamics and cytoskeletal architecture in real-time, under varied micropipette geometries. By integrating elastic shell finite element analysis with fluorescent lifetime imaging microscopy and employing PIEZO1-specific transgenic red blood cells and HEK cell lines, we demonstrate a direct correlation between the microscale geometry of aspiration and PIEZO1-mediated calcium signaling. We reveal that increased micropipette tip angles and physical constrictions lead to a significant reorganization of F-actin, accumulation at the aspirated cell neck, and subsequently amplify the tension stress at the dome of the cell to induce more PIEZO1's activity. Disruption of the F-actin network or inhibition of its mobility leads to a notable decline in PIEZO1 mediated calcium influx, underscoring its critical role in cellular mechanosensing amidst geometrical constraints.


Conflict of interest statement

The authors declare no competing interests.

Figures

Fig. 1
Fig. 1. Microgeometry influences mechanically induced Ca2+ signaling.
a Schematic of a RBC passing through microenvironments with different geometrical features. When the cell passes through narrow spaces such as micro-vessel junction and endothelial clefts, pressure will induce membrane tension elevation. Mechanosensitive ion channels PIEZO1 (purple) on the cell membrane are then activated to allow Ca2+ influx. b Schematic illustration of the micropipette fabrication with different geometries which finely tuned the tip angle (θ) and diameter (d). c Representative snapshots of micropipettes with tip angle θ = 0°, 5°, and 10°. All three micropipettes had comparable tip diameter d = 1 μm. d Brightfield (top) and fluorescent (bottom) snapshots of the human red blood cell (RBC) being aspirated by the micropipette. When the tongue of the RBC is elongated during aspiration, a significant Ca2+ mobilization is observed by the increase in Ca2+ intensity in the fluorescent channel. e Representative traces of the RBC being aspirated by different micropipettes at ∆p = −20 mmHg. The fold change of Ca2+ intensity F/F0 was utilized to examine the Ca2+ mobilization inside the aspirated RBC. To this end, the Ca2+ intensity increase was enhanced with both increasing tip diameter d and angle θ. a and b are created with BioRender.com released under a Creative Commons Attribution-NonCommercial-NoDerivs 4.0 International license https://creativecommons.org/licenses/by-nc-nd/4.0/deed.en.
Fig. 2
Fig. 2. Microgeometry alters PIEZO1 mediated Ca2+ mobilization at the tongue of the aspirated RBC.
ac Human RBCs ∆Fmax–∆p curve under aspiration by micropipette with different geometries. Ca2+ fold changes relative to the resting state in the aspirated RBCs were quantified along the pressure ranges from ∆p = −5 to −40 mmHg. When the tip angle θ is fixed, larger diameters upshifted the ∆Fmaxp curve, indicating an overall more rapid PIEZO1 activity, while larger tip angle from θ = 0° (a), 5° (b), and 10° (c) resulted a stronger upshift effect on the curve. All results were measured from n ≥ 56 cells within 3 independent experiments and presented as mean ± s.e.m. d Detailed Ca2+ intensity changes comparison amongst different geometries when ∆p = −40 mmHg. Although increasing tip diameter d caused an enhanced Ca2+ intensity change due to aspiration, larger tip angle θ had a more significant enhancement to the Ca2+ mobilization. e Schematic illustration of the larger tip angle θ impact on local PIEZO1 activities. We defined the cell part outside the micropipette as the body (brown circled) with its Ca2+ intensity, Fbody, while the cell part being aspirated into the micropipette as the tongue (red circled), namely Ftongue. The ratio between Ftongue,max and Fbody,max illustrates the spatial difference of the Ca2+ mobilization in the cell. f, g Representative normalized Ca2+ intensity of Fbody (brown) and Ftongue (red) when the RBC was aspirated. The Fbody,max and Ftongue,max are indicated by the horizontal dash line in each representative trace, respectively. h Ca2+ mobilization mapping is neck angle mediated, of which a higher ratio represents more Ca2+ influx happens at the tongue of the aspirated cell (black, θ = 10°) or a lower ratio represents Ca2+ influx was preferrable to happen at the cell body (light gray, θ = 0°). The number of cells (n value) analyzed in each group was indicated above the bars (d, h). Data are presented as box plots with medium, minima, and maxima and analyzed by Welch’s ANOVA. e is created with BioRender.com released under a Creative Commons Attribution-NonCommercial-NoDerivs 4.0 International license https://creativecommons.org/licenses/by-nc-nd/4.0/deed.en.
Fig. 3
Fig. 3. Micropipette tip angle modulates membrane tension at the aspirated RBC tongue.
ac Top: Representative FLIM snapshots using Flipper-TR® reveal tension variations at different aspiration angles. Below: Fluorescence lifetime distribution of aspirated cell body (brown) and tongue (red) were plotted. The white arrow points to the cell dome region which has the highest tension when aspirated by θ = 10° micropipette. d Quantitative analysis of Flipper-TR® lifetime changes correspond with altered tension. e Tongue-to-body lifetime ratio on RBC aspirated by micropipettes with different tip angles. The number of data points (n number) is marked above the box and data (d, e) are presented as box plots with medium, maxima, and minima, and analyzed by Welch’s ANOVA test. fh Front view of the FEA simulated aspirated RBC maximum principal stress contours, denoted the change of membrane tension distribution on the aspirated RBCs. Values are normalized based on the maximum principal stress value of all conditions. Black arrow pointed to the regions with the highest membrane tension when the cell was aspirated by θ = 0° (f), 5°(g) and 10°(h).
Fig. 4
Fig. 4. Micropipette tip angle influences the accumulation of F-actin at the cell neck.
a Confocal snapshots of a HEK293T WT cell aspirated by the micropipette. The transmitted channel (1st row) was used to visualize the aspiration, while Ca2+ mobilization (2nd row) and F-actin dynamics (3rd and 4th row, cyan) were monitored using a separate scanner unit in the FV3000 microscope, respectively. The zoom in F-actin channel demonstrated the accumulation event at the cell neck region (dash line outlined) during aspiration. The merged fluorescence image (5th row) showed that F-actin moved to the neck and accumulated during the aspiration, and co-localized with the dividend between low signal cell body and high signal cell tongue (t = 6.7 s). b Ca2+ fold changes of aspirated HEK293T with different tip angles θ has a consistent trend with human RBC. The suppressed response in PIEZO1-KO HEK293T (HEK293T KO) and amplified response in PIEZO1-OE HEK293T (HEK293T OE) validated that the Ca2+ mobilization in HEK293T cell was PIEZO1 mediated. The number of data points (n number) is marked above the box and data are presented as box plots with medium, maxima, and minima, and analyzed by Welch’s ANOVA test. c F-actin accumulation divided the high PIEZO1 activity tongue from the body. Average intensity profile of calcium (magenta) and F-actin (cyan) along the symmetric axis was plotted.
Fig. 5
Fig. 5. F-actin accumulation influences PIEZO1 activity within the cellular protrusion.
a Schematic illustration of F-actin accumulation effect on PIEZO1 activity at the cell tongue. Top: At the early stage of aspiration, F-actin starts to move to the neck from both the body and tongue end of the aspirated cell. Bottom: When F-actin accumulates, accumulation impairs the lipid movement due to the aspiration which serves as a physical constriction (red) and thereby increases the membrane tension at the cell tongue. As a result, more PIEZO1 activation was expected as the membrane tension increased. bd Proportion of aspirated HEK293T WT cells that exhibited F-actin accumulation at ∆p = −5, −20, and −40 mmHg. More HEK293T WT cells had F-actin accumulated at the neck when the tip angle increased from θ = 0° (d), to θ = 5° (e) and θ = 10° (f). e Interval from the beginning of aspiration for F-actin developed accumulation at the neck. Despite stronger aspiration ∆p, a larger tip angle θ also boosted the F-actin accumulation. f F-actin mesh network modulates the constriction. The HEK293T cells were incubated with either 2.5 μM Latrunculin A (LatA) for 2 hrs, 100 μM CK-666 for 2 hrs to disrupt F-actin network, or 10 μM Jasplakinolide (Jasp) for 30 mins to further stabilize the F-actin network. Then the cells were aspirated and Ca2+ ∆Fmax were quantified. Results showed that F-actin network disruption would suppress the Ca2+ influx of the cell comparing the DMSO treated (vehicle, black) cells at ∆p = −25 and −40 mmHg, whereas network stabilization would further enhanced Ca2+ influx. The number of data points (n number) is marked above the box (e, f). Data are presented as box plots with medium, maxima, and minima, and analyzed by Welch’s ANOVA test. g, h Normalized maximal principal stress distribution simulation of an aspirated HEK293T cell. The cell was either no F-actin accumulation (g, (-) Accumulation), or with F-actin accumulation at the neck (h, (+) Accumulation). Maximum principal stress values were normalized based on the maximum value of both conditions. a is created with BioRender.com released under a Creative Commons Attribution-NonCommercial-NoDerivs 4.0 International license https://creativecommons.org/licenses/by-nc-nd/4.0/deed.en.
Fig. 6
Fig. 6. HEK293T PIEZO1 activity is influenced by F-actin mobility.
a, b Schematic illustration of fMPA on adhered (a) and suspended (b) HEK293T WT. To ensure HEK293T WT cells firmly adhered to the surface during aspiration, the cover glass was coated with fibronectin (FN). c, d 3D confocal images of adhered (c) and suspended (d) HEK293T WT cells. Both lateral and top view of the cells with F-actin (cyan) and DNA (orange) labeled are shown to illustrate the F-actin distribution in the cell. Three ROI lines were drawn to quantify F-actin signal along the line. e, f Normalized F-actin intensity along the ROIs in adhered (e) and suspended (f) cells. F-actin signal along the line showed that F-actin concentrated at the cell cortex to form organized structure when the cell is adhered to the FN-coated surface, indicated by the signal peaks on either end of the line (arrow pointed). g Snapshots of aspirated HEK293T cell that was adhered to FN-coated coverglass. The Ca2+ and F-actin intensities were concurrently imaged using a FV3000 confocal microscope. The contour of the attached HEK293T cell was outlined (white dash line) in the calcium and transmitted channels. White arrows showed that the pointed F-actin signal was immobilized during the whole aspiration process. h Ca2+ ∆Fmax comparison between adhered (red) and suspended (black) HEK293T WT cells aspirated by micropipette with different tip angles. The number of data points (n number) is marked, and data are presented as violin plot, and analyzed by Welch’s ANOVA test. i Activity of PIEZO1 in suspended and adhered HEK293T cells. A left shift in the Boltzmann distribution was noticed when the cell was suspended comparing to when cells were adhered. Quantified P1/2 demonstrated a lower gating pressure was required when cells were suspended. The number of measured cells is marked, and the data is presented as mean ± s.e.m. a, b are created with BioRender.com released under a Creative Commons Attribution-NonCommercial-NoDerivs 4.0 International license https://creativecommons.org/licenses/by-nc-nd/4.0/deed.en.
Fig. 7
Fig. 7. PIEZO1 co-localizes with F-actin during micropipette aspiration in HEK293T cells.
a, b Confocal images of hP1-mCherry−1591 HEK293T cell aspirated at ∆p = −25 mmHg by micropipette (θ = 10°). The F-actin (cyan, 1st row) and PIEZO1 (magenta, 2nd row) dynamics were monitored during aspiration using a spinning disk confocal microscope. Both adhered (a) and suspended (b) HEK293T cell showed PIEZO1 clusters (white arrow) movement from the cell body to the tongue during aspiration. The symmetric axis was drawn along the aspirating micropipette and across the cell body. Taking the fore-end of the cell body (i.e., left edge) as x = 0, mean PIEZO1 intensity was plotted across the adhered HEK293 (c) in (a) and suspended one (d) in (b), respectively. e PIEZO and F-actin co-localization were quantified during micropipette aspiration (θ = 10°). Number of cells tested is marked. The data was measured from two independent experiments and presented as mean ± s.e.m. f Suspended HEK293T cells had higher co-localization of PIEZO1/F-actin at both resting (t = 0 s) and aspirated time points (t = 5, 20 s) compared to aspirated HEK293T cells. Images demonstrate a concurrent movement of F-actin and PIEZO1 from the cell body to the cell tongue during aspiration in suspended HEK293T cells. n number is marked. Data was presented as violin plots and analyzed by Welch’s t test.
Fig. 8
Fig. 8. Microgeometry and F-actin interplay during fMPA modulate PIEZO1 activity at the tongue of aspirated cells.
Microgeometry parameters, such as tip angle θ and opening diameter d, globally enhance PIEZO1 activity on the cell membrane while F-actin filaments inside the cell concurrently respond to mechanical aspiration. Reorganized F-actin accumulates at the neck of the aspirated cell, acting as a physical constriction on the membrane to isolate the propagation of membrane tension from the tongue. Concentrated tension at the tongue induces PIEZO1 hyperactivity and results in strong calcium mobilization. Hinderance of F-actin accumulation at the neck, due to either lack of physical constriction (micropipette tip angle θ = 0°) or prohibited actin mobility when cells are adhered to the extracellular matrix, results in low PIEZO1 activity at the tongue. Figure is created with BioRender.com released under a Creative Commons Attribution-NonCommercial-NoDerivs 4.0 International license https://creativecommons.org/licenses/by-nc-nd/4.0/deed.en.

References

    1. Lu CH, et al. Membrane curvature regulates the spatial distribution of bulky glycoproteins. Nat. Commun. 2022;13:3093. doi: 10.1038/s41467-022-30610-2. - DOI - PMC - PubMed
    1. McNamara LE, et al. The role of microtopography in cellular mechanotransduction. Biomaterials. 2012;33:2835–2847. doi: 10.1016/j.biomaterials.2011.11.047. - DOI - PubMed
    1. Nikkhah M, Edalat F, Manoucheri S, Khademhosseini A. Engineering microscale topographies to control the cell-substrate interface. Biomaterials. 2012;33:5230–5246. doi: 10.1016/j.biomaterials.2012.03.079. - DOI - PMC - PubMed
    1. Lehnert D, et al. Cell behaviour on micropatterned substrata: limits of extracellular matrix geometry for spreading and adhesion. J. Cell Sci. 2004;117:41–52. doi: 10.1242/jcs.00836. - DOI - PubMed
    1. Reversat A, et al. Cellular locomotion using environmental topography. Nature. 2020;582:582–585. doi: 10.1038/s41586-020-2283-z. - DOI - PubMed

LinkOut - more resources