. 2024 Sep;43(17):3587-3603.
doi: 10.1038/s44318-024-00143-z. Epub 2024 Jul 1.

LINE-1 RNA triggers matrix formation in bone cells via a PKR-mediated inflammatory response

Affiliations

LINE-1 RNA triggers matrix formation in bone cells via a PKR-mediated inflammatory response

Arianna Mangiavacchi et al. EMBO J. 2024 Sep.

Erratum in

Abstract

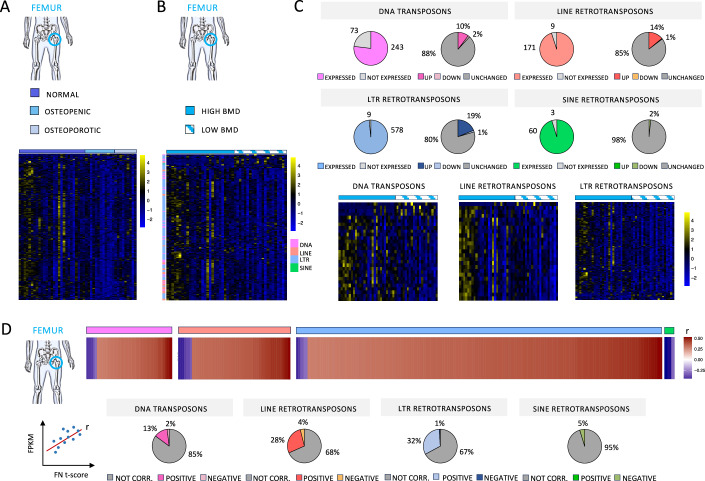
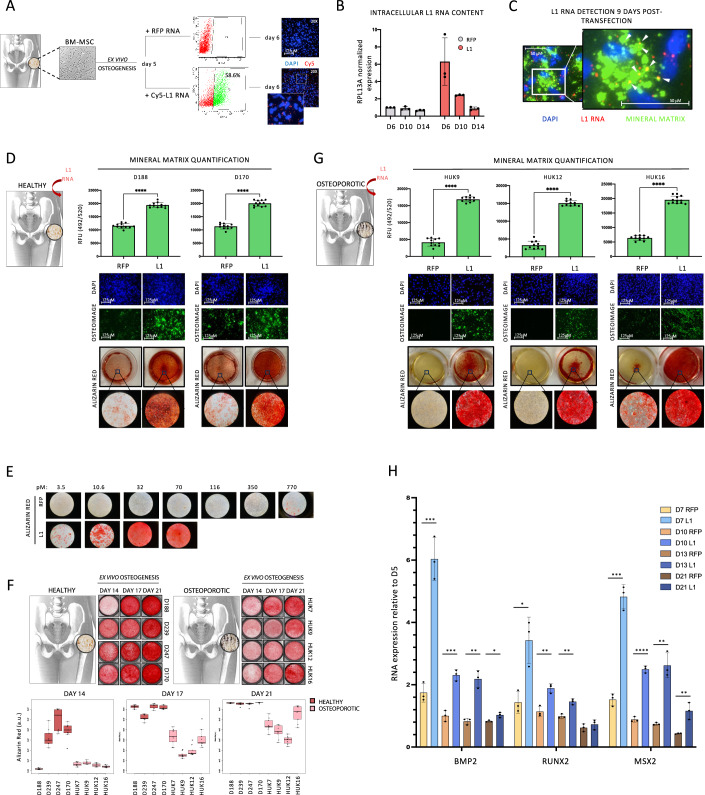
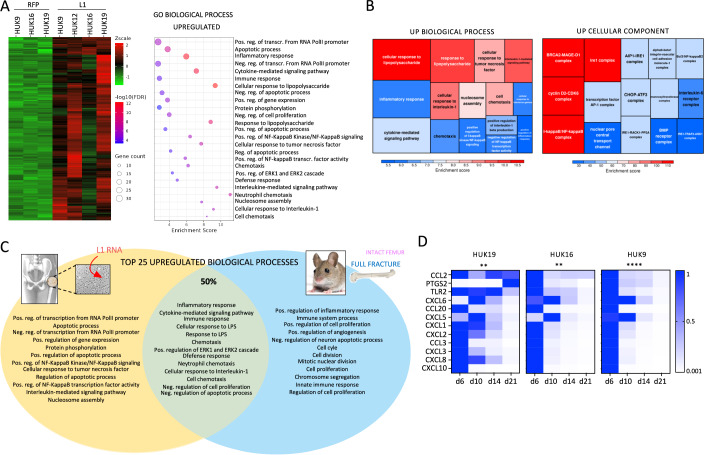
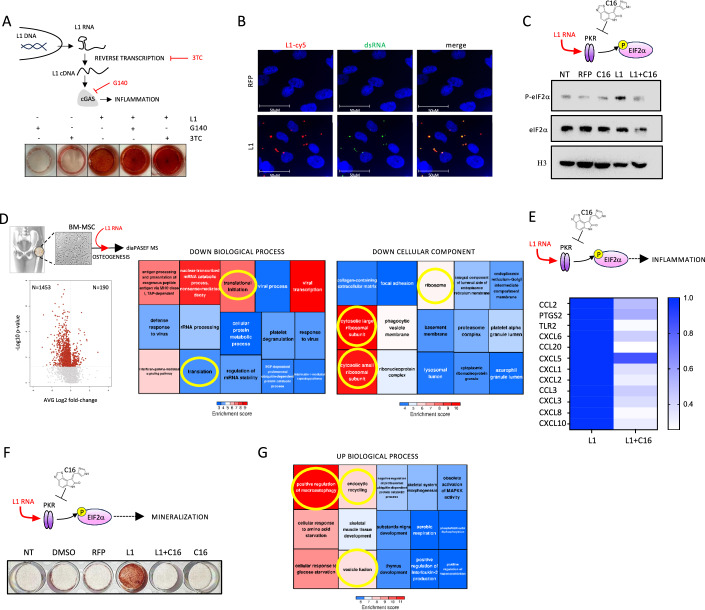
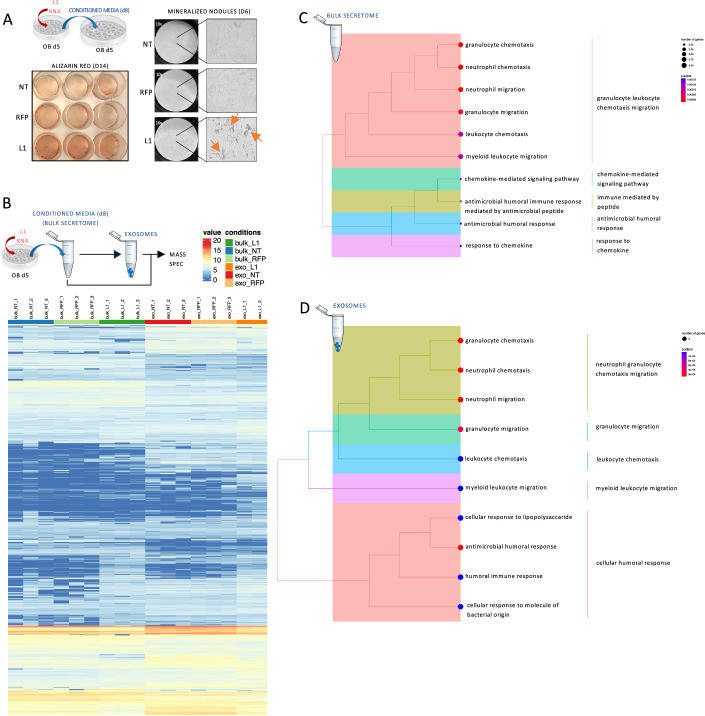
Transposable elements (TEs) are mobile genetic modules of viral derivation that have been co-opted to become modulators of mammalian gene expression. TEs are a major source of endogenous dsRNAs, signaling molecules able to coordinate inflammatory responses in various physiological processes. Here, we provide evidence for a positive involvement of TEs in inflammation-driven bone repair and mineralization. In newly fractured mice bone, we observed an early transient upregulation of repeats occurring concurrently with the initiation of the inflammatory stage. In human bone biopsies, analysis revealed a significant correlation between repeats expression, mechanical stress and bone mineral density. We investigated a potential link between LINE-1 (L1) expression and bone mineralization by delivering a synthetic L1 RNA to osteoporotic patient-derived mesenchymal stem cells and observed a dsRNA-triggered protein kinase (PKR)-mediated stress response that led to strongly increased mineralization. This response was associated with a strong and transient inflammation, accompanied by a global translation attenuation induced by eIF2α phosphorylation. We demonstrated that L1 transfection reshaped the secretory profile of osteoblasts, triggering a paracrine activity that stimulated the mineralization of recipient cells.

Keywords: Inflammation; Osteoblast; PKR; Transposable Elements; dsRNA.


Conflict of interest statement

The authors declare no competing interests.

Figures

Figure 1
Figure 1. TEs expression is induced after fracture and in mechanically loaded bone.
(A) Heatmap representation of RNAseq differentially expressed TEs (LogFC >0.5) between 4 h post-injury and intact femurs at different time points of the bone healing process. N = 5 biological replicates for each time point. N = 10 biological replicates for intact femur. (B) Heatmap representation of RNAseq upregulated TEs (LogFC >0.5) between 4 h and intact at different time points of the bone healing process. N = 5 biological replicates for each time point. N = 10 biological replicates for intact femur. (C) Heatmap representation of RNAseq differentially expressed TEs analysis [fragments per kilobase of transcript per million (FPKM) fold change] in femoral (n = 27) and iliac (n = 34) bone biopsies from healthy donors. (D) Pie charts showing the number and percentage of differentially expressed TEs subfamilies between femoral and iliac healthy bone. (E) Heatmap representation of RNAseq differentially expressed TEs analysis [fragments per kilobase of transcript per million (FPKM) fold change] in femoral (n = 27) and iliac (n = 34) bone biopsies from healthy donors. One heatmap for each TEs order is shown.
Figure 2
Figure 2. TEs expression correlates with bone mineral density in human weight-bearing bone.
(A) Heatmap representation of RNAseq differentially expressed TEs analysis [fragments per kilobase of transcript per million (FPKM) fold change] in femoral bone from healthy (n = 27), osteopenic (n = 12), and osteoporotic (n = 9) donors. (B) Heatmap representation of RNAseq differentially expressed TEs analysis [fragments per kilobase of transcript per million (FPKM) fold change] in femoral bone with high BMD (FN T-score >−1) (n = 27) and low BMD (FN T-score <−1) (n = 21). (C) Upper panels: pie charts showing the number and percentage of differentially expressed TEs subfamilies between high BMD and low BMD femoral bone. Lower panels: heatmap representation of RNAseq differentially expressed TEs analysis [fragments per kilobase of transcript per million (FPKM) fold change] in femoral bone with high BMD (n = 27) and low BMD (n = 21). One heatmap for each TEs order is shown. (D) Upper panels: Heatmap representation of correlation analysis (P value <0.05) between TEs expression (FPKM) and local BMD (FN T-score) in femoral bone biopsies (n = 48). The correlation between TE expression (FPKM values) and FN t-score was evaluated using Pearson method. Significant correlations (p value < 0.05) were selected for the heatmap representation and arranged according to the Pearson correlation coefficient (r). r > 0, positive correlations; r < 0, negative correlations. Lower panels: Pie charts showing the percentage of TEs subfamilies positively correlated to local BMD.
Figure 3
Figure 3. L1 RNA delivery stimulates the mineralization of differentiating osteoblasts.
(A) Experimental workflow and flow cytometer analysis showing the percentage of positive cells 6 h after L1 RNA delivery at day 5 of ex vivo osteogenesis. Intracellular localization of cy5 conjugated synthetic L1 RNA (red spots) three days after transfection is also shown from a typical experiment (right). (B) qPCR analysis of intracellular L1 RNA level 24 h (d6), 5 days (d10), and 9 days (d14) post-transfection. The graph is shown as mean ± sd of n  = 3 independent experiments. (C) cy5 conjugated synthetic L1 RNA (red) and osteoimage stained mineral matrix (green) detection 9 days post-L1 RNA transfection. The white arrowheads indicate the colocalization between L1 RNA and hydroxyapatite. (D) Osteoimage stained mineral matrix quantification (upper panels), images (central panels), and Alizarin Red (lower panels) 9 days after L1 RNA or RFP RNA delivery in two healthy donors-derived MSCs (D188 and D170). RFU relative fluorescence units. The graph is shown as mean ± sd of n = 11 technical replicates. ****P < 0.00005 in the Wilcoxon test. (E) Alizarin Red staining of osteoblasts transfected with increasing doses of RFP RNA (upper panels) and L1 RNA (lower panels). (F) Alizarin Red images (upper panel) and quantification (lower panel) of MSCs mineralization after 14, 17, and 21 days of ex vivo differentiation. MSCs were obtained from the femur of four healthy (D188, D239, D247, and D170) and four OP patients (HUK7, HUK9, HUK12, and HUK16). N = 9 technical replicates for each donor and time point. Boxes in the boxplot indicate the interquartile range (50% of data), while the lower end and the upper end represent the first and the third quartile, respectively. The solid line inside the box represents the median. Whiskers represent the max and min values. Values that are not within 1.5 times the interquartile range are considered outliers and lie outside the whiskers. (G) Osteoimage stained mineral matrix quantification (upper panels), images (central panels), and Alizarin Red (lower panels) 9 days after L1 RNA or RFP RNA delivery in three OP patients derived MSCs (HUK9, HUK12, and HUK16). RFU relative fluorescence units. The graph is shown as mean ± sd of n = 10–12 technical replicates. ****P < 0.00005 in the Wilcoxon test. (H) qRT-PCR of early osteogenic genes in RFP and L1-transfected osteoblasts at different time points of osteogenic differentiation. Expression level is normalized on day 5 (not transfected osteoblasts). N = 3 biological replicates. The graph is shown as mean ± sd of n = 3 independent experiments. *P < 0.05; **P < 0.005, ***P < 0.0005, ****P < 0.00005 in Student’s t-test. Source data are available online for this figure.
Figure 4
Figure 4. L1 RNA delivery induces an inflammatory response characteristic of the bone repair process.
(A) Left panel: heatmap representation of RNAseq differentially expressed gene analysis [fragments per kilobase of transcript per million (FPKM) fold change] in osteoblasts transfected with negative control RNA (RFP) or L1 RNA. Right panel: bubble plot showing gene ontology (GO) enrichment analysis of L1 upregulated biological processes. (B) Tree plot showing gene ontology (GO) enrichment analysis of L1 upregulated biological processes (left) and cellular components (right). (C) Top 25 upregulated biological processes 24 h post-L1 RNA delivery in vitro (yellow) and 4 h post fracture in vivo (blue). Shared GO terms are shown in green. (D) qPCR analysis of “inflammatory response” (GO:0006954) and “immune response” (GO:0006955) genes at different time points post-L1 RNA transfection at day 5. ***P < 0.005, ****P < 0.00005 in two way ANOVA. Source data are available online for this figure.
Figure 5
Figure 5. PKR mediates L1 RNA-induced stress response and mineralization.
(A) Upper panel: schematic representation of the pathway inhibited by Lamivudine 3TC and G140. Lower panel: Alizarin Red staining of differentiating osteoblasts transfected with L1 RNA and treated with Lamivudine 3TC and G140. (B) IF on RFP and L1-transfected osteoblasts, 6 h post-transfection, shows the colocalization between the cy5 signal (L1 RNA, red) and 488-Anti-dsRNA signal (dsRNA, green). Nuclei are stained with Hoechst (blue). (C) Western blot analysis showing the ratio between total eIF2α and phosphorylated eIF2α (P- eIF2α). H3: endogenous standard Histone 3. (D) Volcano plot (left) showing the number of significantly upregulated and downregulated protein 24 h post-L1 RNA transfection. Right: tree plots showing gene ontology (GO) enrichment analysis of biological processes (upper panel) and cellular components (lower panel) downregulated by L1 RNA delivery (MS data). (E) qPCR analysis of “inflammatory response” (GO:0006954) and “immune response” (GO:0006955) genes 24 h post-L1 RNA transfection with and without PKR inhibitor C16. (F) Alizarin Red staining of differentiating osteoblasts transfected with L1 RNA with and without PKR inhibitor C16. (G) Tree plots showing gene ontology (GO) enrichment analysis of biological processes upregulated by L1 RNA 24 h after transfection (MS data). Source data are available online for this figure.
Figure 6
Figure 6. L1-RNA-induced changes in osteoblast secretome.
(A) Left: Alizarin red staining on recipient osteoblasts (OB) 9 days after the delivery of conditioned media. Right: Microscope images of recipient OB 24 h from the delivery of conditioned media. Mineralized nodules in OB receiving conditioned media from L1-treated OB are shown (orange arrows). (B) Heatmap of differentially expressed proteins in bulk secretome and exosomes derived from untransfected (NT), RFP- and L1-transfected osteoblasts. N = 3 biological replicates. (C) GO enrichment analysis of differentially expressed protein (adjusted p value <0.05) in the bulk secretome of L1 compared to RFP-transfected osteoblasts. (D) GO enrichment analysis of differentially expressed protein (adjusted p value <0.05) in the exosomes of L1 compared to RFP-transfected osteoblasts. Source data are available online for this figure.

References

    1. Aerssens J, Boonen S, Joly J, Dequeker J (1997) Variations in trabecular bone composition with anatomical site and age: potential implications for bone quality assessment. J Endocrinol 155:411–421 - PubMed
    1. Alioli CA, Demesmay L, Laurencin-Dalacieux S, Beton N, Farlay D, Follet H, Saber A, Duboeuf F, Chun J, Rivera R et al (2020) Expression of the type 1 lysophosphatidic acid receptor in osteoblastic cell lineage controls both bone mineralization and osteocyte specification. Biochim Biophys Acta Mol Cell Biol Lipids 1865:158715 - PubMed
    1. Anderson BR, Muramatsu H, Nallagatla SR, Bevilacqua PC, Sansing LH, Weissman D, Karikó K (2010) Incorporation of pseudouridine into mRNA enhances translation by diminishing PKR activation. Nucleic Acids Res 38:5884–5892 - PMC - PubMed
    1. Angileri K, Nornubari A. Bagia and Feschotte C (2022) Transposons control as a checkpoint for tissue regeneration. Development 149:dev191957 - PMC - PubMed
    1. Bahney CS, Zondervan RL, Allison P, Theologis A, Ashley JW, Ahn J, Miclau T, Marcucio RS, Hankenson KD (2019) Cellular biology of fracture healing. J Orthop Res 37:35–50 - PMC - PubMed