. 2024 Aug;43(16):3494-3522.
doi: 10.1038/s44318-024-00153-x. Epub 2024 Jul 1.

YTHDC1 m6A-dependent and m6A-independent functions converge to preserve the DNA damage response

Affiliations

YTHDC1 m6A-dependent and m6A-independent functions converge to preserve the DNA damage response

Daniel Elvira-Blázquez et al. EMBO J. 2024 Aug.

Abstract

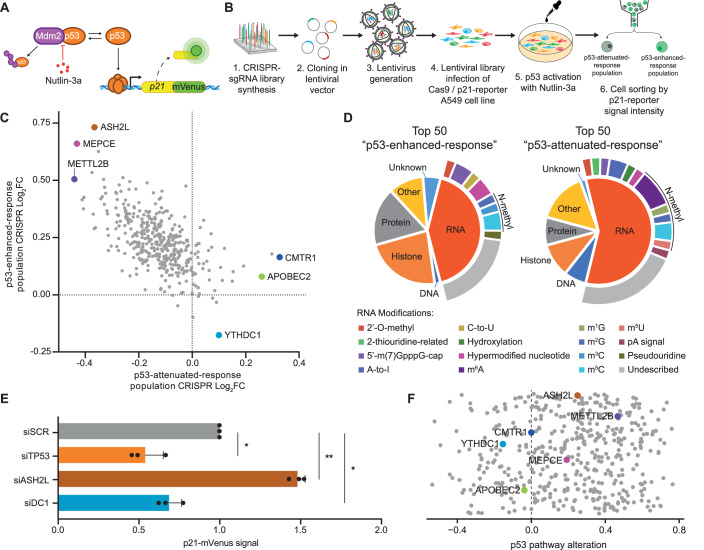
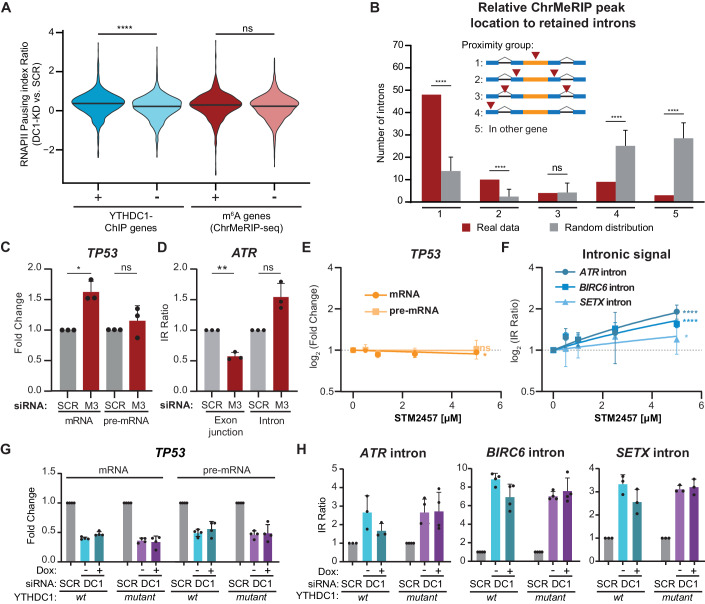
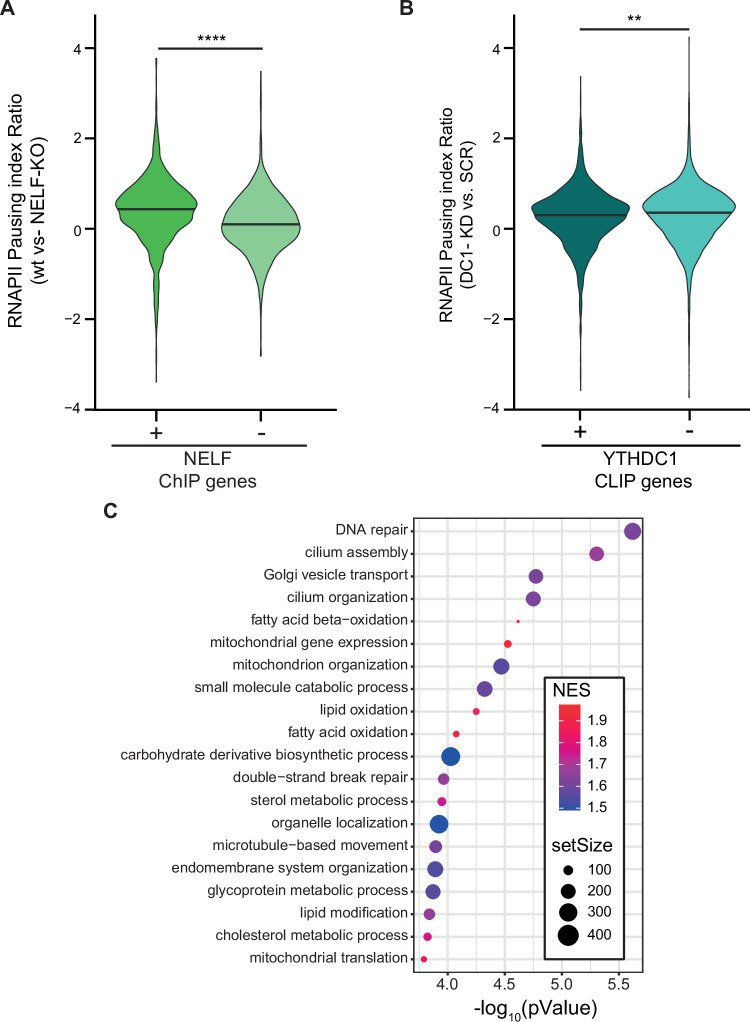
Cells have evolved a robust and highly regulated DNA damage response to preserve their genomic integrity. Although increasing evidence highlights the relevance of RNA regulation, our understanding of its impact on a fully efficient DNA damage response remains limited. Here, through a targeted CRISPR-knockout screen, we identify RNA-binding proteins and modifiers that participate in the p53 response. Among the top hits, we find the m6A reader YTHDC1 as a master regulator of p53 expression. YTHDC1 binds to the transcription start sites of TP53 and other genes involved in the DNA damage response, promoting their transcriptional elongation. YTHDC1 deficiency also causes the retention of introns and therefore aberrant protein production of key DNA damage factors. While YTHDC1-mediated intron retention requires m6A, TP53 transcriptional pause-release is promoted by YTHDC1 independently of m6A. Depletion of YTHDC1 causes genomic instability and aberrant cancer cell proliferation mediated by genes regulated by YTHDC1. Our results uncover YTHDC1 as an orchestrator of the DNA damage response through distinct mechanisms of co-transcriptional mRNA regulation.

Keywords: DDR; RNAPII Pausing; Splicing; YTHDC1; p53.


Conflict of interest statement

The authors declare no competing interests.

Figures

Figure 1
Figure 1. CRISPR screening enables unbiased identification of RNA modifiers involved in p53 response.
(A) Schematic representation of p21 endogenously tagged reporter system in A549 cell line. (B) Overview of the CRISPR-screening design. A library containing 1680 guide RNAs was cloned into a lentiviral system and used to infect A549 reporter cells. After 4 days of infection, cells were exposed to Nutlin-3a to allow for p53 protein stabilisation and subsequent reporter gene activation. Cells were sorted by FACS based on the level of reporter gene activation. (C) Scatter plot of Log2 Fold Change for sgRNA enrichment in p53-enhanced-response (Y axis) and p53-attenuated-response (X axis) populations. The three top candidates for each population are labelled and highlighted in the plot. (D) Functional annotation of the top 50 candidates for p53-enhanced and p53-attenuated populations based on their molecular activity. (E) In vitro validation of the top candidate for p53-enhanced and p53-attenuated populations. Each gene was independently silenced by siRNA. After silencing, mVenus signal was taken as readout of p21-reporter gene activation. Statistical analysis was performed by paired two-tailed Student’s t test KD versus scramble (SCR) control. (F) Pearson correlation score between p53-downstream-effector misregulation (p53 pathway) compared to the expression of the 407 CRISPR-Screening candidates in Lung carcinoma patients from TCGA (LUAD + LUSC patients) with p53 wild-type genotype versus healthy patients. Data information: All data are shown are representative of at least three independent experiments. Data are presented as mean ± s.d. *P ≤ 0.05, **P ≤ 0.01, paired two-tailed Student’s t test was performed in (E). Source data are available online for this figure.
Figure 2
Figure 2. YTHDC1 Directly regulates TP53 transcription.
(A) Representative immunoblot of YTHDC1 and p53, with GAPDH as loading control. Cells were transfected with siRNA against TP53, YTHDC1 or Scramble (SCR) as negative control. After silencing cells were treated to Nutlin-3a, DMSO was used for the untreated condition as a negative control. The bar plot shows protein quantification relative to GAPDH level of n = 5 biologically independent experiments. (B) TP53 RNA stability assay. Cells were transfected with siRNA, YTHDC1, or Scramble (SCR) as negative control. After silencing cells were treated with Actinomycin D to stop the transcription. Cells were collected at different time points indicated on the X axis to assess TP53 RNA level by quantitative RT-qPCR. In vitro transcribed Luciferase RNA was used as spike-in to normalise the signal. (C) RNA-level quantification of mature mRNA and pre-mRNA by RT-qPCR. Cells were transfected with siRNA against TP53 (orange), YTHDC1 (cyan) or Scramble (light grey) as negative control. (D) Genome browser tracks for total RNA-seq showing reads coverage over TP53 gene. Sequencing data were normalised as Fragments Per Kilobase of transcript per Million mapped reads (FPKM). (E) Volcano plot showing differentially expressed genes (DEGs) identified in YTHDC1-silenced cells versus scramble (SCR) cells. Genes with log2(FC) > 0.5 and Adjusted P value (Benjamin–Hochberg correction) <0.001, resulting from the DESeq2 analysis, are considered DEGs. Significantly upregulated, downregulated, or not changed genes in the YTHDC1 knocked-down cells are labelled with blue, red, or grey colour, respectively. (F) The Kyoto Encyclopedia of Genes and Genomes (KEGG) enrichment analysis showing pathways affected by DEGs identified in (E). Data information: All data are shown are representative of at least three independent experiments. Data are presented as mean ± s.d. ns not significant P > 0.05, *P ≤ 0.05, **P ≤ 0.01), ****P ≤ 0.0001, paired two-tailed Student’s t test was performed in (AC). DESeq2 Wald test P value was calculated in (E). Statistical test was intrinsically applied as explained in pathfinder pipeline (Ulgen et al, 2019) in (F). Source data are available online for this figure.
Figure 3
Figure 3. YTHDC1 modulates transcription through promoter-proximal pausing-release of RNA polymerase II.
(A) Heatmap displaying coverage within 6368 YTHDC1 peaks identified using MACS2, for RNAPII and YTHDC1 ChIP-seq experiments. A total of 29435 transcription start sites (TSS) were divided into two groups based on the presence (top) or absence (bottom) of YTHDC1 in a region spanning + and – 200 bp from the TSS. RNAPII ChIP-seq experiment was performed in cells transfected with siRNA, YTHDC1 (orange), or Scramble (light grey) as a negative control, and YTHDC1 ChIP-seq experiment (blue) was performed in parallel in native conditions. (B) Violin plots of the distribution of expression corrected RNAPII Pausing Index ratio calculated on the ChIP-seq experiment shown in (A). All the actively transcribed genes were divided into two different groups based on the presence or absence of YTHDC1 peaks in the TSS (cyan and blue, respectively). Pausing index was calculated as log2 RNAPII promoter density/RNAPII gene body density for both cells transfected with scramble (SCR) siRNA and YTHDC1 siRNA. Data are presented as the distribution of Pausing Index ratio for YTHDC1 knockdown versus SCR. (C) Genome browser tracks for a representative region of the human TP53 gene for the ChIP-seq experiment shown in (A). ChIP-seq was performed on cells transfected with scramble siRNA (light grey), and YTHDC1 siRNA (orange). YTHDC1 ChIP (cyan) and YTHDC1-CLIP (blue bondi) occupancy of the same region is shown in the bottom panel (cyan). Sequencing data were normalised as bins per million mapped reads (BPM). (D) Validation of ChIP-seq experiments performed in (AC) by RNAPII ChIP-qPCR. Crosslinked fragmented chromatin was immunoprecipitated with an antibody against RNAPII. After precipitation, genomic DNA was extracted and analysed by qPCR with primers covering the entire TP53 gene. Data are presented as relative fold change enrichment normalised against an intergenic region downstream from HSP90AA1 gene of one representative replicate. The X axis indicates the genomic distance of the region analysed relative to the TSS of the TP53 gene. ChIP-qPCR was performed on cells transfected with scramble siRNA (light grey), and YTHDC1 siRNA (cyan). Data information: All data are shown are representative of at least three independent experiments, except for (D). Data are presented as mean ± s.d. ****P ≤ 0.00001, paired two-tailed Student’s t test was performed in (B). Source data are available online for this figure.
Figure 4
Figure 4. YTHDC1 affects alternate splicing of factors involved in the DNA damage response.
(A) Alternative splicing analysis. The bar plot represents the number of aberrant splicing events identified by analysing total RNA-seq of cells depleted for YTHDC1 by siRNA. (B) Volcano plot showing the Δ-IRScore versus the -log10(adjusted p value), as calculated by IRFinder, for all the introns in the Gencode v19 annotation in YTHDC1-silenced cells versus scramble (SCR) cells. Genes with introns retained with an Adjusted P value < 0.1 are considered differentially retained. Significantly upregulated or downregulated intron-retained genes in the YTHDC1 knocked-down cells labelled in blue or red colour, respectively. (C) Genome browser tracks for total RNA-seq showing reads coverage over ATR, BIRC6 and SETX genes. Sequencing data were normalised as Fragments Per Kilobase of transcript per Million mapped reads (FPKM). Yellow boxes highlight differentially retained introns identified in (B). (DF) Representative immunoblot of ATR (D), BIRC6 (E) or SETX (F) and YTHDC1, with α-tubulin as loading control. Cells were transfected with siRNA against target, two independent siRNA against YTHDC1 (DC1-1 and -2) or Scramble (SCR) as negative control. (GI) RNA-level quantification of spliced or unspliced for ATR (G), BIRC6 (H) or SETX (I) mRNA by RT-qPCR. Cells were transfected with two independent siRNA against YTHDC1 (DC1-1 and -2, cyan), or Scramble (light grey) as negative control. qPCR primers were designed to target exon junction to evaluate correct splicing, or to target the retained intron. Data information: All data are shown are representative of at least three independent experiments. Intron Retention analysis and statistics in (B) has been applied through IRFinder pipeline (Middleton et al, 2017). Data are presented as mean ± s.d. **P ≤ 0.01), ***P ≤ 0.001, paired two-tailed Student’s t test was performed in (GI). Source data are available online for this figure.
Figure 5
Figure 5. YTHDC1 modulates RNAPII dynamics and splicing in a m6A-independent and dependent manner, respectively.
(A) Violin plots of the distribution of expression corrected Pausing Index ratio calculated on the ChIP-seq experiment shown in (A). All the actively transcribed genes were divided into four different groups based on the presence or absence of YTHDC1 peaks in the TSS (cyan and blue, respectively) and based on the presence or absence of m6A in the mRNA (light and dark red, respectively). Pausing index was calculated as log2 RNAPII promoter density/RNAPII gene body density for both cells transfected with scramble (SCR) siRNA and YTHDC1 siRNA. Data are presented as distribution of Pausing Index ratio for YTHDC1 knockdown versus SCR for each category. (B) Plot showing the number of differentially retained introns (dark red bars) and 1000 random selections of GENCODE v19 introns (light bars), classified in five different groups depending on the proximity to a ChrMeRIP peak (group 1: peak inside the intron; group 2: peak in adjacent exons; group 3: peak in adjacent introns; group 4: peak anywhere inside the gene; group 5: no peak inside the gene). Error bars represent twice the standard deviation. (C, D) RNA-level quantification of mature mRNA and pre-mRNA of TP53 (C) and intron retention of ATR (D) by RT-qPCR. Cells were transfected with siRNA against METTL3 (dark red), or Scramble (light grey) as a negative control. Statistical analysis was performed by paired two-tailed Student’s t test METTL3-KD versus scramble (SCR) control. ns, not significant P ≥ 0.05, *P ≤ 0.05. Data are presented as mean ± s.d. (E) RNA-level quantification of mature mRNA (orange) and pre-mRNA (light orange) by RT-qPCR for TP53 in A549 cells treated with increasing concentrations of STM2457. (F) Intron retention measurement for ATR, BIRC6 and SETX by RT-qPCR, normalising signal from their respective upstream exon junction in A549 cells treated with increasing concentrations of STM2457. (G) RNA-level quantification of TP53 mRNA and pre-mRNA levels in A549 cells that has been transfected with siRNA for endogenous YTHDC1 and induced expression of wt and mutant. (H) RNA-level quantification of intron retention for ATR, BIRC6 and SETX genes in A549 cells that has been transfected with siRNA for endogenous YTHDC1 and induced expression of wt and mutant. Data information: All data are shown are representative of at least three independent experiments. For (A), data are presented as mean ± s.d. ns, not significant P > 0.01, ****P ≤ 0.00001, paired two-tailed Student’s t test was performed. Empirical P value for (B) was obtained by randomising 100 times the selected introns to compared. For (CH), data are presented as mean ± s.d. ns, not significant P > 0.05, *P ≤ 0.05, **P ≤ 0.01, ****P ≤ 0.0001, paired two-tailed Student’s t test was performed. Source data are available online for this figure.
Figure 6
Figure 6. YTHDC1-dependent gene regulation ensures an effective cellular response to DNA damage.
(A) Representative images of COMET assay. Cells were transfected with two independent siRNA against YTHDC1 (DC1-1 and -2), siRNA against TP53, siRNA against ATR or Scramble (SCR) as negative control. After silencing cells were treated with cisplatin to induce DNA damage. One cell per condition was selected as representative of the total cells analysed. 100 µm are represented in scale bars. (B) Quantification of COMET assay experiments. Boxplot showing the percentage of DNA in the tail for the conditions described in (A). (C) Immunofluorescence quantification of γ-H2AX. Cells were transfected with two independent siRNA against YTHDC1 (DC1-1 and -2), siRNA against TP53, or Scramble (SCR) as negative control. After silencing cells were treated with cisplatin to induce DNA damage. After γ-H2AX immunostaining the cells were imaged. The boxplots represent the number of foci per area obtained analysing 100 images per replicate. (D) Flow cytometry quantification of γ-H2AX. Cells were transfected with siRNA against YTHDC1, siRNA against ATR, or Scramble (SCR) as negative control. After silencing cells were transfected with a plasmid expressing ATR to rescue the phenotype, or an empty plasmid as a control, then treated with cisplatin to induce DNA damage. After γ-H2AX immunostaining the cells were analysed by flow cytometry. The bar plot represents the average delta signal of γ-H2AX of treated versus cisplatin-treated cells. (E) Cell proliferation determined by MTS assay for cells transfected with two independent siRNA against YTHDC1 (DC1-1 and -2), or Scramble (SCR) as negative control. After silencing, viability was measured by absorbance at days indicated on the X axis. (F) Colony formation assay in cells transfected with siRNA against YTHDC1, or Scramble (SCR) as negative control. The bar plot represents the average number of colonies obtained. (G) Volume of tumours obtained after subcutaneous injection of A549 transfected with siRNA against YTHDC1, or Scramble (SCR) as negative control in immune-compromised mice. Twenty-seven days post injection the mice were sacrificed and the relative volume was quantified by imaging, image of tumours above of graph. The bar plot represents the average relative size of n = 6 samples for each condition. Data information: All data are shown are representative of at least three independent experiments, except for (C). Data are presented as mean ± s.d. ns, not significant P > 0.05, *P ≤ 0.05, **P ≤ 0.01, ****P ≤ 0.0001, paired two-tailed Student’s t test was performed in (BG). Boxplots represent the 25th and 75th percentiles, with mean as wider line, and outer line encompass values not considered as outlier, in (B, C). Source data are available online for this figure.
Figure EV1
Figure EV1. CRISPR screening enables unbiased identification of RNA modifiers involved in p53 response.
(A) Representative Immunoblot of p53, with GAPDH as loading control. Cells were treated with Nutlin-3a or untreated as negative control. (B) Nutlin-3a dose response treatment. P21-Reporter cells were treated with increasing doses of Nutlin-3a or untreated as negative control. After treatment, reporter gene activation was measured by flow cytometry. The percentage of cells showing reporter gene activation was calculated and presented in the plot of the signal distribution. (C) Representative immunoblot of spCas9, with a-tubulin as loading control. Cells were transduced with a lentivirus carrying spCas9 or an empty vector as negative control. (D) Flow cytometry quantification of P21-Reporter gene activation and CRISPR library infection for the two replicates used in the screening. (E) Scatter plot of log2 fold change for sgRNA enrichment in p53-enhanced and p53-attenuated populations. Each individual sgRNA for the three top candidates for each population is labelled and highlighted in the plot. Non-targeting sgRNAs used as negative controls in black. (F) Scatter plot of log2 fold change for gene enrichment in p53-enhanced and p53-attenuated populations. Previously reported negative or positive regulators of p53 activity are labelled in the plot in red and green, respectively. (G) Functional annotation of the top 50 candidates for p53-enhanced and p53-attenuated populations based on their molecular substrate. (H) RNA-level quantification of mature mRNA by RT-qPCR for YTHDC1 and ASH2L. Cells were transfected with two independent siRNA against YTHDC1 (DC1-1 and -2), two independent siRNA against ASH2L (ASH2L-1 and -2) or Scramble (SCR) as negative control. Data information: All data are shown are representative of at least three independent experiments, except for (C). Data are presented as mean ± s.d. ***P ≤ 0.001, ****P ≤ 0.0001, paired two-tailed Student’s t test was performed in (H).
Figure EV2
Figure EV2. YTHDC1 directly regulated TP53 transcription.
(A) YTHDC1 protein quantification. Cells were transfected with siRNA against TP53, YTHDC1 or Scramble (SCR) as negative control. After silencing cells were treated to Nutlin-3a, DMSO was used for the untreated condition as negative control. The bar plot shows protein quantification relative to GAPDH level of n = 5 biologically independent experiments. (B) c-Myc RNA stability assay. Cells were transfected with siRNA, YTHDC1, or Scramble (SCR) as negative control. After silencing cells were treated with Actinomycin D to stop the transcription. Cells were collected at different time points indicated on the X axis to assess c-Myc RNA level by quantitative RT-qPCR. In vitro transcribed Luciferase RNA was used as spike-in to normalise the signal. (C) Comprehensive profile of insertions and deletions (indels) in YTHDC1-KO A549 clone compared to a control A549 cells. (D) Representative picture of a Western blot of normal A549 cell line and the YTHDC1-KO A549 clone, together with relative quantification of 3 independent protein extractions from the same clone. (E) RNA-level quantification of mature mRNA and pre-mRNA by RT-qPCR for TP53 in A549 cells (grey) and YTHDC1-KO (dark blue). (FH) Correlation plot showing YTHDC1 and TP53 expression (as log2 TPM + 1 pseudocounts) in LUAD samples (n = 505) (B), in LUSC samples (n = 479) (C), and COAD samples (n = 427) (D) from TCGA database (gdc-portal.nci.nih.gov). Correlation P value is calculated using a t-distribution. (I) Correlation plot showing YTHDC1 and TP53 expression (as log2 TPM + 1 pseudocounts) in 824 cell lines grouped based on the tissue of origin from DepMap database (Tsherniak et al, , https://depmap.org/portal). Correlation P value is calculated using a t-distribution. (J) RNA-level quantification of mature mRNA by RT-qPCR for TP53 in multiple cell lines. MCF7, HeLa and HCT116 cell lines were transfected with two independent siRNA against YTHDC1 (DC1-1 and -2), or Scramble (SCR) as negative control. (K) RNA-level quantification of pre-mRNA by RT-qPCR for TP53 in multiple cell lines. MCF7, HeLa and HCT116 cell lines were transfected with two independent siRNA against YTHDC1 (DC1-1 and -2), or Scramble (SCR) as negative control. Data information: All data are shown are representative of at least three independent experiments. Data are presented as mean ± s.d. ns, not significant P > 0.05, *P ≤ 0.05, **P ≤ 0.01, ***P ≤ 0.001, ****P ≤ 0.0001, paired two-tailed Student’s t test was performed in (A, B, D, E, J, K).
Figure EV3
Figure EV3. RNAPII pausing upon YTHDC1 depletion mainly affects DNA repair.
(A) Violin plots of the distribution of expression corrected RNAPII Pausing Index ratio calculated for public dataset NELF ChIP-seq experiment. All the actively transcribed genes were divided into two different groups based on the presence or absence of NELF peaks in the TSS (green and light green blue, respectively). Pausing index was calculated as log2 RNAPII promoter density/RNAPII gene body density for both wild-type and NELK-KO cells. Data are presented as distribution of Pausing Index ratio for wild-type versus KO. (B) Violin plots of the distribution of expression corrected RNAPII Pausing Index ratio calculated for YTHDC1-CLIP-seq dataset. All the actively transcribed genes were divided into two different groups based on the presence or absence of YTHDC1 along the transcript (dark and light blue bondi). Pausing index was calculated as log2 RNAPII promoter density/RNAPII gene body density for both cells transfected with scramble (SCR) siRNA and YTHDC1 siRNA. Data are presented as distribution of Pausing Index ratio for YTHDC1 knockdown versus SCR. (C) Gene Set Enrichment Analysis (GSEA) of genes with an increased RNAPII Pausing Index upon YTHDC1 depletion. Data information: All data are shown are representative of at least three independent experiments. Data are presented as mean ± s.d. **P ≤ 0.001, ****P ≤ 0.00001, paired two-tailed Student’s t test was performed in (A, B). GSEA has been performed following Subramanian algorithm (Subramanian et al, 2005).
Figure EV4
Figure EV4. YTHDC1 directly promotes correct splicing.
(A) Volcano plot showing differentially expressed genes (DEGs) identified in YTHDC1-silenced cells versus scramble (SCR) cells. Genes with log2(FC) > 0.5 and Adjusted P value < 0.001, resulting from the DESeq2 DGA, are considered DEGs. Significantly upregulated, downregulated or not changed genes in the YTHDC1 knocked-down cells are labelled in blue, red or grey colour, respectively. (B) Schematic representation of truncated-version proteins for ATR, BIRC6 and SETX in negative control condition (grey) and YTHDC1-depleted condition (cyan), due to the emergence of premature stop-codons. (C) Schematic representation of primer design for quantitative PCR to detect spliced and unspliced isoforms of ATR, BIRC6 and SETX. An upstream exon-junction region we selected to normalise signal. (D) Plot showing the number of differentially retained introns (blue bondi bars) and 1000 random selections of GENCODE v19 introns (grey bars), classified in 5 different groups depending on the proximity to a YTHDC1-CLIP peak (group 1: peak inside the intron; group 2: peak in adjacent exons; group 3: peak in adjacent introns; group 4: peak anywhere inside the gene; group 5: no peak inside the gene). Error bars represent twice the standard deviation. (E) Relative distribution of YTHDC1-CLIP (blue bondi) and YTHDC1 ChIP (cyan) peaks over TSS (defined from TSS to 500 bp downstream) and splicing sites (5’ and 3’ splicing sites) along genome. (F) RNA-level quantification of intronic retention ratio by RT-qPCR for ATR, BIRC6 and SETX mRNA in A549 cells (grey) and YTHDC1-KO (dark blue). Data information: DESeq2 Wald test P value was calculated in (A). Empirical P value for (D) was obtained by randomising 100 times the selected introns to compared. Data are presented as mean ± s.d. ns, not significant P > 0.05, ****P ≤ 0.0001, paired two-tailed Student’s t test was performed in (D, F).
Figure EV5
Figure EV5. YTHDC1 modulates TP53 transcription independently of m6A and regulates the correct splicing of ATR, BIRC6 and SETX intron in a m6A-dependent manner.
(A) Genome browser tracks for RNAPII ChIP-seq of cell transfected with scramble siRNA (light grey) or siRNA against YTHDC1 (orange), YTHDC1 ChIP (cyan) YTHDC1-CLIP (blue bondi) and ChrMeRIP input (yellow) and m6A specific peaks (dark red), showing reads coverage over TP53 locus. Sequencing data were normalised as Fragments Per Kilobase of transcript per Million mapped reads (FPKM). (B) Genome browser tracks for total RNA-seq of cell transfected with scramble siRNA (light grey) or siRNA against YTHDC1 (cyan), YTHDC1-CLIP (blue bondi) and ChrMeRIP input (yellow) and m6A specific peaks (dark red), showing reads coverage over ATR, BIRC6 and SETX retained introns. Sequencing data were normalised as Fragments Per Kilobase of transcript per Million mapped reads (FPKM). (C) RNA-level quantification of mature mRNA by RT-qPCR for METTL3. Cells were transfected with two independent siRNA against METTL3 (M3-1 and -2) or Scramble (SCR) as negative control. (D) RNA-level quantification of spliced or unspliced for BIRC6 and SETX mRNA by RT-qPCR. Cells were transfected with siRNA against METTL3 (dark red), or Scramble (light grey) as negative control. (E) TLC quantification of the ratio between total amount of Adenosine nucleotides (A) and N6-methyladenosine nucleotides (m6A) of one representative replicate. (F) Representative western blot of HA-YTHDC1 wt and mutant versions upon doxycycline treatment with 20 and 200 ng/mL, respectively, from one of the experiments performed in Fig. 5G, H. (G) RNA-level quantification of endogenous YTHDC1 upon 3’-UTR designed siRNA transfection. (H, I) Parental A549 cells treated with concentrations of Doxycycline applied for YTHDC1 inducible system. Data information: All data are shown are representative of at least three independent experiments. For (C, D, G), data are presented as mean ± s.d. ns, not significant P > 0.05, *P ≤ 0.05, **P ≤ 0.01, ***P ≤ 0.001, paired two-tailed Student’s t test was performed.

Similar articles

Cited by

References

    1. Achour C, Bhattarai DP, Groza P, Román ÁC, Aguilo F (2023) METTL3 regulates breast cancer-associated alternative splicing switches. Oncogene 42(12):911–925 10.1038/s41388-023-02602-z - DOI - PMC - PubMed
    1. Akhtar J, Kreim N, Marini F, Mohana G, Brüne D, Binder H, Roignant JY (2019) Promoter-proximal pausing mediated by the exon junction complex regulates splicing. Nat Commun 10(1):1–17 10.1038/s41467-019-08381-0 - DOI - PMC - PubMed
    1. Akhtar J, Renaud Y, Albrecht S, Ghavi-Helm Y, Roignant JY, Silies M, Junion G (2021) m6A RNA methylation regulates promoter-proximal pausing of RNA polymerase II. Mol Cell 81(16):3356–3367.e6 10.1016/j.molcel.2021.06.023 - DOI - PubMed
    1. An J, Huang YC, Xu QZ, Zhou LJ, Shang ZF, Huang B, Wang Y, Liu XD, Wu DC, Zhou PK (2010) DNA-PKcs plays a dominant role in the regulation of H2AX phosphorylation in response to DNA damage and cell cycle progression. BMC Mol Biol 11(1):1–13 10.1186/1471-2199-11-18 - DOI - PMC - PubMed
    1. Anders S, Pyl PT, Huber W (2015) HTSeq—a Python framework to work with high-throughput sequencing data. Bioinformatics 31(2):166–169 10.1093/bioinformatics/btu638 - DOI - PMC - PubMed

MeSH terms