. 2024 Dec;31(12):1848-1858.
doi: 10.1038/s41594-024-01352-0. Epub 2024 Jul 1.

Asymmetric apical domain states of mitochondrial Hsp60 coordinate substrate engagement and chaperonin assembly

Affiliations

Asymmetric apical domain states of mitochondrial Hsp60 coordinate substrate engagement and chaperonin assembly

Julian R Braxton et al. Nat Struct Mol Biol. 2024 Dec.

Abstract

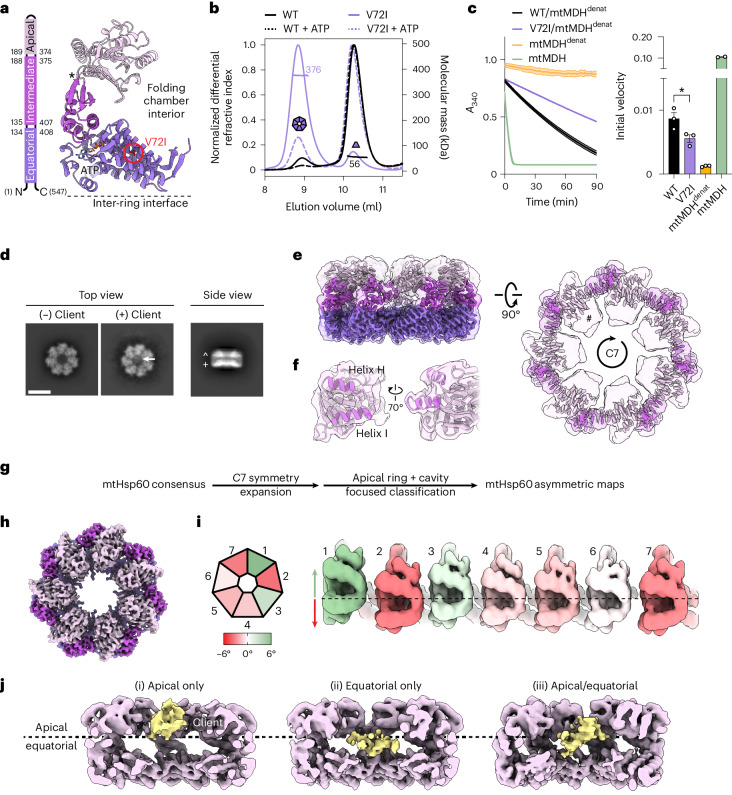
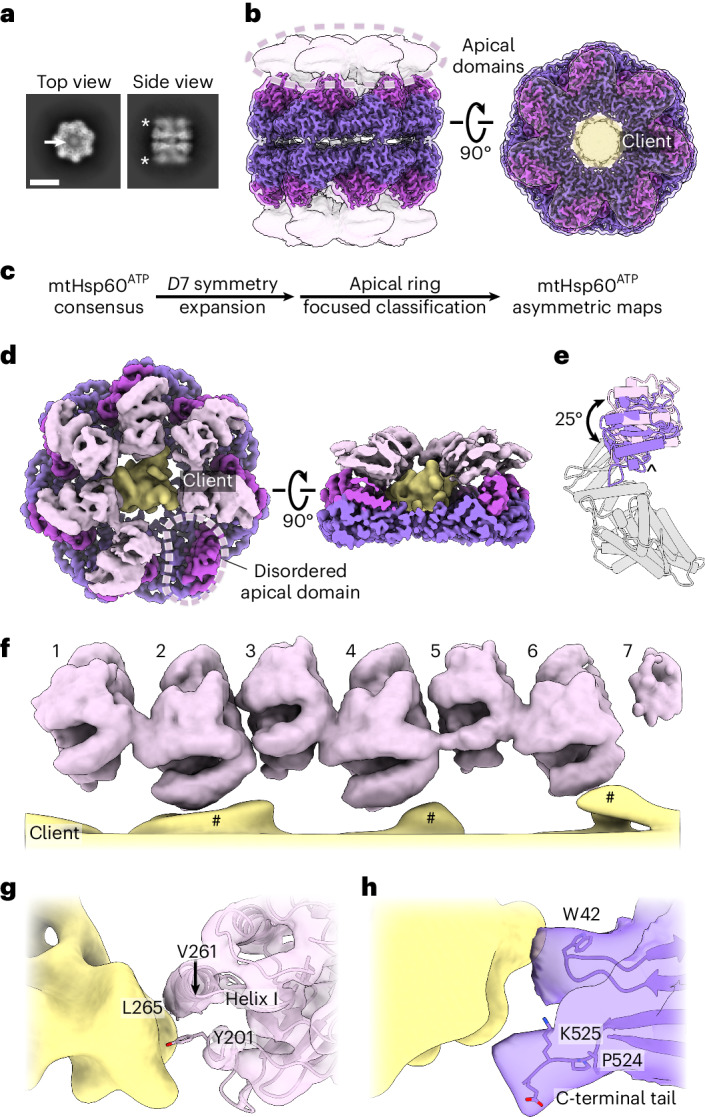
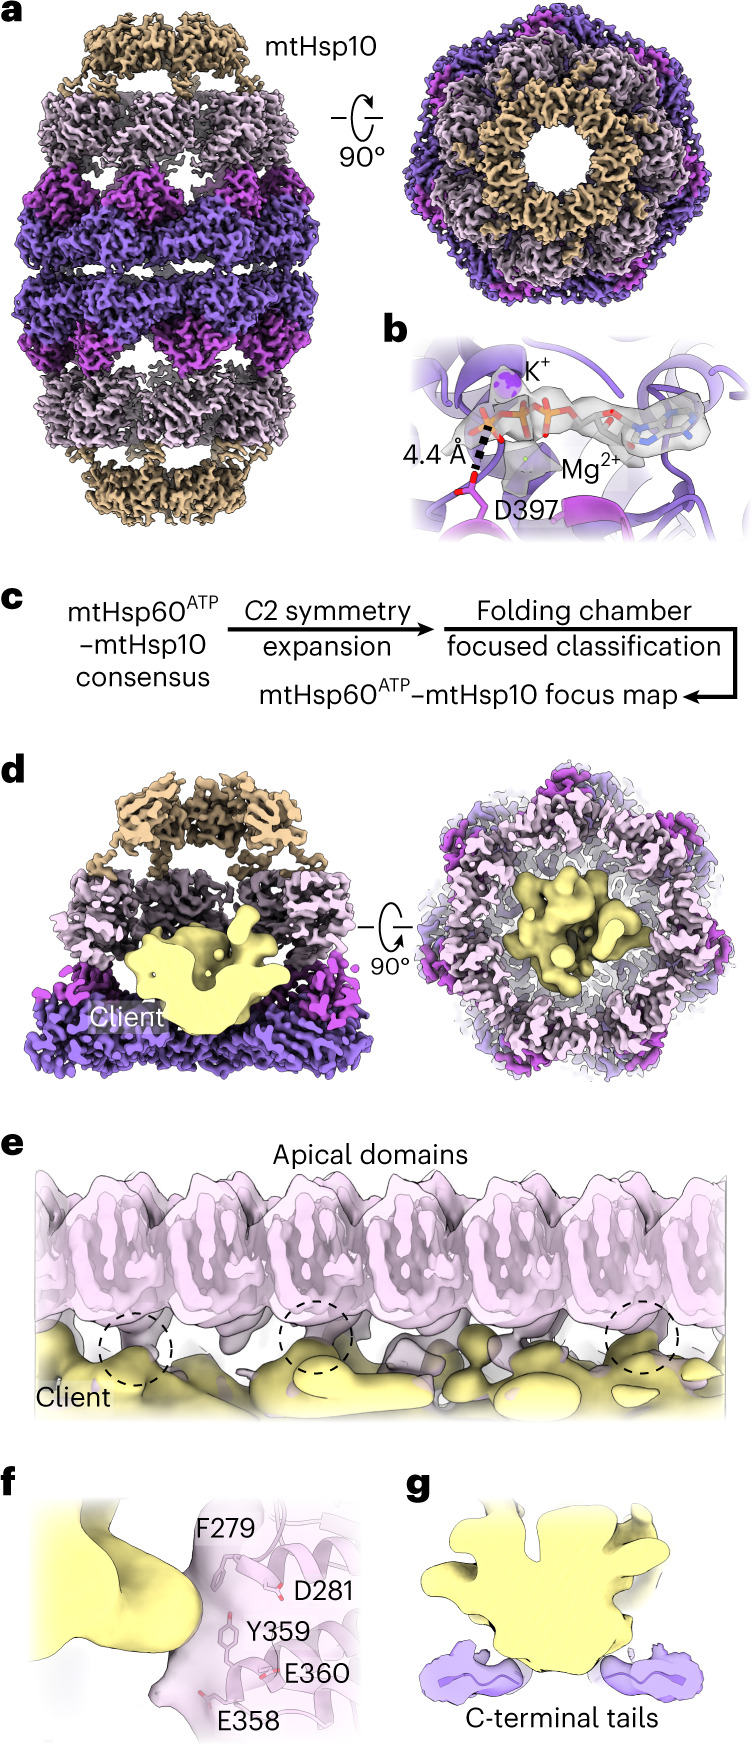
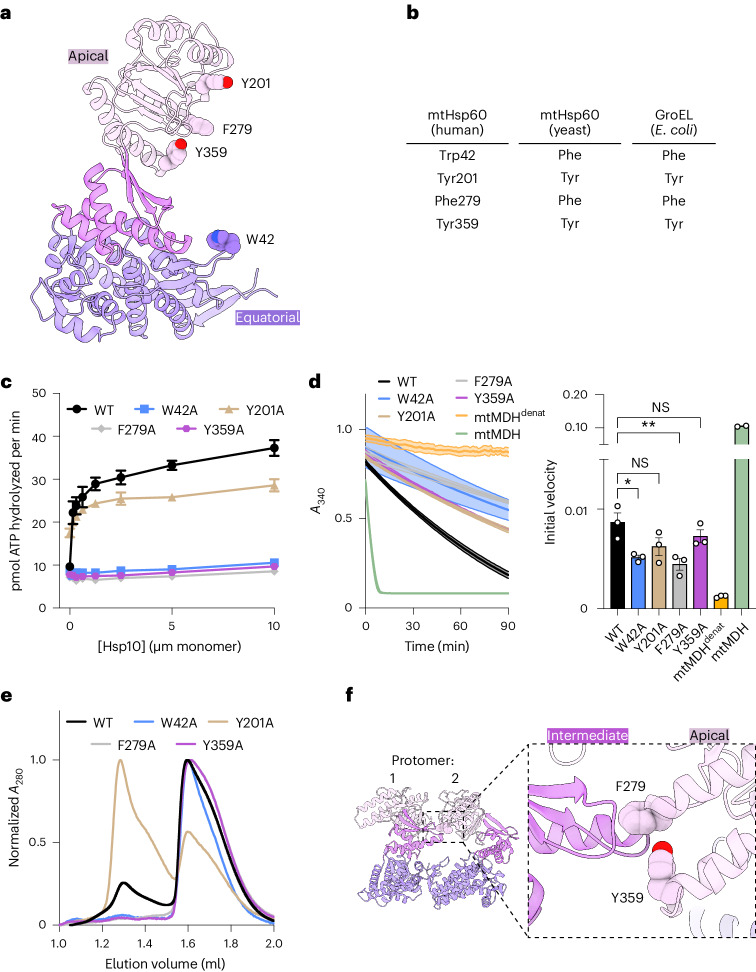
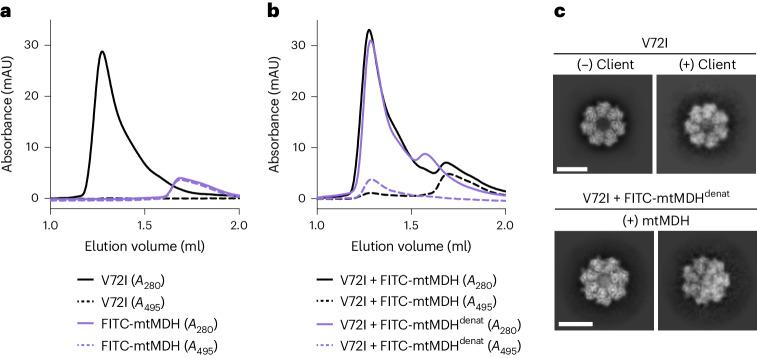
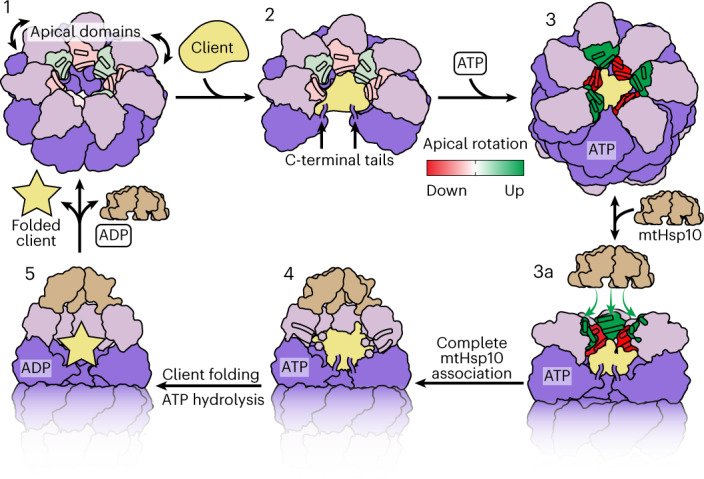
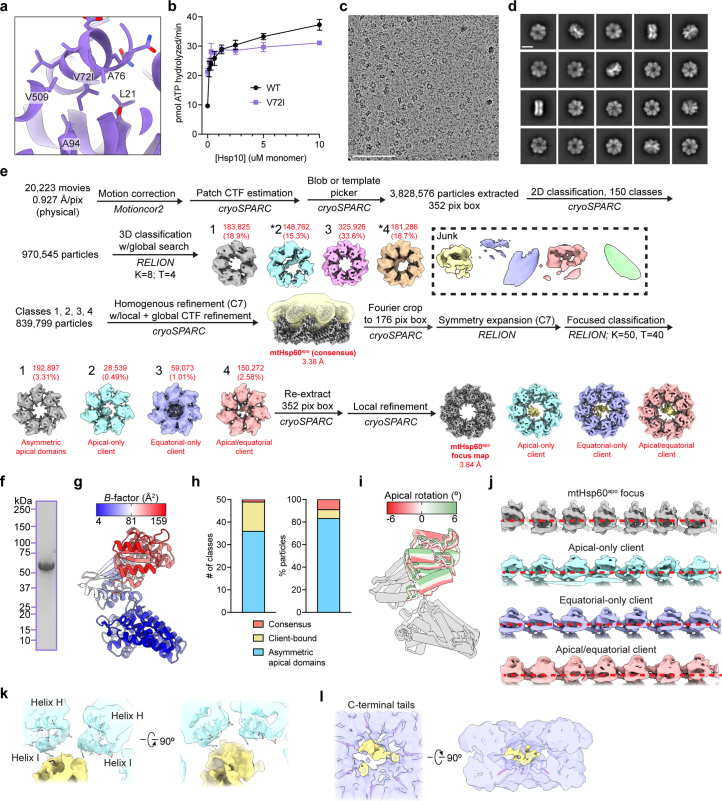
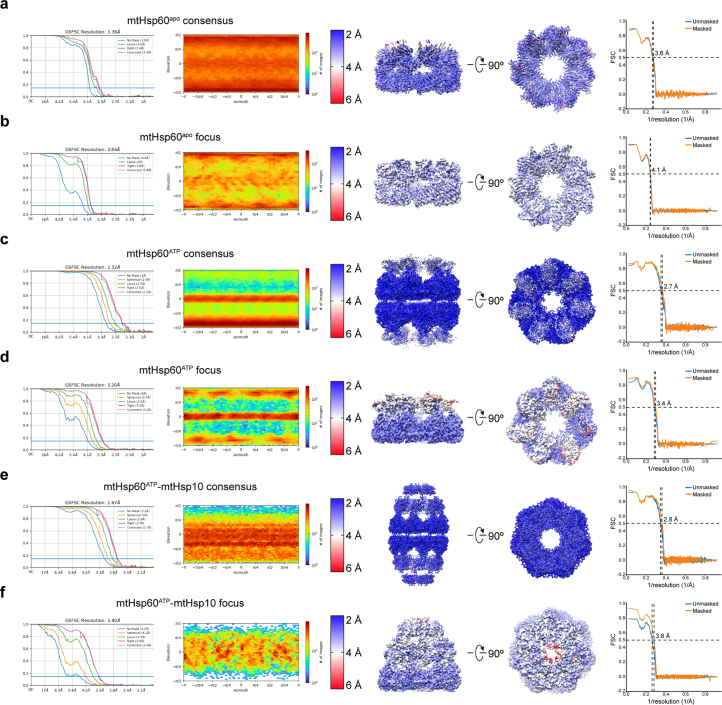
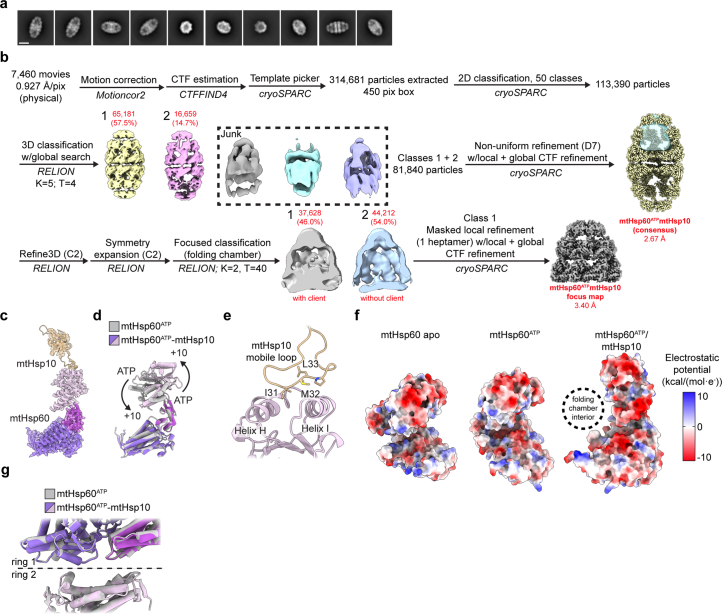
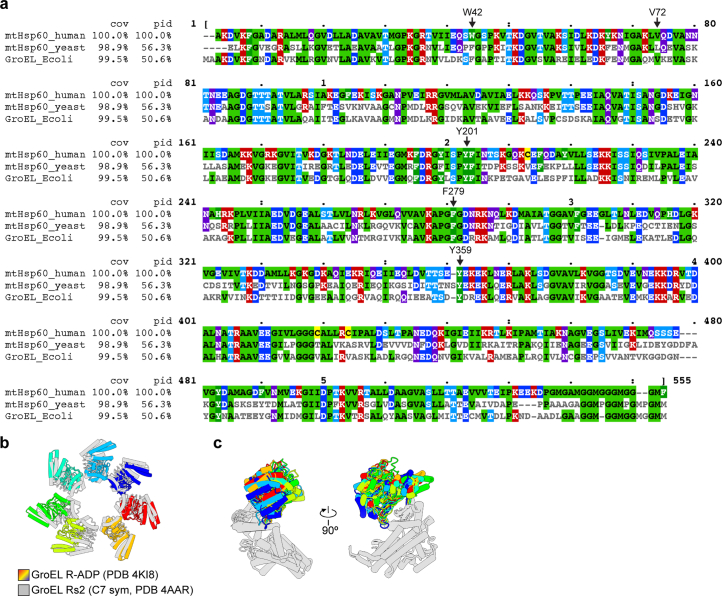
The mitochondrial chaperonin, mitochondrial heat shock protein 60 (mtHsp60), promotes the folding of newly imported and transiently misfolded proteins in the mitochondrial matrix, assisted by its co-chaperone mtHsp10. Despite its essential role in mitochondrial proteostasis, structural insights into how this chaperonin progresses through its ATP-dependent client folding cycle are not clear. Here, we determined cryo-EM structures of a hyperstable disease-associated human mtHsp60 mutant, V72I. Client density is identified in three distinct states, revealing interactions with the mtHsp60 apical domains and C termini that coordinate client positioning in the folding chamber. We further identify an asymmetric arrangement of the apical domains in the ATP state, in which an alternating up/down configuration positions interaction surfaces for simultaneous recruitment of mtHsp10 and client retention. Client is then fully encapsulated in mtHsp60-10, revealing prominent contacts at two discrete sites that potentially support maturation. These results identify distinct roles for the apical domains in coordinating client capture and progression through the chaperone cycle, supporting a conserved mechanism of group I chaperonin function.


Conflict of interest statement

Competing interests: The authors declare no competing interests.

Figures

Fig. 1
Fig. 1. Analysis and structures of apo-mtHsp60V72I.
a, Structural schematic of mtHsp60 domains showing V72I mutation (red circle), ATP and the apical–intermediate domain hinge (asterisk). b, SEC-MALS of mtHsp60 (black) and mtHsp60V72I (purple) with (dashed lines) and without (solid lines) ATP. Normalized differential refractive index (left y axis) and average molecular mass (horizontal lines, right y axis) are shown versus elution volume (x axis). This experiment was repeated a total of three times with similar results. c, mtHsp60–10 refolding of chemically denatured human mtMDH, measured by the decrease in NADH absorbance at 340 nm (left, one biological replicate, data are presented as the mean ± s.d. of technical triplicates). Initial velocities are shown (right, data are presented as the mean ± s.e.m. of two or three biological replicates, overlaid with individual values). Significance testing was performed by one-way analysis of variance, with correction for multiple comparisons by Dunnett’s test. *P = 0.0305. Folded (green) and denatured mtMDH (mtMDHdenat) (orange) are shown for comparison. d, Top and side view 2D class averages of client-bound and client-unbound mtHsp60V72I with client (arrow), and equatorial (+) and apical (^) domains indicated (Scale bar, 100 Å). e, Top and side views of the sharpened (opaque) and unsharpened (transparent) mtHsp60apo consensus maps are shown, colored as in a. AD density is absent in the sharpened map contour, indicated in the top view (#). f, Map and model view of an mtHsp60apo AD, with inward-facing helices H and I (dark purple) that are poorly resolved and flexible. g, Cryo-EM processing workflow to obtain maps with client and asymmetric AD conformations. h, Top view of the sharpened mtHsp60apo focus map, showing improved AD density. i, Heptamer schematic (left) and unwrapped view of the ADs of the unsharpened mtHsp60apo focus map colored to indicate AD rotation. Positive values (green) indicate an upward rotation (increased equatorial–apical distance) and negative values (red) indicate a downward rotation relative to the consensus map (dashed line). j, Slabbed side views of focused classifications showing unannotated client density (yellow) in different positions across the apical/equatorial regions. Source data
Fig. 2
Fig. 2. ATP-mtHsp60V72I structure and client contacts.
a, Top and side view 2D class averages of ATP-bound mtHsp60V72I. Client density (arrow) and the flexible, lower resolution ADs (asterisk) are indicated. Scale bar, 100 Å. b, Sharpened (opaque) and unsharpened (transparent) maps of consensus ATP-bound mtHsp60V72I, colored as in Fig. 1, showing lower-resolution AD density (circled) and the central density corresponding to client (yellow) in the top view (right). c, Cryo-EM processing workflow to capture asymmetric AD conformations. d, mtHsp60ATP focus map, shown as unsharpened mtHsp60 density overlaid with segmented and 8 Å low-pass filtered client density. Note the lack of density for one AD (circled). e, Aligned AD ‘up’ (pink) and ‘down’ (purple) conformations, showing a 25° rigid-body rotation between states. The AD underlying segment (below helices H and I) is indicated (^). f, Unwrapped view of the ADs and client in the mtHsp60ATP focus map from d, showing alternating up and down AD conformations. Note that client extensions (#) are only proximal to ‘down’ protomers (2, 4, 6), and the weak AD density for protomer 7 at the symmetry-mismatched interface. g,h, Putative ‘down’ AD (g) and equatorial domain (h) client contacts. Client is shown as an 8 Å low-pass filtered map and mtHsp60 is shown as models overlaid with transparent unsharpened maps.
Fig. 3
Fig. 3. ATP state mtHsp60–10 structure and client contacts.
a, Sharpened 2.7 Å resolution map of mtHsp60ATP–mtHsp10, (mtHsp60 colored as in Fig. 1, mtHsp10 in brown). b, Nucleotide-binding pocket of mtHsp60ATP–mtHsp10, showing density for ATP and the γ-phosphate thereof, and Mg2+ and K+ ions (gray, from sharpened map). c, Cryo-EM processing workflow to obtain the mtHsp60ATP–mtHsp10 focus map with resolved client density. d, Slabbed views of the focus map showing the mtHsp10-capped chamber encapsulating client, shown as a segmented, 8 Å low-pass filtered density (yellow). e, Unwrapped view of the mtHsp60ATP–mtHsp10 focus map from d, showing client contact with multiple ADs (circled). f,g, Enlarged map and model views of AD–client contacts with putative interaction residues labeled (f) and mtHsp60 C-terminal tail-client contacts (maps low-pass filtered to 8 Å) (g).
Fig. 4
Fig. 4. Mutational analysis of client-contacting mtHsp60 residues.
a,b, mtHsp60 protomer showing putative aromatic client-contacting residues (a) and conservation across human and yeast mtHsp60 and GroEL (b). c, Steady-state ATPase activity of mtHsp60 mutants versus concentration of mtHsp10. A representative experiment of three biological replicates is shown; data are presented as mean ± s.d. d, Enzymatic activity of chemically denatured human mtMDH refolded by mtHsp60 mutants (left, representative of three biological replicates). Data are presented as mean ± s.d. Initial velocities of absorbance curves from two or three biological replicates are shown on the right; data are presented as mean ± s.e.m. overlaid with individual values. Significance testing was performed by one-way analysis of variance, with correction for multiple comparisons by Dunnett’s test. *P = 0.0305; **P = 0.0043; NS, not significant. e, Analytical SEC traces of mtHsp60 mutants, showing complete monomerization of W42A, F279A and Y359A mutants. This experiment was repeated a total of three times with similar results. f, Model of two apo-mtHsp60 protomers, showing AD residues F279 and Y359 contacting the intermediate domain of an adjacent protomer. Source data
Fig. 5
Fig. 5. Analysis of the mtHsp60–mtMDH client complex.
a, Analytical SEC traces of mtHsp60V72I (black) and folded FITC-mtMDH (purple). Solid lines are the A280 traces and dashed lines are the A495 traces. This experiment was repeated a total of three times with similar results. b, As in a, but for V72I incubated with folded FITC-mtMDH (black) or guanidine-denatured FITC-mtMDH (purple). Note the minimal coelution of mtHsp60 with folded FITC-mtMDH, compared with quantitative coelution with denatured FITC-mtMDH. This experiment was repeated a total of three times with similar results. c, Selected 2D top view class averages from the mtHsp60apo dataset (upper), showing classes with no or weak client density, and from the dataset with denatured FITC-mtMDH added (lower), showing much stronger client density. Scale bars, 100 Å. mAU, milli-absorbance unit. Source data
Fig. 6
Fig. 6. Model of conformational changes in the client-engaged mtHsp60 reaction cycle.
State 1, ADs (pink) of mtHsp60apo heptamers are flexible and exhibit modest rotation about the apical–intermediate hinge, denoted by coloration of helices H and I. State 2, Client binding to mtHsp60apo preserves AD asymmetry, and client can localize to multiple depths of the heptamer, facilitated by mtHsp60 ADs and the flexible C-terminal tails. State 3, ATP binding induces the dimerization of heptamers through the equatorial domains and a more-pronounced AD asymmetry in an alternating up/down arrangement. ADs in ‘down’ protomers (red) contact client, whereas those in ‘up’ protomers (green) are competent to bind mtHsp10. State 3a, mtHsp10 initially binds the mtHsp60 heptamer using the three upward-facing ADs; all ADs then transition to the conformation observed in the mtHsp10-bound complex (state 4). After ATP hydrolysis and client folding (state 5), client, mtHsp10 and ADP are released, and the double-ring complex disassociates into heptamers.
Extended Data Fig. 1
Extended Data Fig. 1. Biochemical and cryo-EM analysis of apo mtHsp60V72I.
(a) View of V72I mutation in mtHsp60apo, colored as in Fig. 1a. Adjacent hydrophobic residues are also labeled. (b) Steady-state ATPase activity of mtHsp60 (black) and mtHsp60V72I (purple) as a function of mtHsp10 concentration. A representative experiment of three biological replicates is shown. Data are presented as mean ± s.d. (c) Representative micrograph from the mtHsp60apo dataset. Scale bar equals 100 nm. (d) Representative 2D class averages from the mtHsp60apo dataset. Scale bar equals 100 Å. (e) Cryo-EM processing workflow for structures obtained from the mtHsp60apo dataset. The mask used for focused classification is shown in transparent yellow with the consensus map. Client-containing maps from the initial 3D classification are indicated (*). (f) Coomassie Brilliant Blue-stained SDS-PAGE gel of recombinant mtHsp60V72I, showing no strong additional bands corresponding to other proteins. This experiment was repeated a total of two times with similar results. (g) Protomer of mtHsp60apo consensus colored by B-factor. (h) Class distributions of the mtHsp60apo focused classification job, shown by number of classes (left) and number of particles (right). Resulting classes either had asymmetric apical domain conformations with improved map quality (blue, relative to the consensus structure) or client density in the central cavity (yellow). One class (salmon), representing ~9% of the data, resembles the consensus state and likely represents particles that were not classified correctly (that is, an artifact). (i) Overlay of mtHsp60apo focus protomers, with apical domains colored as in Fig. 1i. (j) Unwrapped views of unsharpened mtHsp60apo focus and client-bound maps, showing apical domain asymmetry and client density (where applicable). Horizontal red dashed lines are for clarity. (k) Enlarged view of apical domain helices H and I from the mtHsp60apo apical-only client map. (l) Enlarged view of resolved portions of C-terminal tails from the mtHsp60apo equatorial-only client map. Source data
Extended Data Fig. 2
Extended Data Fig. 2. Cryo-EM densities and resolution estimation from the mtHsp60V72I datasets.
(a to f) Fourier Shell Correlation (FSC) curves, orientation distribution plots, sharpened maps colored by local resolution (0.143 cutoff), and map-model FSC curves for (a) mtHsp60apo consensus, (b) mtHsp60apo focus, (c) mtHsp60ATP consensus, (d) mtHsp60ATP focus, (e) mtHsp60ATP-mtHsp10 consensus, and (f) mtHsp60ATP-mtHsp10 focus structures. Displayed model resolutions for map-model FSC plots were determined using the masked map.
Extended Data Fig. 3
Extended Data Fig. 3. Cryo-EM analysis of ATP-bound mtHsp60V72I.
(a) Representative 2D class averages from the mtHsp60ATP dataset. Scale bar equals 100 Å. Top views of single ring complexes are indicated (*). (b) Cryo-EM processing workflow for structures obtained from the mtHsp60ATP dataset. The mask used for focused classification is shown in transparent yellow with the consensus map. Protomers from focused classification maps are colored in green (apical domain facing upward), red (apical domain facing downward), or gray (disordered apical domain). Class 1 was selected for refinement based on visual assessment of map quality. (c) View of an apical domain from the unsharpened mtHsp60ATP consensus map and associated model. (d) Nucleotide binding pocket of mtHsp60ATP, showing density for ATP and the γ-phosphate thereof, and Mg2+ and K+ ions (gray, from sharpened map). (e) Overlay of consensus mtHsp60apo and mtHsp60ATP models, aligned by the equatorial domain, showing a downward rotation of the intermediate and apical domains in the ATP-bound state. (f) Inter-ring interface of the sharpened mtHsp60ATP consensus map and fitted model, showing contact at the left interface mediated by helix P, but no contact at the right interface. Each protomer is colored a different shade of purple. (g) Unsharpened map and model of ordered apical domains of mtHsp60ATP focus. ‘Down’ protomers are colored purple, ‘up’ protomers are colored pink. (h) Modeling of two adjacent ATP-bound ‘up’ (left) or ‘down’ (right) protomers, generated by aligning a copy of chain C of mtHsp60ATP focus with chain D (up pair) or a copy of chain D with chain C (down pair). A large clash is observed with two adjacent down protomers, while two adjacent up protomers appear compatible.
Extended Data Fig. 4
Extended Data Fig. 4. Cryo-EM analysis of ATP/mtHsp10-bound mtHsp60V72I.
(a) Representative 2D class averages from the mtHsp60ATP-mtHsp10 dataset. Scale bar equals 100 Å. (b) Cryo-EM processing workflow for structures obtained from the mtHsp60ATP-mtHsp10 dataset. The mask used for subsequent focused classification is shown (transparent blue) on the consensus D7 refinement. (c) Sharpened map and model for the asymmetric unit of the mtHsp60ATP-mtHsp10 consensus structure. (d) Overlay of consensus models for mtHsp60ATP and mtHsp60ATP-mtHsp10 structures, showing identical equatorial and intermediate domain conformations but a large upward apical domain rotation. (e) Model of the mtHsp10 mobile loop and associated mtHsp60 apical domain in the mtHsp60ATP-mtHsp10 consensus map, showing interaction of conserved hydrophobic residues with apical domain helices H and I. (f) Coulombic potential maps of protomers of mtHsp60 apo, mtHsp60ATP, and mtHsp60ATP-mtHsp10 consensus structures, showing increased negative charge in the inward-facing regions of mtHsp60ATP-mtHsp10. (g) Overlay of consensus models for mtHsp60ATP and mtHsp60ATP-mtHsp10 structures, showing highly similar inter-ring conformations.
Extended Data Fig. 5
Extended Data Fig. 5. Sequence alignments and structural comparisons of group I chaperonins.
(a) Alignments of mature human (residues 27-end) and yeast (Saccharomyces cerevisiae, residues 26-end) mitochondrial Hsp60 and E. coli GroEL amino acid sequences. Residues mutated in this study are indicated (numbering corresponds to the human sequence). Cov = covariance relative to the human sequence, Pid = percent identity relative to the human sequence. (b) Overlay of apical domains of asymmetric GroEL (R-ADP state, PDB 4KI8, colors) with symmetric state (Rs2, PDB 4AAR, gray), aligned by the equatorial and intermediate domains, showing deviations from C7 symmetry. (c) Overlay of all protomers of the GroEL R-ADP state (PDB 4KI8), aligned by the equatorial and intermediate domains, showing large variability in apical domain conformation. Apical domains are colored, other domains in gray.

Update of

References

    1. Balchin, D., Hayer-Hartl, M. & Hartl, F. U. In vivo aspects of protein folding and quality control. Science353, aac4354 (2016). - PubMed
    1. Horwich, A. L. & Fenton, W. A. Chaperonin-assisted protein folding: a chronologue. Q. Rev. Biophys.53, e4 (2020). - PubMed
    1. Yébenes, H., Mesa, P., Muñoz, I. G., Montoya, G. & Valpuesta, J. M. Chaperonins: two rings for folding. Trends Biochem. Sci.36, 424–432 (2011). - PubMed
    1. Hayer-Hartl, M., Bracher, A. & Hartl, F. U. The GroEL–GroES chaperonin machine: a nano-cage for protein folding. Trends Biochem. Sci.41, 62–76 (2016). - PubMed
    1. Fenton, W. A., Kashi, Y., Furtak, K. & Horwich, A. L. Residues in chaperonin GroEL required for polypeptide binding and release. Nature371, 614–619 (1994). - PubMed