. 2024 Jul 1;7(1):795.
doi: 10.1038/s42003-024-06483-0.

PEX3 promotes regenerative repair after myocardial injury in mice through facilitating plasma membrane localization of ITGB3

Affiliations

PEX3 promotes regenerative repair after myocardial injury in mice through facilitating plasma membrane localization of ITGB3

Jia-Teng Sun et al. Commun Biol. .

Abstract

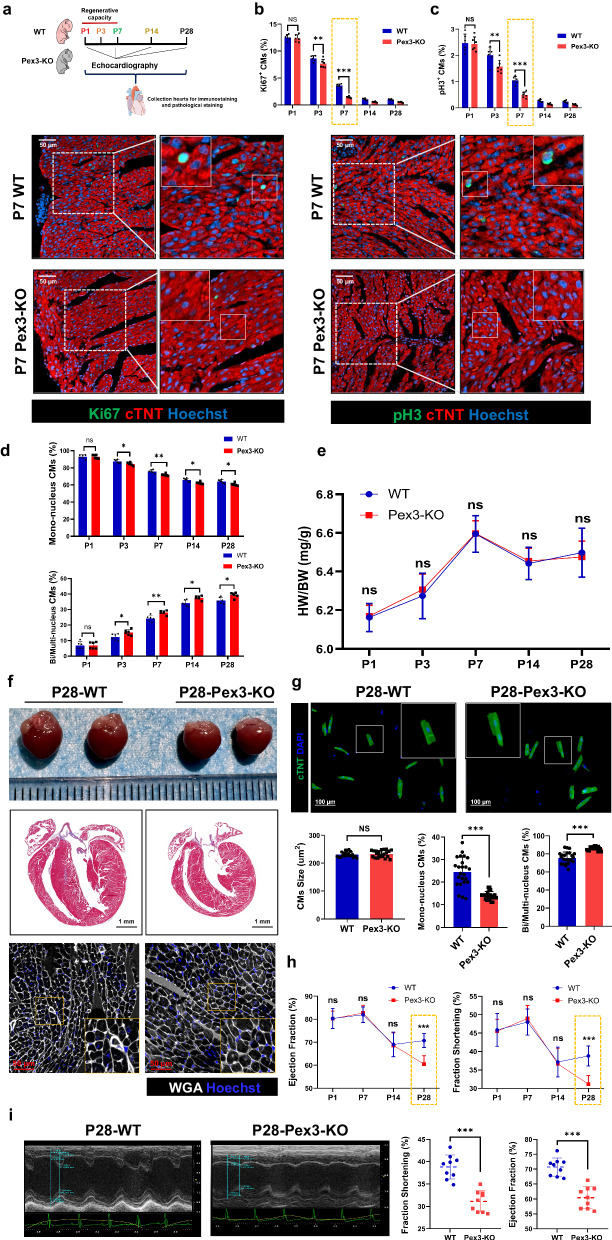
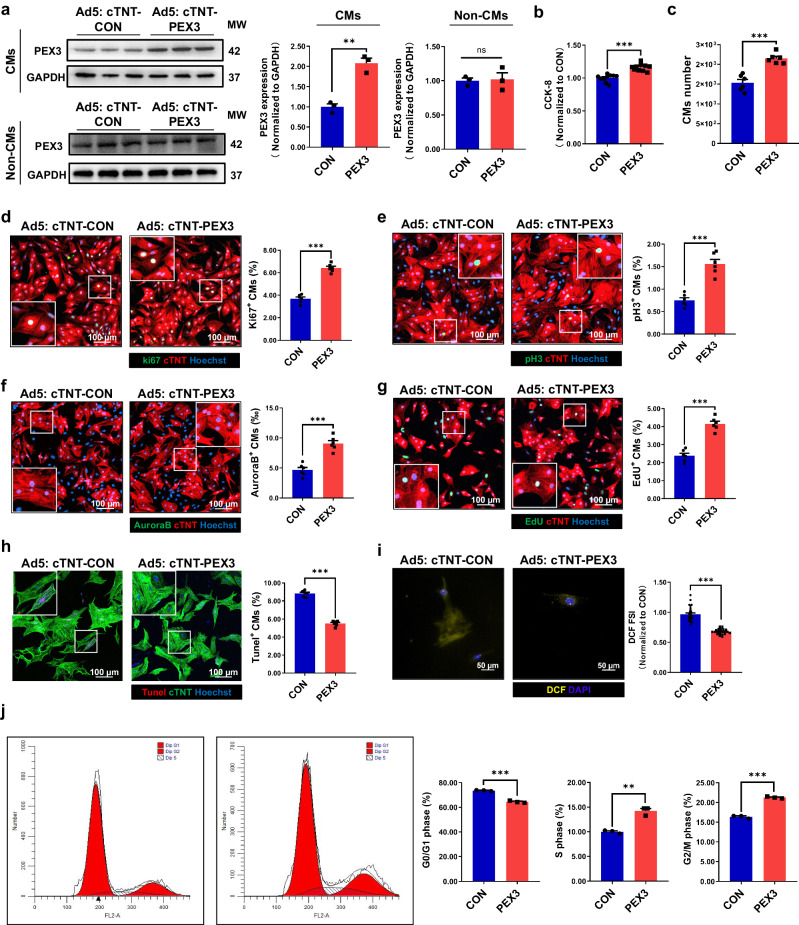
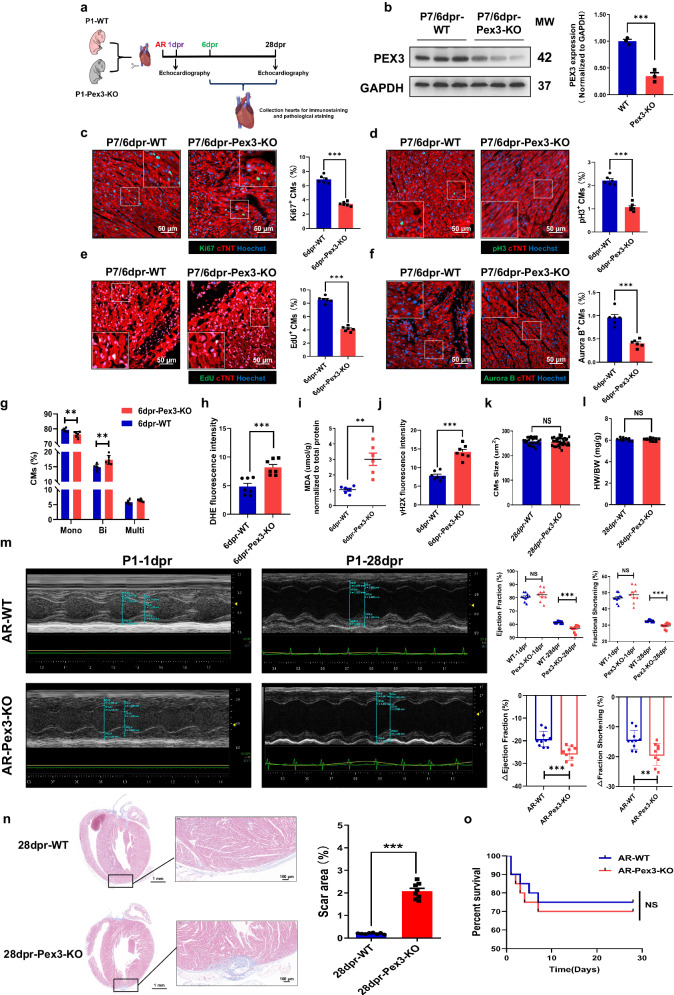
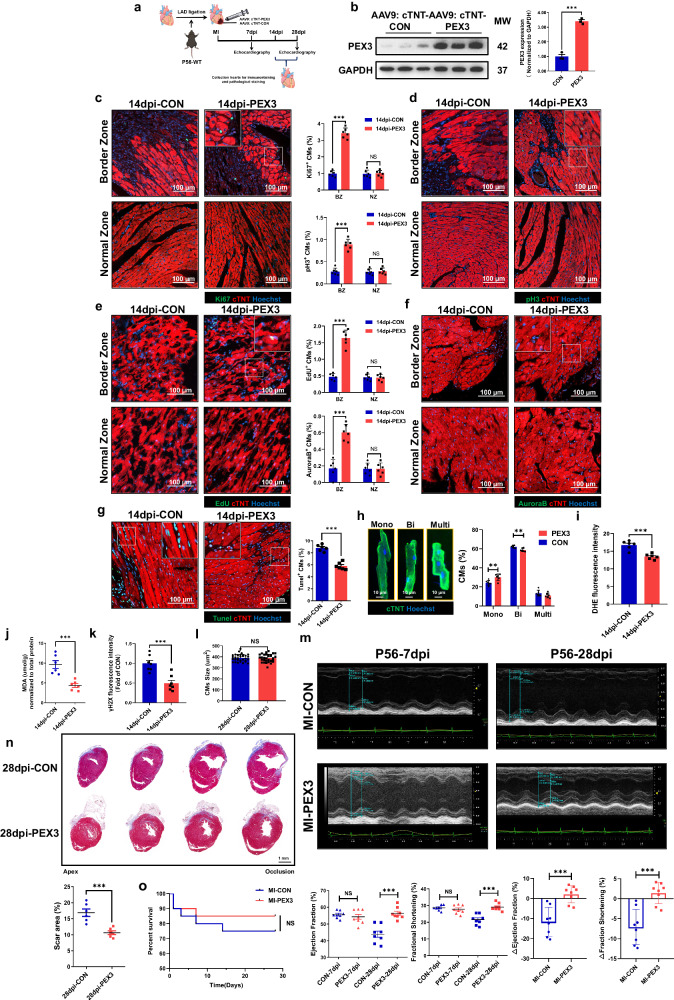
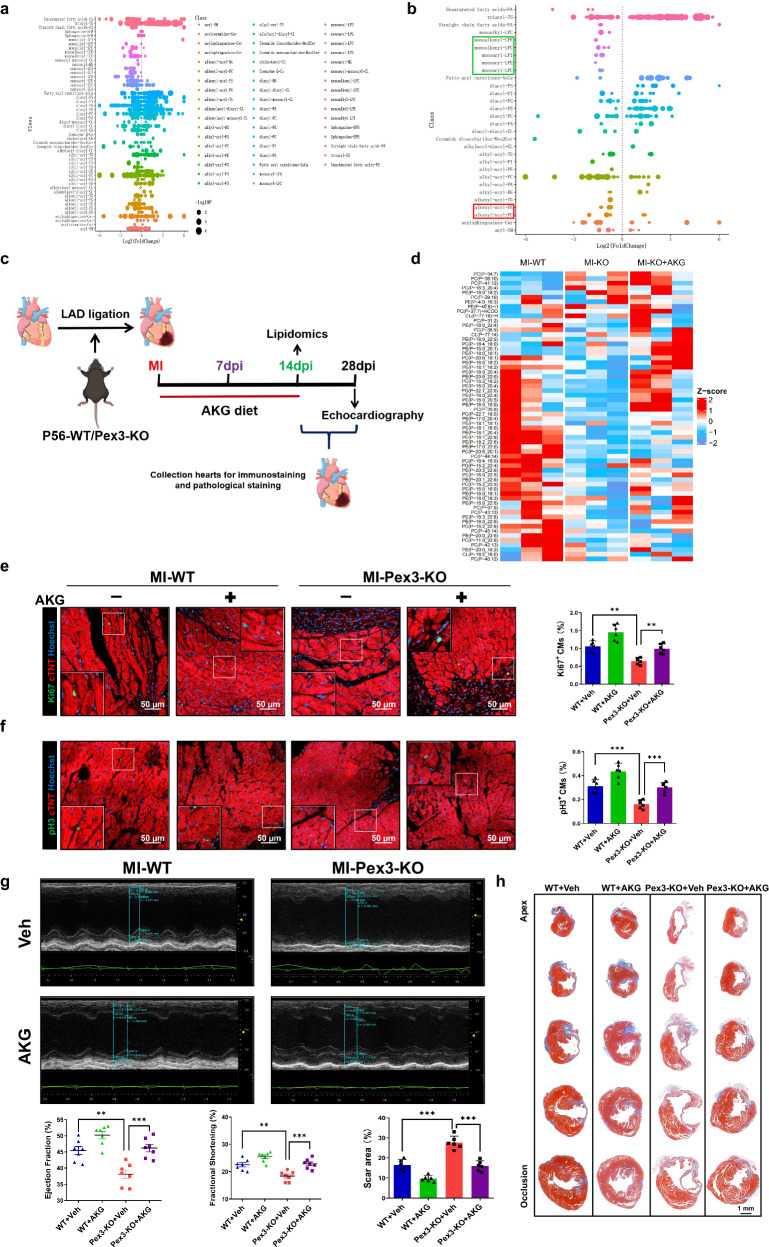
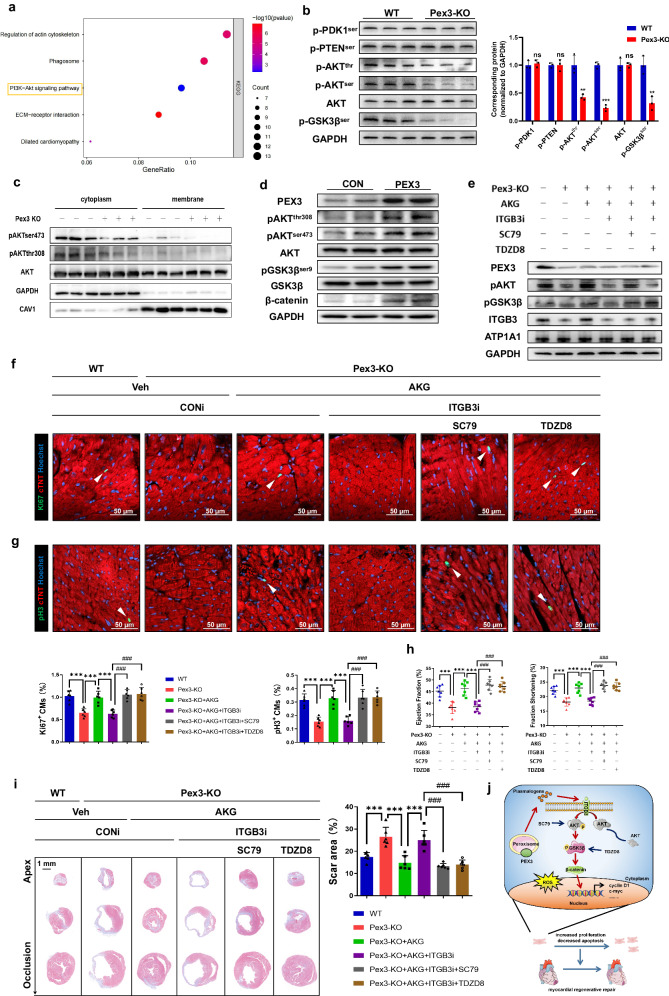
The peroxisome is a versatile organelle that performs diverse metabolic functions. PEX3, a critical regulator of the peroxisome, participates in various biological processes associated with the peroxisome. Whether PEX3 is involved in peroxisome-related redox homeostasis and myocardial regenerative repair remains elusive. We investigate that cardiomyocyte-specific PEX3 knockout (Pex3-KO) results in an imbalance of redox homeostasis and disrupts the endogenous proliferation/development at different times and spatial locations. Using Pex3-KO mice and myocardium-targeted intervention approaches, the effects of PEX3 on myocardial regenerative repair during both physiological and pathological stages are explored. Mechanistically, lipid metabolomics reveals that PEX3 promotes myocardial regenerative repair by affecting plasmalogen metabolism. Further, we find that PEX3-regulated plasmalogen activates the AKT/GSK3β signaling pathway via the plasma membrane localization of ITGB3. Our study indicates that PEX3 may represent a novel therapeutic target for myocardial regenerative repair following injury.


Conflict of interest statement

The authors declare no competing interests.

Figures

Fig. 1
Fig. 1. PEX3-mediated peroxisome function is associated with regenerative repair after myocardial injury.
a mRNA level of peroxins genes in the mice heart. Expression of 13 classic peroxins was examined at P7/6dps and P7/6dpr. The fold change was calculated by normalizing to 18S (n = 3). b Western blotting and quantification analysis of PEX3 and PEX12 in P7/6 dps and P7/6 dpr hearts (n = 3). c Western blotting and quantification analysis of PEX3 at P56/6dps and P56/6dpi hearts (n = 3). d Relative expression levels of PEX3 in mice hearts at different developmental stages by public RNA-seq data (E10.5, E12.5, E14.5, E16.5, E18.5, P1, P7, P14, P28, P56). e Representative images of PEX3 (red) in P7/6 dpr myocardium. cTNT = Green, Hoechst = Blue. White dotted line separated the infarct zone from the infarct border zone and normal zone. Scale bar = 100 µm. f Representative images of PEX3 (red) in P56/6 dpi myocardium. cTNT = Green, Hoechst = Blue. White dotted line separated the infarct zone from the border zone and normal zone. Scale bar = 100 µm. Unpaired t-test applied for (ac). Data shown as mean ± SEM. *P < 0.05, **P < 0.01, ***P < 0.001.
Fig. 2
Fig. 2. Endogenous proliferation and development block in the myocardial physiological state of cardiomyocyte-specific PEX3 knockout mice.
a Schematic illustration of the experimental design. b, c Immunofluorescence staining and quantification analysis of Ki67 and pH3 (green) in Pex3-KO mice from P1 to P28 were compared with WT mice (n = 6). cTNT = Red, Hoechst = Blue. Scale bar = 50 µm. (Ki67: 8293 CMs at P3 of WT mice group, 8802 CMs at P3 of Pex3-KO mice group; pH3: 14525 CMs at P3 of WT mice group, 14821 CMs at P3 of Pex3-KO mice group). d The proportions of mononucleated, bi-/multinucleated cardiomyocytes from P1 – P28 in WT and Pex3-KO mice (n = 6). e Heart weight/body weight ratio from P1 – P28 in WT and Pex3-KO mice (n = 6). f Representative heart images, Masson and wheat germ agglutinin (WGA, white) staining of myocardial slices from WT and Pex3-KO mice at P28. Hoechst=Blue. Scale bar = 1 mm, scale bar = 50 µm. g The proportions of mononucleated, bi-/multinucleated cardiomyocytes in WT and Pex3-KO mice were compared using isolated cardiomyocytes from P28 hearts and stained with cTNT (green) and DAPI (blue) (n = 6). Scale bar = 100 µm. h Echocardiography measurements of ejection fraction and fractional shortening in WT and Pex3-KO mice from P1 – P28 (n = 9). i Representative images of echocardiogram and comparison of ejection fraction and fractional shortening in WT and Pex3-KO mice at P28 (n = 9). Unpaired t-test applied for (f, g, and i). Two-way ANOVA and Tukey’s Multiple Comparison Test were performed for be, h. Data shown as mean ± SEM. N.S, Not Significant, *P < 0.05, **P < 0.01, ***P < 0.001.
Fig. 3
Fig. 3. PEX3 promotes cardiomyocytes proliferation in vitro.
a Western blotting and quantification analyses of PEX3 protein levels in primary cardiomyocytes and Non-CMs transfected with Ad5-cTNT-PEX3 and Ad5-cTNT-CON (n = 3). b CMs viability quantified between Ad5-cTNT-PEX3 groups and Ad5-cTNT-CON groups by CCK-8 assay (n = 10). c The total number of CMs between Ad5-cTNT-PEX3 groups and Ad5-cTNT-CON groups (n = 6). dg IF staining and quantification analysis of Ki67, pH3, Aurora B and EdU (green) after transfection with Ad5-cTNT-PEX3 or Ad5-cTNT-CON in CMs (n = 6). cTNT = Red, Hoechst=Blue. Scale bar = 100 µm. (Ki67: 2478 CMs in the Ad5-cTNT-CON group, 2534 CMs in the Ad5-cTNT-PEX3 group; pH3: 2639 CMs in the Ad5-cTNT-CON group, 2263 CMs in the Ad5-cTNT-PEX3 group; Aurora B: 2970 CMs in the Ad5-cTNT-CON group, 2897 CMs in the Ad5-cTNT-PEX3 group; EdU: 2738 CMs in the Ad5-cTNT-CON group, 2486 CMs in the Ad5-cTNT-PEX3 group). h IF staining of Tunel (red) in the PEX3 groups and CON groups post oxygen/glucose deprivation treatment (n = 6). cTNT = Green, Hoechst = Blue. Scale bar = 100 µm. (Tunel: 3637 CMs in the Ad5-cTNT-CON group, 3610 CMs in the Ad5-cTNT-PEX3 group). i IF staining and quantification analysis of DHE (yellow) in PEX3 groups compared with CON groups (n = 6). DAPI=Blue. Scale bar = 50 µm. j Flow cytometry analysis of primary CMs transfected with Ad5-cTNT-PEX3 or Ad5-cTNT-CON (n = 3). Unpaired t-test applied for (aj). Data shown as mean ± SEM. N.S, Not Significant, **P < 0.01, ***P < 0.001.
Fig. 4
Fig. 4. Deletion of PEX3 inhibits neonatal myocardial regeneration after apical resection.
a Schematic illustration of the experimental design. b Western blotting and quantitative analysis of PEX3 protein levels in neonatal mice at 6 dpr (n = 3). cf Effect of PEX3 on cell cycle markers (Ki67, pH3, EdU and Aurora B) (green) in neonatal mice at 6 dpr in the WT and Pex3-KO mice (n = 6). cTNT = Red, Hoechst = Blue. Scale bar = 50 µm. (Ki67: 5735 CMs in the WT group, 8093 CMs in the Pex3-KO group; pH3: 10659 CMs in the WT group, 12818 CMs in the Pex3-KO group; Aurora B: 6973 CMs in the WT group, 6468 CMs in the Pex3-KO group; EdU: 5116 CMs in the WT group, 7891 CMs in the Pex3-KO group). g The proportions of mononucleated, binucleated and multinucleated cardiomyocytes between Pex3-KO groups and WT groups at 6 dpr (n= 6). h Quantification analysis of DHE in Pex3-KO groups compared with WT groups at 6 dpr (n = 7). i The level of MDA between Pex3-KO groups and WT groups at 6dpr (n = 6). j Quantification analysis of γH2X between Pex3-KO groups and WT groups at 6 dpr (n = 7). k Quantification analysis of WGA staining in Pex3-KO groups compared with WT groups at 28dpr (n = 6). l Heart weight/body weight ratio between Pex3-KO groups and WT groups at 28dpr (n = 10). m Echocardiography measurements of ejection fraction and fractional shortening between Pex3-KO groups and WT groups at 1dpr and 28dpr (n = 9-10). n Masson staining and quantification of scar tissue in the resected apex of heart between Pex3-KO groups and WT groups (n = 8). Scale bar = 100 µm, scale bar = 1 mm. o Survival rate of mice in Pex3-KO groups and WT groups from 1dpr to 28 dpr (n = 20). Unpaired t-test applied for (bn). Kaplan–Meier (log-rank test) was performed for o. Data shown as mean ± SEM. N.S, Not Significant, **P < 0.01, ***P < 0.001.
Fig. 5
Fig. 5. PEX3 promotes CMs proliferation and improves cardiac function in adult mice following MI.
a Schematic illustration of the experimental design. b Western blotting and quantitative analysis of PEX3 protein levels in adult mice at 14 dpi after MI and AAV9-cTNT-PEX3 or AAV9-cTNT-CON injection (n = 3). cf Effect of PEX3 on cell cycle markers (Ki67, pH3, EdU and Aurora B) (green) in adult mice after MI and AAV9-cTNT-PEX3 or AAV9-cTNT-CON injection at 14 dpi (n = 6). cTNT = Red, Hoechst  = Blue. Scale bar = 100 µm. (Border Zone: Ki67: 4796 CMs in the AAV9-cTNT-CON group, 3678 CMs in the AAV9-cTNT-PEX3 group; pH3: 4275 CMs in the AAV9-cTNT-CON group, 4977 CMs in the AAV9-cTNT-PEX3 group; Aurora B: 2511 CMs in the AAV9-cTNT-CON group, 2827 CMs in the AAV9-cTNT-PEX3 group; EdU: 3220 CMs in the AAV9-cTNT-CON group, 3855 CMs in the AAV9-cTNT-PEX3 group). g IF staining and quantification of Tunel signals (green) in the PEX3 groups and CON groups at 14 dpi after MI (n = 6). cTNT = Red, Hoechst = Blue. Scale bar = 100 µm. (Tunel: 4940 CMs in the AAV9-cTNT-CON group, 4024 CMs in the AAV9-cTNT-PEX3 group). h Isolation and quantification of the mononucleated, binucleated and multinucleated cardiomyocytes number between PEX3 groups and CON groups at 14 dpi (n = 6). cTNT = Green, Hoechst = Blue. Scale bar = 10 µm. i Quantification analysis of DHE in PEX3 groups compared with CON groups at 14dpi (n = 6). j The level of MDA between PEX3 groups and CON groups at 14dpi (n = 6). k Quantification analysis of γH2X in PEX3 groups and CON groups at 14 dpi (n = 7). l Quantification analysis of WGA in PEX3 groups and CON groups at 28 dpi (n = 6). m Echocardiography measurements of ejection fraction and fractional shortening between PEX3 groups and CON groups at 7dpi and 28dpi (n = 8). n Masson staining and quantification of scar tissue in PEX3 groups and CON groups at 28 dpi (n = 6). Scale bar = 1 mm. o Survival rate of mice in PEX3 groups and CON groups from 1dpi to 28 dpi (n = 20). Unpaired t-test applied for (bn). Kaplan–Meier (log-rank test) was performed for (o). Data shown as mean ± SEM. N.S, Not Significant, **P < 0.01, ***P < 0.001.
Fig. 6
Fig. 6. Supplement of plasmalogen ameliorates impaired myocardial regenerative repair in Pex3-KO mice.
a Scatter diagram of the lipid metabolites in WT and Pex3-KO myocardium after MI by lipidomics analysis. b Scatter diagram of the differential lipid metabolites (filtered with P < 0.05) by lipidomics analysis (plasmalogen metabolites-green box, plasmalogen-red box). c Schematic illustration of the experimental design. d Clustered heatmap of the differentially expressed plasmalogens in WT+MI, Pex3-KO+MI and Pex3-KO+MI+AKG by lipidomics analysis (14dpi). e, f Representative images and quantification analysis of Ki67 and pH3 (green) in WT and Pex3-KO mice after MI and treated with AKG for 2 weeks (n = 6). cTNT = Red, Hoechst = Blue. Scale bar = 50 µm. (Ki67: 3538 CMs in the WT+Veh group, 3585 CMs in the WT+AKG group, 3500 CMs in the Pex3-KO+Veh group, 4124 CMs in the Pex3-KO+AKG group; pH3: 4260 CMs in the WT+Veh group, 4722 CMs in the WT+AKG group, 4645 CMs in the Pex3-KO+Veh group, 5428 CMs in the Pex3-KO+AKG group). g Echocardiography measurements of ejection fraction and fractional shortening in WT and Pex3-KO mice after MI and treated with AKG for 2 weeks at 28 dpi (n = 7). h Masson staining and quantification of scar tissue in the injured heart of WT and Pex3-KO mice after MI and treated with AKG for 2 weeks at 28dpi (n = 6). Scale bar=1mm. Two-way ANOVA and Tukey’s Multiple Comparison Test were performed for (eh). Data shown as mean ± SEM. **P < 0.01, ***P < 0.001.
Fig. 7
Fig. 7. PEX3 interferes with ITGB3 membrane localization through plasmalogen metabolism.
a Schematic illustration of the experimental design. b Gene ontology analysis of differentially down-expressed genes (Supplemental Fig. 10b) in WT and Pex3-KO adult mice heart. FC > 1.2, P < 0.05. c Using the Hubba plugin for Protein-Protein Interaction Networks to analyze the network topology of critical proteins in differentially expressed plasma membrane proteins. d Representative images of ITGB3 (red) expression in WT and Pex3-KO mice. WGA = White, Hoechst = Blue. Scale bar = 50 µm. e Western blotting and quantification analysis of ITGB3 in WT and Pex3-KO mice after MI treated with AKG for 2 weeks at 14 dpi (n = 3). f. Representative TEM images of the plasma membrane structure between Pex3-KO mice after MI and Pex3-KO mice after MI treated with AKG for 2 weeks at 14 dpi. Scale bar = 500 nm. g Schematic illustration of the experimental design. h Western blotting and quantification analysis of ITGB3 in Pex3-KO mice after MI and treated with AAV9-cTNT-ITGB3i (CONi) and AKG for 2 weeks at 14 dpi (n = 3). i, j Representative images and quantification analysis of Ki67 and pH3 (green) in Pex3-KO mice after MI and treated with AAV9-cTNT-ITGB3i (CONi) and AKG for 2 weeks at 14 dpi (n = 6). cTNT = Red, Hoechst = Blue. Scale bar = 100 µm. (Ki67: 3840 CMs in the Pex3-KO+CONi+Veh group, 3418 CMs in the Pex3-KO+ITGB3i+Veh group, 3795 CMs in the Pex3-KO+AKG+CONi group, 3491 CMs in the Pex3-KO+AKG+ITGB3i group; pH3: 3707 CMs in the Pex3-KO+CONi+Veh group, 4379 CMs in the Pex3-KO+ITGB3i+Veh group, 4894 CMs in the Pex3-KO+AKG+CONi group, 4035 CMs in the Pex3-KO+AKG+ITGB3i group). k Echocardiography measurements of ejection fraction and fractional shortening in Pex3-KO mice after MI and treated with AAV9-cTNT-ITGB3i (CONi) and AKG for 2 weeks at 28 dpi (n = 7). l Masson staining and quantification analysis of scar tissue in the injured heart of Pex3-KO mice after MI and treated with AAV9-cTNT-ITGB3i (CONi) and AKG for 2 weeks at 28 dpi (n = 6). Scale bar = 1 mm. Two-way ANOVA and Tukey’s Multiple Comparison Test were performed for (e, hl). Data shown as mean ± SEM. *P < 0.05, **P < 0.01, ***P < 0.001.
Fig. 8
Fig. 8. PEX3 regulates ITGB3-mediated AKT/GSK3β pathway to promote myocardial regenerative repair.
a Kyoto Encyclopedia of Genes and Genomes analysis of differential expression genes (Supplemental Fig. 4a) in WT and Pex3-KO mice myocardium. P-value < 0.05. b Western blotting and quantification analysis of p-PDK1ser241, p-PTENser380, p-AKTthr308/ser473, AKT and p-GSK3βser9 in WT and Pex3-KO mice (n = 3). c Western blotting of AKT and p-AKTthr308/ser473 in the cytoplasm and membrane of WT and Pex3-KO mice at 14dpi (n = 3). d Western blotting of PEX3, p-AKTthr308/ser473, AKT, GSK3, p-GSK3βser9 and β-catenin in primary cardiomyocytes transfected with Ad5-cTNT-PEX3/CON (n = 4). e Western blotting of PEX3, p-AKT, p-GSK3β and ITGB3 in Pex3-KO mice after MI and treated with AAV9-cTNT-ITGB3i (CONi), AKG, SC79 or TDZD8 at 14dpi (n = 3). f, g Representative images and quantification analysis of Ki67 and pH3 (green) in Pex3-KO mice after MI treated with AAV9-cTNT-ITGB3i (CONi), AKG, SC79 or TDZD8 at 14 dpi (n = 6). cTNT = Red, Hoechst = Blue. Scale bar = 50 µm. (Ki67: 3669 CMs in the WT group, 3535 CMs in the Pex3-KO group, 3731 CMs in the Pex3-KO+AKG group, 3401 CMs in the Pex3-KO+AKG+ITGB3i group, 3416 CMs in the Pex3-KO+AKG+ITGB3i+SC79 group, 3721 CMs in the Pex3-KO+AKG+ITGB3i+TDZD8 group; pH3: 4821 CMs in the WT group, 4570 CMs in the Pex3-KO group, 4862 CMs in the Pex3-KO+AKG group, 4362 CMs in the Pex3-KO+AKG+ITGB3i group, 4953 CMs in the Pex3-KO+AKG+ITGB3i+SC79 group, 4879 CMs in the Pex3-KO+AKG+ITGB3i+TDZD8 group). h Echocardiography measurements of ejection fraction and fractional shortening in Pex3-KO mice after MI and treated with AAV9-cTNT-ITGB3i (CONi), AKG, SC79 or TDZD8 at 28 dpi (n = 7). i Masson staining and quantification of scar tissue in the injured heart of Pex3-KO mice after MI and treated with AAV9-cTNT-ITGB3i (CONi), AKG, SC79 or TDZD8 at 28 dpi (n = 6). Scale bar = 1 mm. j Schematic representation of how PEX3 promotes myocardial regenerative repair through plasmalogen metabolism to facilitate plasma membrane localization of ITGB3, activating the AKT/GSK3β signaling pathway. Unpaired t-test applied for (b). One-way ANOVA and Tukey’s Multiple Comparison Test were performed for (fi). Data shown as mean ± SEM. N.S, Not Significant, **P < 0.01, ***P < 0.001. Pex3-KO + AKG + ITGB3i vs. Pex3-KO + AKG + ITGB3i + SC79/TDZD8, ###P < 0.001.

References

    1. Collaborators GBDS. Global, regional, and national burden of stroke and its risk factors, 1990-2019: a systematic analysis for the global burden of disease study 2019. Lancet Neurol. 2021;20:795–820. doi: 10.1016/S1474-4422(21)00252-0. - DOI - PMC - PubMed
    1. He L, Nguyen NB, Ardehali R, Zhou B. Heart regeneration by endogenous stem cells and cardiomyocyte proliferation: controversy, fallacy, and progress. Circulation. 2020;142:275–291. doi: 10.1161/CIRCULATIONAHA.119.045566. - DOI - PMC - PubMed
    1. Porrello ER, et al. Transient regenerative potential of the neonatal mouse heart. Science. 2011;331:1078–1080. doi: 10.1126/science.1200708. - DOI - PMC - PubMed
    1. Li X, et al. Inhibition of fatty acid oxidation enables heart regeneration in adult mice. Nature. 2023;622:619–626. - PMC - PubMed
    1. Puente BN, et al. The oxygen-rich postnatal environment induces cardiomyocyte cell-cycle arrest through DNA damage response. Cell. 2014;157:565–579. doi: 10.1016/j.cell.2014.03.032. - DOI - PMC - PubMed

Publication types

MeSH terms