. 2024 Aug;56(8):1725-1736.
doi: 10.1038/s41588-024-01819-2. Epub 2024 Jul 1.

Mapping spatially resolved transcriptomes in human and mouse pulmonary fibrosis

Affiliations

Mapping spatially resolved transcriptomes in human and mouse pulmonary fibrosis

Lovisa Franzén et al. Nat Genet. 2024 Aug.

Abstract

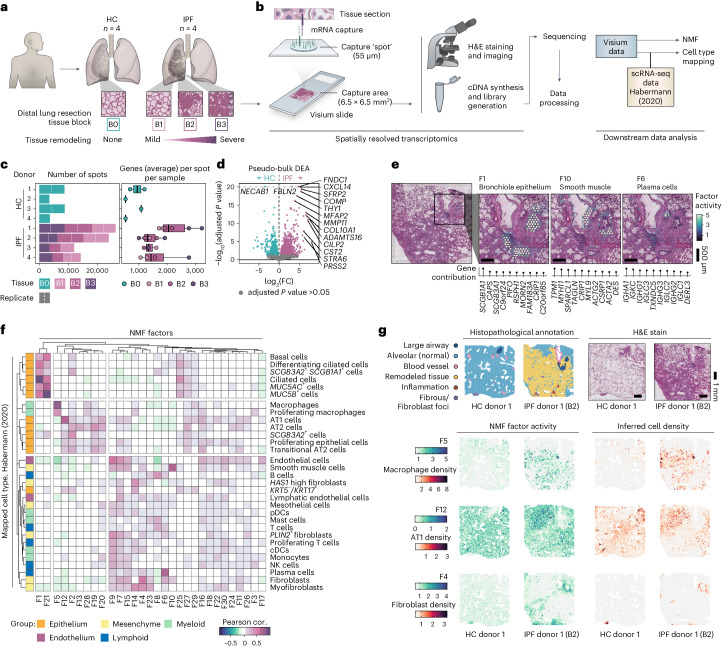
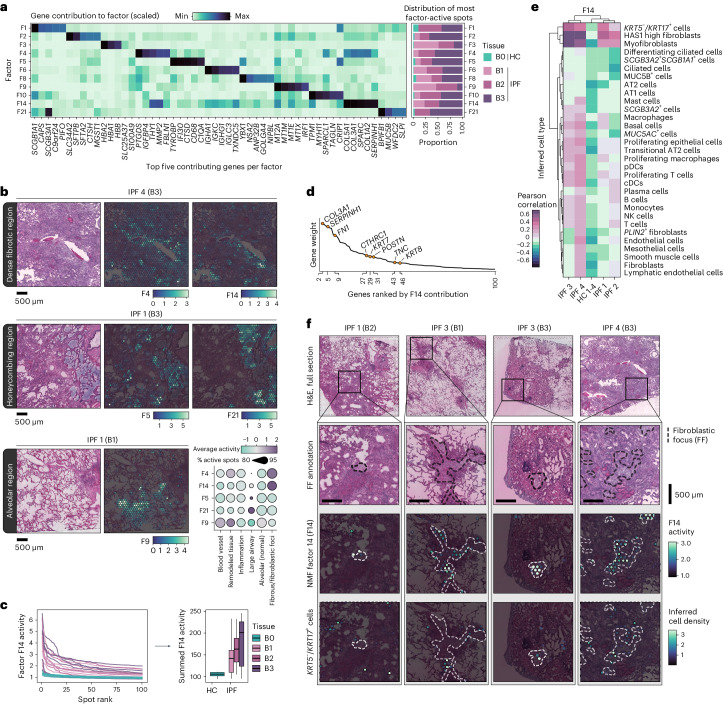
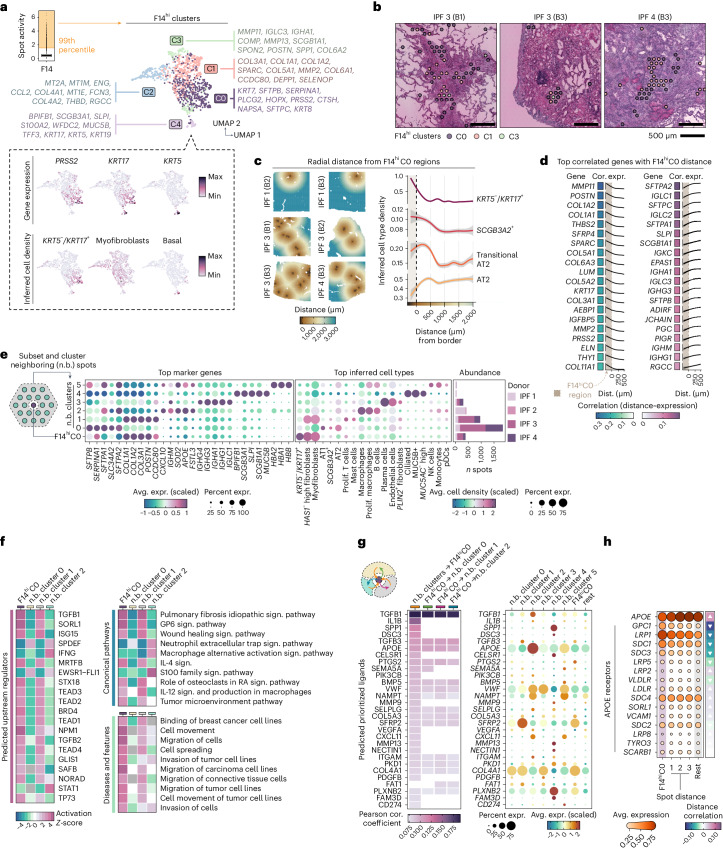
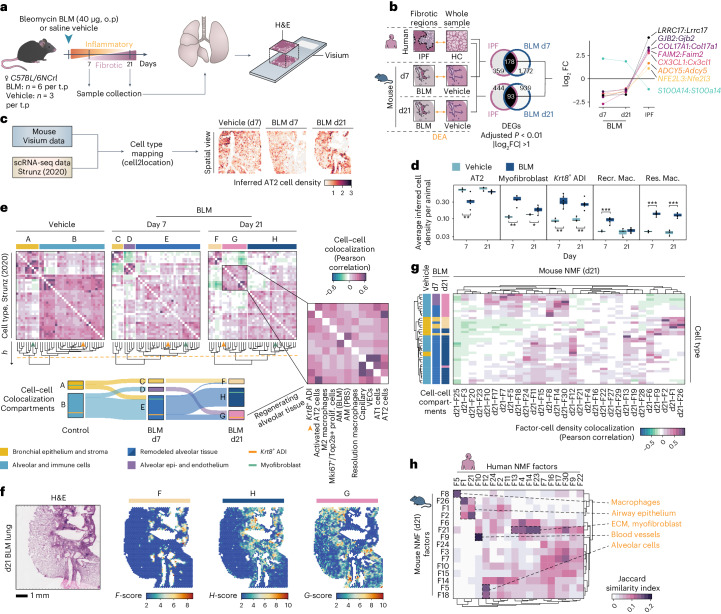
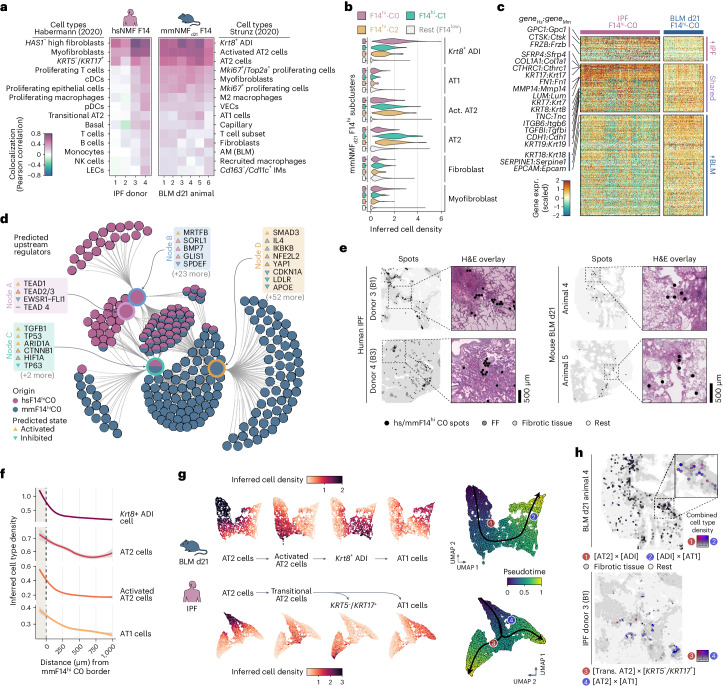
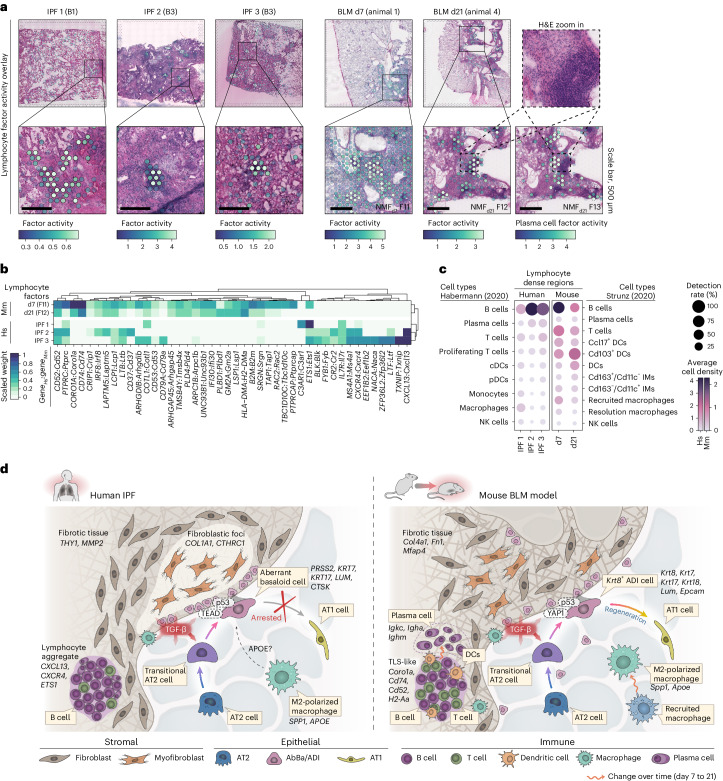
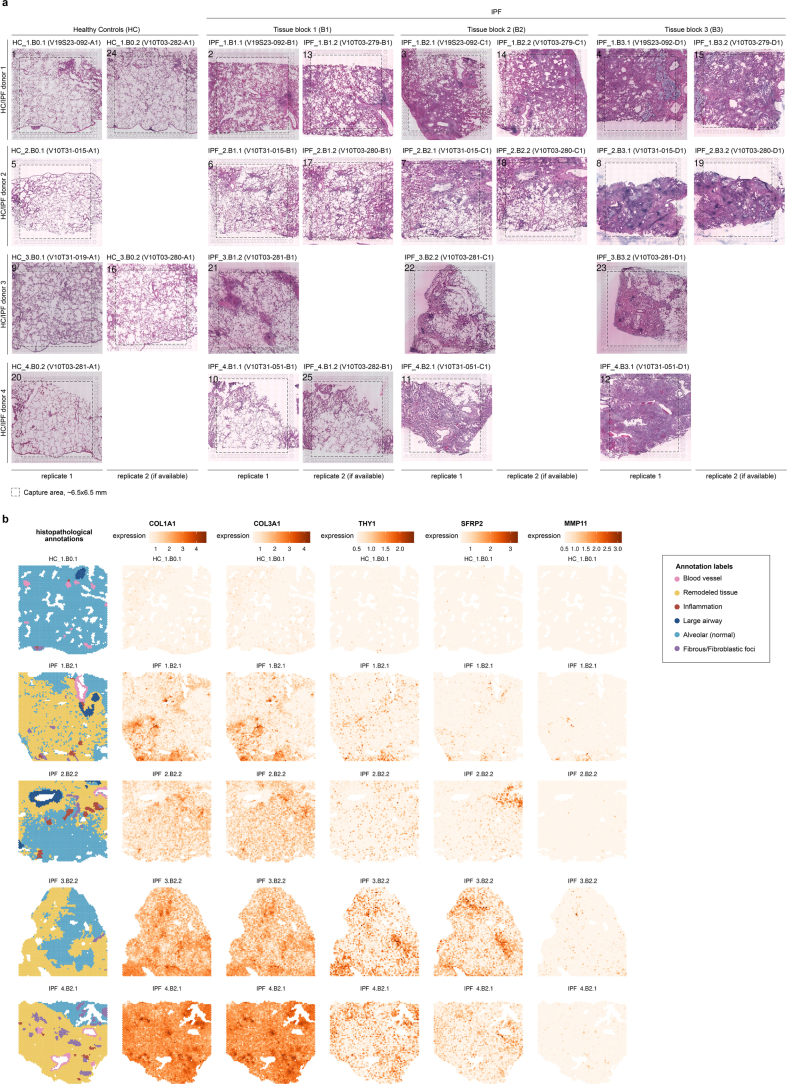
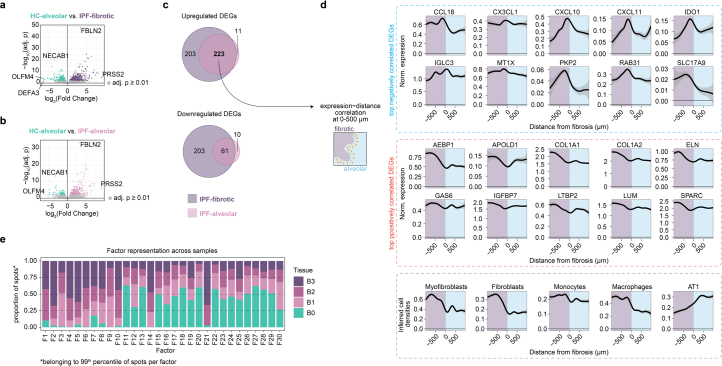
Idiopathic pulmonary fibrosis (IPF) is a progressive lung disease with poor prognosis and limited treatment options. Efforts to identify effective treatments are thwarted by limited understanding of IPF pathogenesis and poor translatability of available preclinical models. Here we generated spatially resolved transcriptome maps of human IPF (n = 4) and bleomycin-induced mouse pulmonary fibrosis (n = 6) to address these limitations. We uncovered distinct fibrotic niches in the IPF lung, characterized by aberrant alveolar epithelial cells in a microenvironment dominated by transforming growth factor beta signaling alongside predicted regulators, such as TP53 and APOE. We also identified a clear divergence between the arrested alveolar regeneration in the IPF fibrotic niches and the active tissue repair in the acutely fibrotic mouse lung. Our study offers in-depth insights into the IPF transcriptional landscape and proposes alveolar regeneration as a promising therapeutic strategy for IPF.


Conflict of interest statement

The authors declare the following competing interests: P.L.S. and J. Lundeberg are scientific consultants to 10x Genomics. The remaining authors (L.F., M.O.L., M.H., V.P., L.S., B.P.K., A.C., S.O., T.V., A.B., J. Lindgren, G.B., S.J., A.O., M.S. and J.H.) are employees and/or stockholders of AstraZeneca.

Figures

Fig. 1
Fig. 1. Spatial transcriptomic profiling of human pulmonary fibrosis.
a, Tissue sections from distal lung resection samples from HCs (B0; n = 4) and patients with IPF (n = 4), were sectioned and analyzed using the Visium Spatial Gene Expression technology. Three tissue blocks exhibiting progressive tissue remodeling (B1–3) were selected from each IPF donor. b, Schematic illustration of the Visium workflow and subsequent data processing steps. NMF was used for dimensionality reduction, generating 30 distinct factors. Cell-type distributions were inferred through integration with a scRNA-seq dataset published by Habermann et al. (2020; GSE135893). c, Summarizing descriptions of the data, including the number of Visium capture spots per sample and the average number of unique genes detected per spot and sample. The box plot center line is the median, the box limits are the upper and lower quartiles, the whiskers are 1.5× interquartile range and the points are the value per Visium sample. d, Pseudobulk DEA comparing pooled HC and IPF Visium data per donor to identify significant DEGs between conditions based on data from entire tissue sections. e, Spatial distribution maps for selected NMF factors that correspond histological and/or transcriptional profiles of bronchiole epithelium (F1), smooth muscle (F10) and plasma cells (F6). f, Pearson correlation (cor.) heat map of NMF factor activity and inferred cell-type densities, using the Habermann et al. scRNA-seq dataset, across all spots in all samples. g, Example of histopathological annotations performed on sections from each HC and IPF tissue block based on the H&E-stained Visium sections. Visualizing spatial NMF activity and inferred cell-type densities showcases the colocalization of highly correlated factor-cell pairs. NMF, non-negative matrix factorization; pDC/cDCs, plasmacytoid/classical dendritic cells; NK cells, natural killer cells. Source data
Fig. 2
Fig. 2. Disease-associated signatures revealed by NMF.
a, NMF identified signatures over-represented in IPF tissue. Their relative contribution to each factor (scaled) is displayed for the top five contributing genes per factor, and the proportion of spots with the highest activity (99th percentile) by condition and tissue severity grade. b, Spatial representation of selected NMF factors across IPF lung sections, demonstrating distinct localization patterns that was observed across all IPF samples. F4 and F14 marked heavily fibrotic regions, F5 and F21 associated with honeycombing structures and F9 were seen in alveolar regions. The dot plot displays the average activity (scaled and centered) and detection rate (percentage of spots with increased activity) within the annotated histological regions across all tissue blocks. c, Activity profile of the top 100 ranked spots per sample based on F14 activity (line chart), highlighting a consistent distinction between HC and IPF tissue samples, further summarized by summing the F14 activity levels and grouped based on tissue remodeling extent (B0, n = 6; B1, n = 7; B2, n = 6; B3, n = 6) (box plot). The center line is the median, the box limits are the upper and lower quartiles and the whiskers are 1.5× interquartile range. d, Ranking of the top 100 genes for F14 based on gene weight (contribution) to the factor, with keratins, collagens and other fibrosis-related genes emphasized. e, Correlation heat map between F14 activity and densities of inferred cell types within spatial spots, capturing potential colocalization of F14 and cell types (strong correlation suggests spatial co-occurrence). f, Visualization of FF annotations, F14 activity and the distribution of inferred KRT5/KRT17+ cells in selected samples and regions in all IPF donor lungs. Source data
Fig. 3
Fig. 3. Cellular and molecular deconvolution of the AbBa niche.
a, Clustering of the 99th percentile of F14 active spots (F14hi; yellow shaded area) into five clusters (F14hiC0–4), visualized in the UMAP space with the top gene markers listed and expression of AbBa cell markers PRSS2 and KRT17 and basal cell marker KRT5. The box plot center line is the median, the box limits are the upper and lower quartiles and the whiskers are 1.5× interquartile range. b, Spatial location of F14hi clusters within FF in representative IPF tissue sections. c, Inferred cell-type densities around F14hiC0 boundaries (dashed line), with radial distance. The distance below zero indicatesF14hiC0 positive spots (shaded area). d, Pearson correlation (cor.) and gene expression (expr.) of top 20 genes (positive and negative) across a 0–500 µm distance (dist.) radius from the F14hiC0 border. e, Clustering of neighboring F14hiC0 spots (~200 µm) into six clusters (n.b. cluster 0–5) with average expression (avg. expr.) of top marker genes and selected average inferred cell-type densities highlighted in the dot plot. The bar chart displays distribution per donor. f, Enrichment analysis (IPA) of n.b. clusters 0–2 using marker genes (adjusted P < 0.05). The heat maps display activation Z-scores of top predicted upstream regulators enriched pathways and diseases and functions. g, NicheNet analysis of cell–cell communication showing prioritized ligands acting upon F14hiC0 and n.b. clusters 0–2 regions (left) with their average expression (avg. expr.) levels (right). h, Average expression of APOE and its receptors across F14hiC0 and over radial distance (three spots, ~300 µm) and background expression in remaining spots (‘rest’). The directional arrows show correlation (Pearson) trends across spot distance. Prolif. T cells, proliferating T cells; Sign. pathway, signaling pathway. Source data
Fig. 4
Fig. 4. Comparative spatial analysis of pulmonary fibrosis in mouse and human.
a, Study design for the mouse BLM lung injury model, analyzing lungs collected at days 7 (d7) and 21 (d21) post oropharyngeal (o.p.) administration (n = 6 for BLM, n = 3 for vehicle per time point (t.p.)), used for Visium experiments. b, DEA of fibrotic regions in human IPF and BLM-treated mice versus controls, with Venn diagrams of DEGs unique and common to human IPF and mouse BLM at d7 or d21 and highlighting genes with inverse expression patterns. c, Integration of Visium and scRNA-seq data (Strunz et al.; GSE141259) to infer spot cell-type densities, exemplified by inferred AT2 density. d, Averaged cell-type abundance per animal, comparing time points and treatments for selected cell types (Welch two sample t-test, two-sided; nVehicle = 3 and nBLM = 6, per time point). *P < 0.05, **P < 0.01 and ***P < 0.001 (AT2, d7: P = 0.0036; myofibroblast, d7: P = 0.0011, d21: P = 0.0306; Krt8+ ADI, d7: P = 0.0042, d21: P = 0.0045; Recr. Mac., d7: P = 0.0006; Res. Mac: d7: P < 0.0001, d21: P < 0.0001). The center line is the median, the box limits are the upper and lower quartiles, the whiskers are 1.5× interquartile range and the points are the value per animal. e, Cell–cell correlation heat maps display cellular colocalization compartments (defined by tree height cutoff, h = 1.5, orange dashed line) across condition and time point. The Sankey diagram illustrates cell type shifts within compartments from vehicle to BLM d7 to BLM d21, with Krt8+ ADI (orange line) and myofibroblast (green line) populations highlighted. f, Computed compartment scores (F–H) based on cell-type densities for a BLM d21 lung section. g, Correlation (Pearson) of BLM d21 NMF factor activity and cell-type densities in all spots. The cell-type group colors match their respective compartments (A–H) from prior analysis. h, Comparison between human and mouse d21 NMF analyses using the top 100 factor-driving genes, filtered for factor pairs with a Jaccard index >0.1 to highlight major overlaps. AM, alveolar macrophages; Recr. Mac., recruited macrophages; Res. Mac., resolution macrophages; VECs, vascular endothelial cells; Prolif., proliferating. Source data
Fig. 5
Fig. 5. Translational dissection of the fibrotic niche and cellular dynamics.
a, Correlation of hsNMF-F14hi and mmNMF-F14hi factor activity with the top 15 correlating cell types from Habermann (human) and Strunz (mouse) scRNA-seq datasets. b, Cell density distribution in mmNMFd21-F14hi subclusters showing high abundance of Krt8+ ADI cells in mmNMFd21-F14hi C0 and AT2 cells in C1 and C2. c, Heat map with scaled and centered hsNMF-F14hiC0 and mmNMFd21-F14hiC0 marker gene expression (expr.), grouped by higher in IPF, shared or higher in BLM (adjusted P < 0.01, avgerage log2FC >0). d, Comparative network plot of top significant regulators (P < 10−7, right-tailed Fisher’s exact test) from IPA upstream analyses of marker genes (adjusted P < 0.05) in hsNMF-F14hiC0 and mmNMFd21-F14hiC0. The inner nodes illustrate groups of regulators sharing genetic influences and the outer nodes represent contributing marker genes. e, Spatial mapping of hsNMF-F14hiC0 and mmNMFd21-F14hiC0 spots within tissue sections illustrating the relationship with fibrotic regions. f, Radial distribution line graphs of cell densities around mmNMFd21-F14hiC0. The gray shading corresponds to the 95% confidence interval. g, Spatial trajectories of spots with high inferred densities of AT2, activated AT2, Krt8+ ADI and AT1 cells (mouse) or AT2, transitional AT2, KT5-/KRT17+ and AT1 cells (human). h, Spatial colocalization of AT2-to-Krt8+ ADI (1, red) and ADI-to-AT1 (2, blue) inferred cell densities in a mouse lung section and transitional AT2-to-KRT5/KRT17+ (3, red) and AT2-to-AT1 (4, blue) densities in one human IPF lung section. Colocalization intensities are visualized on a red–blue spectrum, with mixtures appearing purple and spot opacity reflecting intensity level. Tissue background and areas of fibrosis (gray) are illustrated for context. VECs, vascular endothelial cells; pDC/cDCs, plasmacytoid/classical dendritic cells; NK cells, natural killer cells; AM, alveolar macrophages; IM, interstitial macrophages; Act. AT2, activated AT2 cells; Trans. AT2, transitional AT2 cells. Source data
Fig. 6
Fig. 6. Immune cell signatures and comparative overview of the fibrotic niche in IPF and the BLM mouse model.
a, Spatial visualization of NMF factors overlapping dense lymphocyte or immune cell aggregates in selected human and mouse samples. Scale bars, 500 µm. Imaged at 20× magnification. b, Heat map displays the top contributing factor genes across condition, filtered to show genes with a summed scaled weight above 0.5 across the groups. c, Dot plot with inferred cell-type densities, for selected immune cell types from the ‘Habermann’ and ‘Strunz’ datasets, in the most active spots of the selected human and mouse factors. d, Schematic summary of the fibrotic niche in human IPF lungs and in mouse BLM-injured lungs, illustrating the proposed cellular interplay within the fibrotic lungs. A key distinction between IPF and the BLM mouse model was centered around the diverging regenerative properties of the IPF-associated AbBa cells versus the mouse Krt8+ ADI cells. While both populations exhibit signs of senescence (p53), the mouse ADI state appears to maintain a functional balance that still prompts it to differentiate into AT1 cells. TGF-β and Wnt-related (TEAD, YAP1) signaling pathways were central within the fibrotic niche, and the presence of immune cells in proximity to, or within, the severely remodeled tissue implies active fibrogenic modulatory roles. Pro-fibrotic M2-polarized (‘resolution’) macrophages with similar gene signatures, expressing SPP1 (Spp1) and APOE (Apoe) were detected in both human IPF and mouse BLM-injured lungs. In contrast to human IPF AbBa regions, a predicted negative APOE upstream signaling was identified in mouse ADI regions. In mouse, the recruited proinflammatory macrophages seen at the early time point post BLM-installation were absent by d21. Establishment of plasma cells adjacent to TLS-like areas in the BLM-injured mice occurred at the later time point. pDC/cDCs, plasmacytoid/classical dendritic cells; IMs, interstitial macrophages; NK cells, natural killer cells; TLS, tertiary lymphoid structure. Source data
Extended Data Fig. 1
Extended Data Fig. 1. Histological and spatial gene expression analysis of human lung tissues.
a) Hematoxylin and eosin (H&E) stained sections of lung tissue samples from four healthy controls (HC 1-4; ‘B0’) and four IPF patients (IPF 1-4), used for Visium experiments. Each IPF patient sample includes three samples (‘B1’, ‘B2’, ‘B3’) representing a gradient in the extent of fibrotic injury, from mild to severe tissue remodeling. Visium data from a total of 25 tissue sections were analyzed, including replicate sections for some tissues to control for technical variability. b) Histopathological annotations were performed on the H&E-stained sections, here showing the annotations in sections from one HC and each IPF donor, displaying the extent of tissue remodeling. Differential expression analysis performed on pseudo-bulk Visium data between IPF and HC identified several extracellular matrix and fibrosis-related genes, and when plotted spatially, their expression largely originates from regions of tissue fibrosis.
Extended Data Fig. 2
Extended Data Fig. 2. Differential gene expression in IPF and NMF factor distribution.
a) Differential gene expression between annotated fibrotic regions of IPF lungs and HC samples. b) Differential gene expression between annotated alveolar regions from IPF lungs and samples from healthy control (HC) lungs. c) Overlap of significantly (FDR-adjusted p-value < 0.01) upregulated (top) and downregulated (bottom) DEGs in IPF alveolar and fibrotic regions compared to HC. d) The spatial gene expression of the 223 overlapping upregulated DEGs were used to calculate correlation (Pearson) values from the fibrotic border distances using gene expression against the 0-500 µm distances. The gene expression for the top 10 significantly (Benjamini–Hochberg adj. p < 0.05) up and down correlated genes, as well as the inferred cell densities of selected cell types, were visualized for the 2000 µm distances centered around the fibrotic border using a generalized additive model (GAM) for the regression line. Gray areas correspond to 95% confidence intervals. e) NMF factorization was performed on all human Visium samples. Spots with the highest activity (99th percentile; Fhi) for each factor were identified and used to calculate the proportion of Fhi spots among all spots, grouped by tissue block grading (B0-B1) and displayed as a stacked bar chart. NMF, non-negative matrix factorization; DEG, differentially expressed gene; HC, healthy controls. Source data
Extended Data Fig. 3
Extended Data Fig. 3. F14hi clusters in human lung tissues.
a) Gene expression profiles for F14hi cluster (C0-C4) top marker genes. Color scale represents average scaled expression, and dot size reflects the proportion of spots expressing each gene. b) Spatial distribution of F14hi clusters C0-C4 overlaid on H&E images of three human IPF lung sections. Similar spatial patterns were observed in all IPF sections. c) Approach for calculating spatial enrichment of each F14hi clusters at distances from FF. The radial distances, d, from the FF were extracted for all spots, where 0 µm corresponds to the outer FF border. The observed F14hi cluster spot locations were registered at each distance (binned into 100 µm to cover each row of spots), and the F14hi cluster labels were shuffled across all spots within in each sample k=100 times to produce a null distribution (that is, how each cluster would be distributed if there were no spatial patterns). For each cluster, the observed count at every distance (xd) and the mean (µd) and standard deviation (s.d., σd) across all randomization rounds were used to compute a Z-score per d. d) Spatial overlay of the FF distance-colored spots over the H&E-stained tissue image for a few selected areas. e) Enrichment of each F14hi cluster at distances (µm) from FF using a Z-score computed with a randomized spatial cluster distribution as the baseline. Two-sided p-values were calculated using the Z-scores, and the bars are colored based on their significance levels (dark blue: p < 0.01; light blue: p < 0.05). FF, fibroblastic focus; H&E, Hematoxylin and eosin. Source data
Extended Data Fig. 4
Extended Data Fig. 4. Spatial and molecular analysis of BLM-induced mouse lung fibrosis.
a) H&E-stained sections of mouse lung tissues collected at day 7 (d7) and day 21 (d21) post-BLM or saline vehicle treatment that were used for Visium analysis. b) Summarizing statistics of Visium spot count used and histopathological annotations. Center line, median; box limits, upper and lower quartiles; whiskers, 1.5× interquartile range. c) Volcano plots depicting differential expression analysis results between BLM and vehicle-treated lungs at d7 and d21, highlighting genes with significant (adj. p < 0.01) changes in expression. d) Network of top significant (p value < 0.0001) canonical pathway enrichment results based on human hsNMF-F14hi C0 and mouse mmNMFd21-F14hi C0 marker genes (adj. p < 0.05), with specific pathways within each node cluster annotated. Inner nodes illustrate groups of regulators sharing genetic influences, and outer nodes represent contributing marker genes. e) Spatial plots of mmNMF-F14hi C0-C2 and regions histologically annotated as fibrotic tissue (gray) for all the BLM-challenged lungs collected at d21. f) To quantify the spatial localization of the mmNMF-F14hi clusters in relation to fibrotic tissue, the same strategy as presented in Extended Data Fig. 2h was employed, except for using regions annotated as fibrotic to extract radial distances. g) Z-scores for each cluster plotted across each distance bin, relating to the distance from fibrotic regions (yellow shaded areas) across all tissue samples. P-values were computed from the Z-scores using a two-tailed test (dark blue: p < 0.01; light blue: p < 0.05; gray: ≥ 0.05). mmF14hi C0 was significantly enriched within the border of fibrotic areas, especially at 150-350 µm distances into the fibrotic tissue. On the other hand, there was an underrepresentation of mmF14hi C0 spots in areas outside the fibrosis. H&E, Hematoxylin and eosin. Source data
Extended Data Fig. 5
Extended Data Fig. 5. Profibrotic macrophages and immune cell profiles.
a) Heatmap showing the gene contributions to the identified M2-like macrophage-related factors across human lungs (hsNMF-F5) and mouse lungs at day 7 (d7) (mmNMFd7-F15) and day 21 (d21) (mmNMFd21-F8). The visualized genes are those, among the top 100 contributing genes, that overlapped between at least two of the three groups. Color represents each gene’s factor contribution as their scaled weight, where 1 is assigned to the strongest contributing gene to the factor out of all genes in the data set. b) Spatial distribution of macrophage-associated factors in human (hsNMF-F5) and mouse d21 (mmNMFd21-F8) tissue sections. The top 99th percentile of either factor was labelled as hsNMF-F5hi or mmNMFd21-F8hi and visualized together with the histopathological spot annotations grouped into ‘fibrotic / remodeled’ tissue (gray) and remaining tissue (light gray). Zoomed in graphs display factor activity overlaid the H&E images for selected regions that demonstrated high factor activity in areas of bronchial epithelium within fibrotic tissue. c) Top 15 contributing genes to mmNMFd21-F13, which was identified to contain a strong plasma cell profile driven by Igha, among other immunoglobulin-related genes. H&E, Hematoxylin and eosin. Source data

References

    1. Richeldi, L., Collard, H. R. & Jones, M. G. Idiopathic pulmonary fibrosis. Lancet389, 1941–1952 (2017). 10.1016/S0140-6736(17)30866-8 - DOI - PubMed
    1. Spagnolo, P. et al. Idiopathic pulmonary fibrosis: disease mechanisms and drug development. Pharm. Ther.222, 107798 (2021). 10.1016/j.pharmthera.2020.107798 - DOI - PMC - PubMed
    1. Mei, Q., Liu, Z., Zuo, H., Yang, Z. & Qu, J. Idiopathic pulmonary fibrosis: an update on pathogenesis. Front. Pharm.12, 797292 (2021). 10.3389/fphar.2021.797292 - DOI - PMC - PubMed
    1. Adams, T. S. et al. Single-cell RNA-seq reveals ectopic and aberrant lung-resident cell populations in idiopathic pulmonary fibrosis. Sci. Adv.6, eaba1983 (2020). 10.1126/sciadv.aba1983 - DOI - PMC - PubMed
    1. Habermann, A. C. et al. Single-cell RNA sequencing reveals profibrotic roles of distinct epithelial and mesenchymal lineages in pulmonary fibrosis. Sci. Adv.6, eaba1972 (2020). 10.1126/sciadv.aba1972 - DOI - PMC - PubMed

MeSH terms