. 2024 Sep;4(9):1231-1248.
doi: 10.1038/s43587-024-00663-7. Epub 2024 Jul 1.

Targeting senescence induced by age or chemotherapy with a polyphenol-rich natural extract improves longevity and healthspan in mice

Affiliations

Targeting senescence induced by age or chemotherapy with a polyphenol-rich natural extract improves longevity and healthspan in mice

Sara Zumerle et al. Nat Aging. 2024 Sep.

Abstract

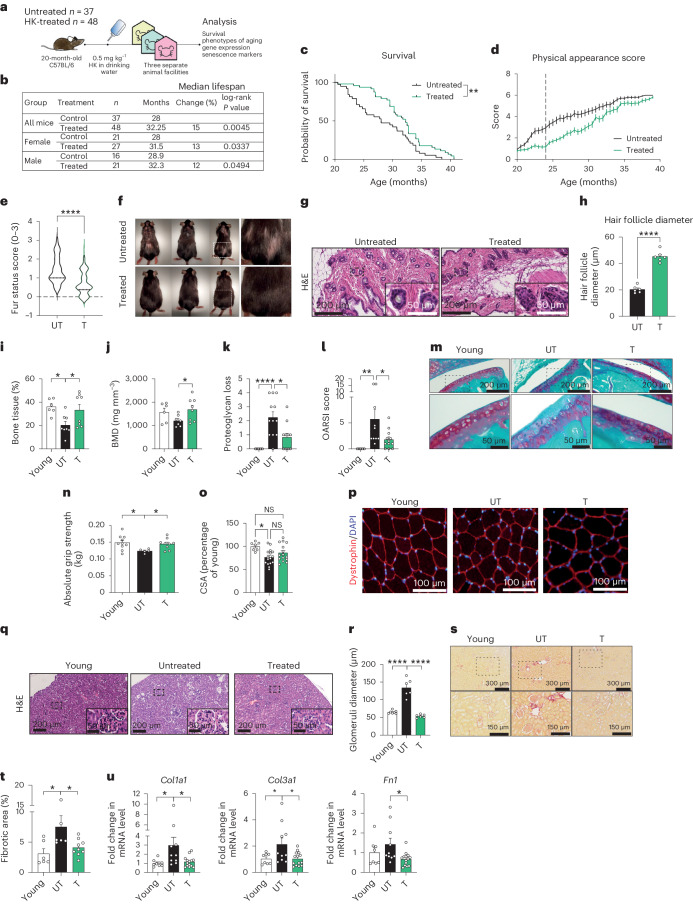
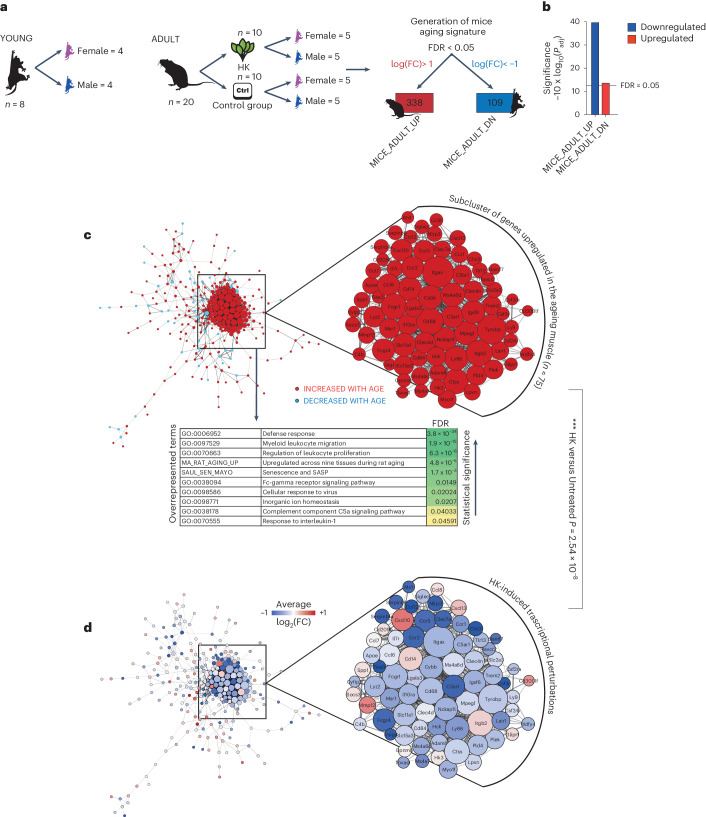
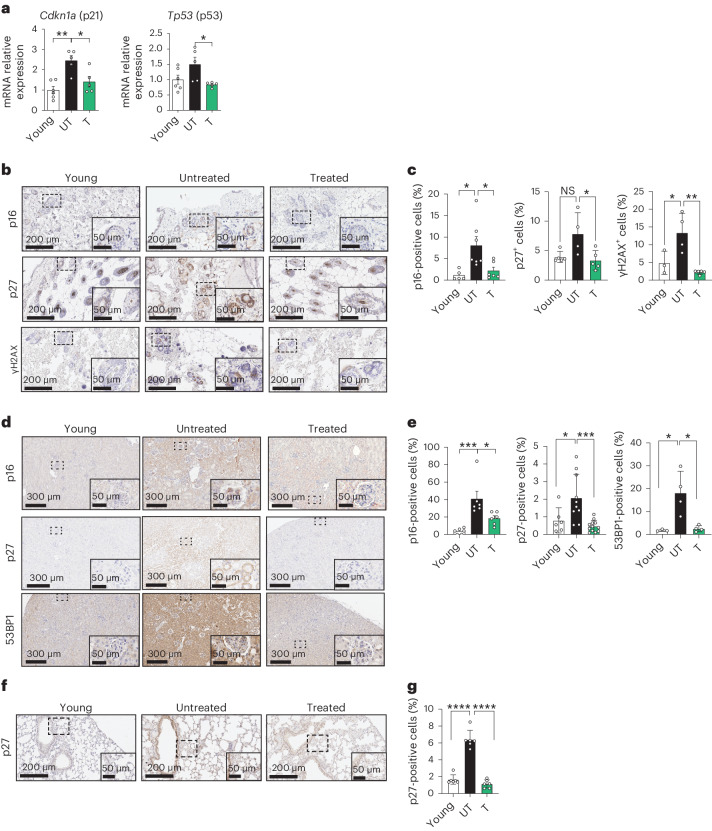
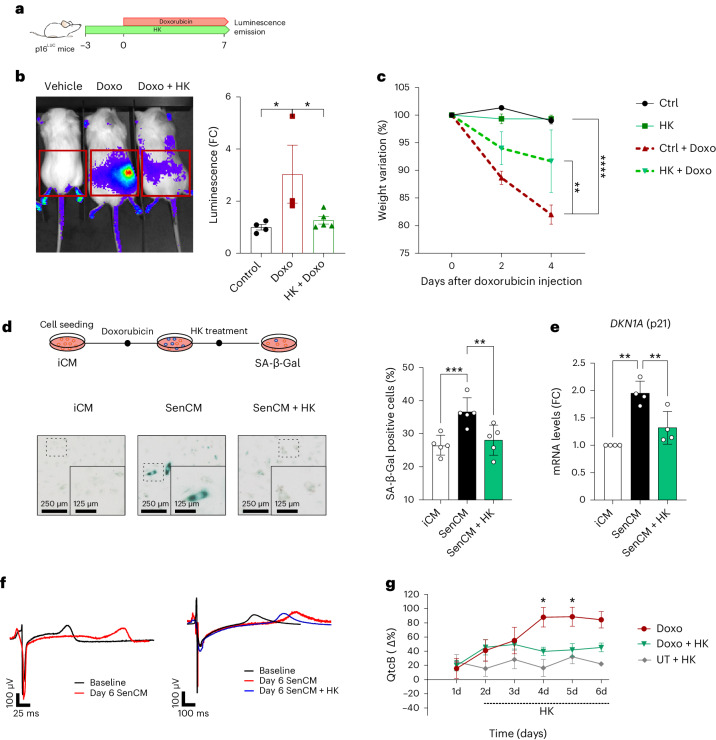
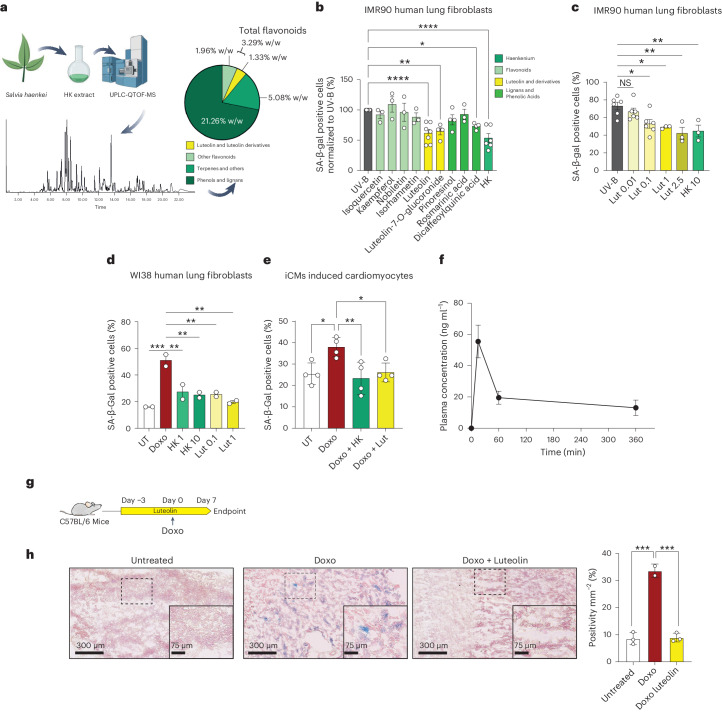
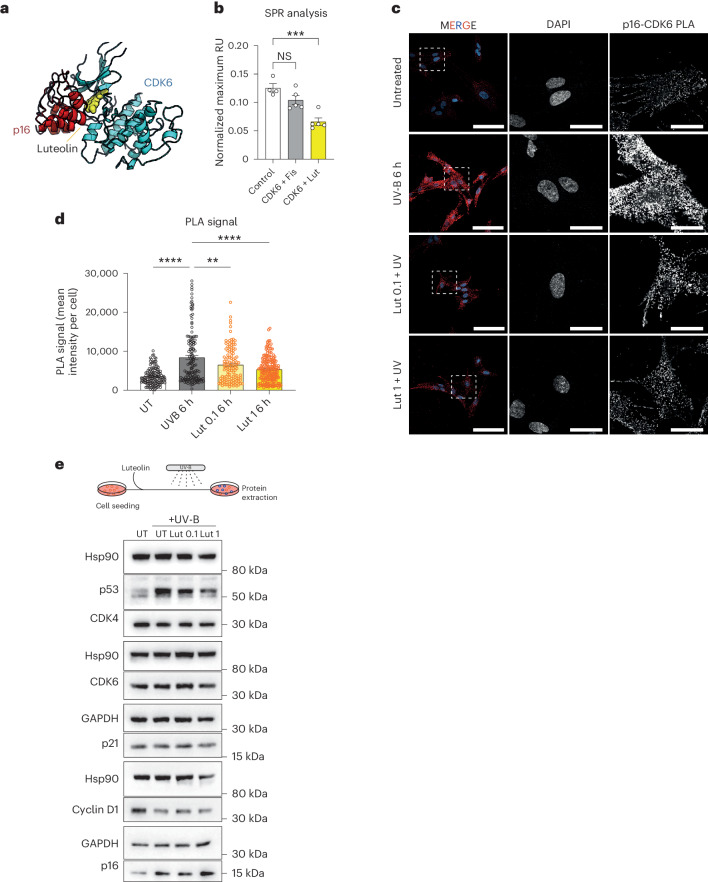
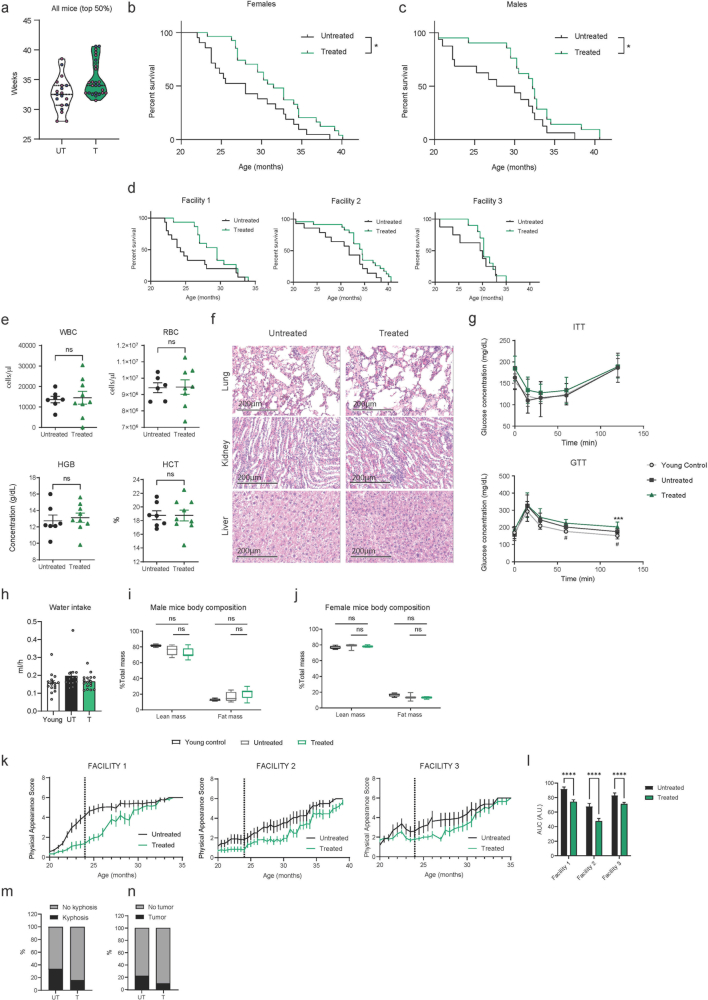
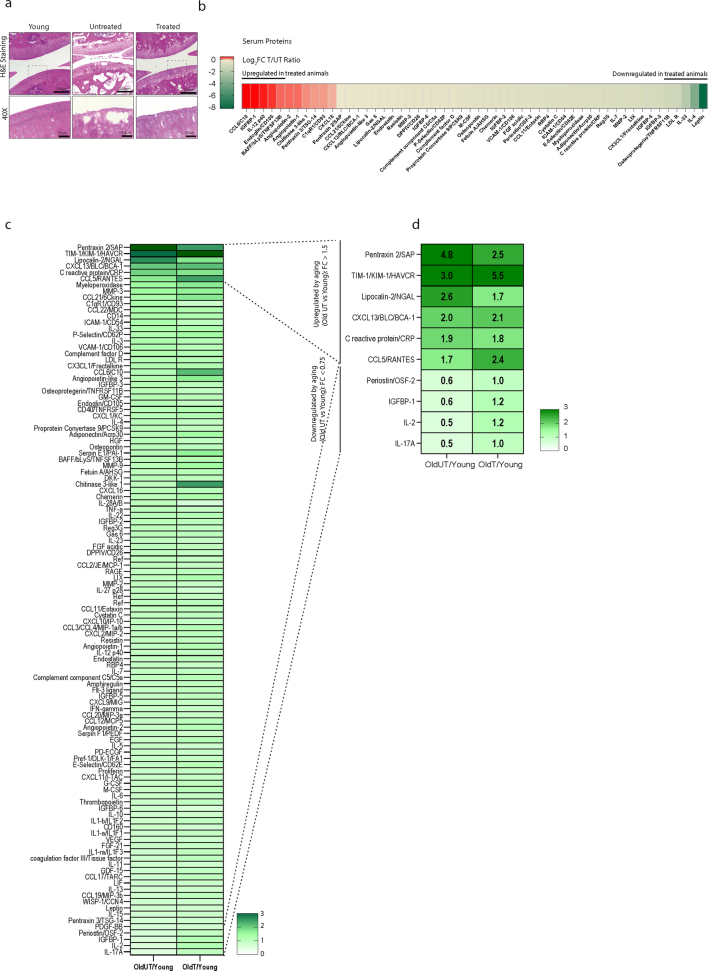
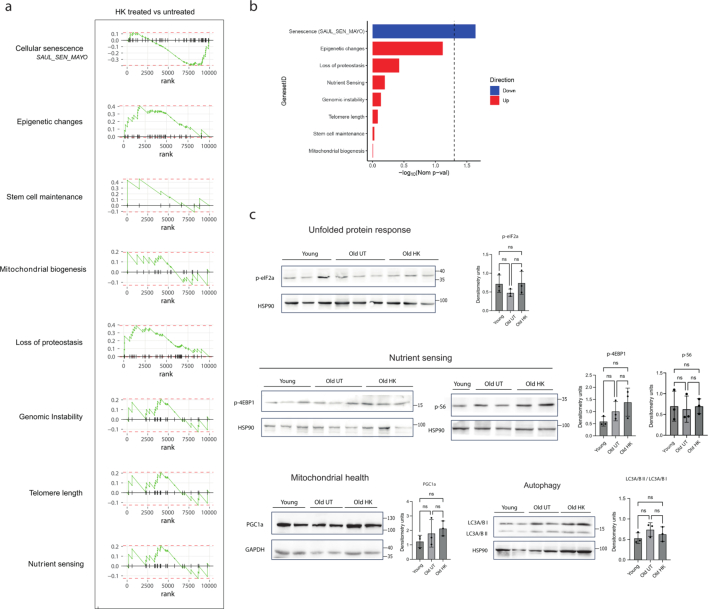
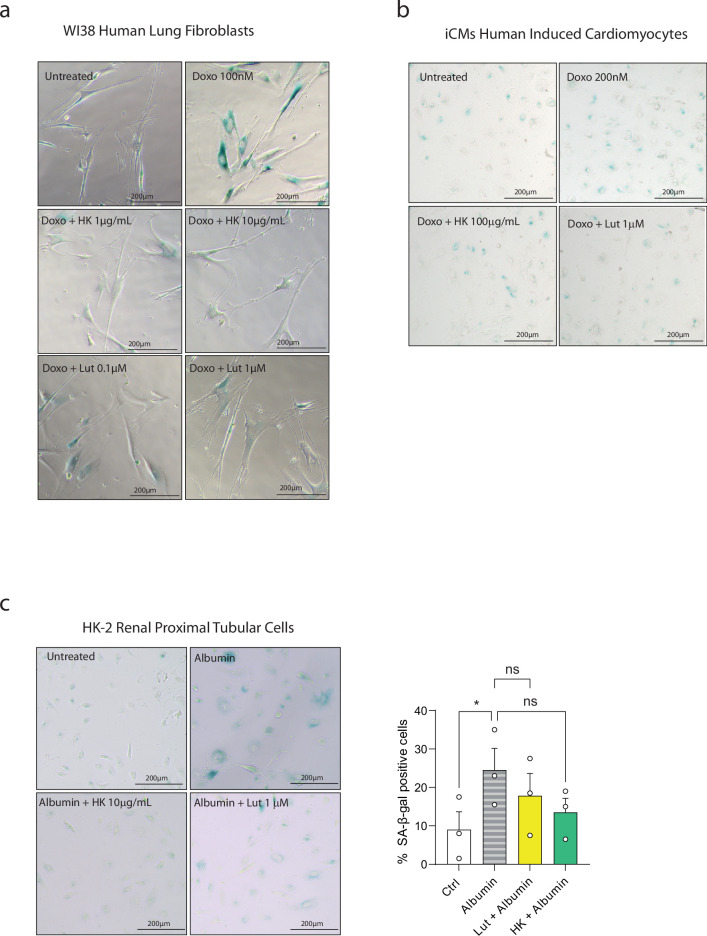
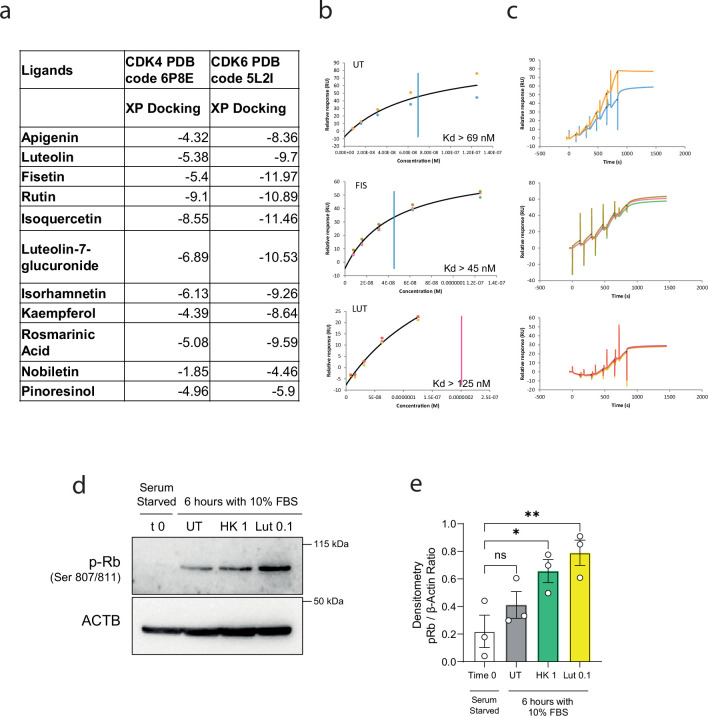
Accumulating senescent cells within tissues contribute to the progression of aging and age-related diseases. Botanical extracts, rich in phytoconstituents, present a useful resource for discovering therapies that could target senescence and thus improve healthspan. Here, we show that daily oral administration of a standardized extract of Salvia haenkei (Haenkenium (HK)) extended lifespan and healthspan of naturally aged mice. HK treatment inhibited age-induced inflammation, fibrosis and senescence markers across several tissues, as well as increased muscle strength and fur thickness compared with age-matched controls. We also found that HK treatment reduced acutely induced senescence by the chemotherapeutic agent doxorubicin, using p16LUC reporter mice. We profiled the constituent components of HK by mass spectrometry, and identified luteolin-the most concentrated flavonoid in HK-as a senomorphic compound. Mechanistically, by performing surface plasmon resonance and in situ proximity ligation assay, we found that luteolin disrupted the p16-CDK6 interaction. This work demonstrates that administration of HK promotes longevity in mice, possibly by modulating cellular senescence and by disrupting the p16-CDK6 interaction.


Conflict of interest statement

A.A. reports consulting fees and grants from IBSA Institute Biochimique SA. A.A. is inventor in patent nos. US9668961B2, EP2762131B1. A.A., A.M.G. and M.M. are inventors in patent nos. US11235016B2, US11235017B2. A.A. and A.M.G. are inventors in patent nos. WO2023280714A1 and WO2023280717A1. A.M.G. is an employee of IBSA Institute Biochimique SA. The remaining authors declare no competing interests.

Figures

Fig. 1
Fig. 1. HK expands healthspan and lifespan in mice.
a, Schematic representation of the experimental design. b, Lifespan analysis of treated and untreated mice; n = number of mice tested in each group; the percentage change was calculated with respect to control untreated mice. c, Survival curves for untreated (n = 37) and treated (n = 48) mice. d, Physical appearance score progression in untreated (UT) and treated (T) animals (UT n = 37; T n = 48). e, Quantification of the fur status based on the evaluation score (0–3, where 0 indicates dense fur and 3 indicates thinner fur (UT n = 27; T n = 46; treatment lasted 4 months). f, Representative pictures of 24-month-old mice untreated or HK treated. g, Representative pictures of H&E staining of skin of 24-month-old animals. Insets show enlarged image of dashed box. h, Quantification of hair follicle diameter from sections of 24-month-old untreated or HK-treated mice (n = 6). i,j, Bone tissue percent (i) and bone mineral density (j) of the femurs of young (4 months old) and 24-month-old animals after 4 months of treatment (Bone tissue %, Young n = 6; UT n = 8; T n = 8. Bone mineral density, Young n = 6; UT n = 7; T n = 8). k, Quantification of proteoglycan loss (Young n = 8; UT n = 12; T n = 12). l, OARSI score quantification (Young n = 8; UT n = 10; T n = 12). m, Representative images of Safranin staining for the detection of proteoglycan-rich cartilage of young (4 months old), 24-month-old untreated and 24-month-old treated animals after 4 months of treatment (top images observed at ×10 magnification, bottom (area indicated in dashed box in upper image) at ×40). n, Results of grip strength assay performed on young (3-month) and old (24-month) animals after 4 months of treatment (Young n = 10, UT n = 5, T n = 9). o, Quantification of tibialis muscle fiber CSA (Young n = 7; UT n = 16, T n = 15). p, Representative pictures of tibialis muscle sections with dystrophin immunofluorescence from young (4 months old), 24-month-old untreated or 24-month-old HK-treated mice after 4 months of treatment. q, Representative pictures of H&E staining of kidney sections of young (4 months old), 24-month-old untreated and 24-month-old treated animals after 4 months of treatment. Insets show enlarged image of dashed box. r, Quantification of glomeruli diameter (Young n = 7; UT n = 6; T n = 6). s, Representative pictures of PSR staining of kidney sections of young (4 months old), 24-month-old untreated and 24-month-old treated animals after 4 months of treatment. Insets show enlarged image of dashed box. t, Quantification of percentage of fibrotic area in kidney sections (Young n = 6; UT n = 6; T n = 9). u, Kidney mRNA expression of Fn1, Col1a1 and Col3a1 (each dot represents a different animal; Young n = 8, UT n = 10, T n = 14). Data presented in d, h, i, j, k, l, n, o, r, t and u are presented as mean ± s.e.m. Data presented in e are presented as a violin plot. Statistical test used in b and c: log-rank test. Statistical test used in e, h and j: two-tailed unpaired t-test. Statistical test used in i, k, l, n, r, t and u: one-way ANOVA with Holm–Šidák’s multiple comparisons test. Statistical test used in o: Kruskal–Wallis test with Dunn’s multiple comparisons test. *P < 0.05; **P < 0.01; ***P < 0.001; ****P < 0.0001; NS, nonsignificant. Exact P values found in source data files. Source data
Fig. 2
Fig. 2. HK partially reverts age-related gene expression signature in mouse muscles.
a, Experimental design of the bulk RNA-seq experiment. Total RNA was extracted from the gastrocnemius muscle of young (4 months old), old untreated (24 months old) and old treated (24 months old, 4 months of treatment) animals (Young n = 8, UT n = 10, T n = 10). b, Barplot representing GSEA results between old HK-treated animals and age-matched controls. Tested gene sets are those obtained by differential expression between older animals and younger controls (false discovery rate < 0.05, log2(FC) <−1 or >1). Barplots indicate a significant counteraction of HK towards age-induced perturbation in muscle tissue. c,d, Protein–protein interaction network including DEGs (false discovery rate < 0.05, log2(FC) <−1 or >1), as determined from muscle tissue of older mice compared with younger counterparts (c) or from the comparison between HK-treated animals versus aged-matched controls (d) showing close-up view of the genes most upregulated in aging. The table of overrepresentation analysis in c indicates gene sets significantly upregulated in the aging muscle.
Fig. 3
Fig. 3. HK improves senescence in mice.
a, mRNA levels of Cdkn1a and Tp53 in the gastrocnemius muscle of young (4 months old), old untreated (24 months old) and old treated (24 months old, 4 months of treatment) animals (Young n = 6, UT n = 5, T n = 5). b, Representative images of p16, p27 and γH2AX IHC analysis performed on skin sections of young (4 months old), old untreated (24 months old) and old treated animals (24 months old, treatment for 4 months). Insets show enlarged image of dashed box. c, Quantification of p16, p27 and γH2AX-positive cells in skin sections from different animals (each dot represents a different animal; p16 Young n = 5, UT n = 7, T n = 6; p27 Young n = 5, UT n = 4, T n = 5; γH2AX Young n = 3, UT n = 4, T n = 5). d, Representative images of p16, p27 and 53BP1 IHC analysis performed on kidney sections of young (4 months old), old untreated (24 months old) and old treated (24 months old, 4 months of treatment) animals. Insets show enlarged image of dashed box. e, Quantification of p16-, p27- and 53BP1-positive cells in kidney sections from different animals (each dot represents a different animal; p16 Young n = 6, UT n = 6, T n = 6; p27 Young n = 6, UT n = 10, T n = 12; 53BP1 Young n = 3, UT n = 4, T n = 4). f, Representative pictures of p27 immunohistochemistry performed on lung sections of young (4 months old), old untreated (24 months old) and old treated (24 months old, 4 months of treatment) animals. Insets show enlarged image of dashed box. g, Quantification of p27-positive cells in lung sections from different animals (each dot represents a different animal; n = 6). Data in a, c, e, g are presented as mean ± s.e.m. Statistical test used in a, c, e and g: one-way ANOVA with Tukey’s multiple comparisons test. *P < 0.05; **P < 0.01; ***P < 0.001; ****P < 0.0001; NS, nonsignificant. Exact P values found in source data files. Source data
Fig. 4
Fig. 4. HK protects against Doxo-induced senescence and cardiotoxicity.
a, Schematic representation of the experimental design. b, Left, representative images of luciferase detection in untreated and Doxo-injected animals (20 mg kg−1), with or without HK pretreatment (3 days, 0.5 mg kg−1). On the right, histograms show relative luminescence induction as FC (Control n = 4, Doxo n = 3, HK + Doxo n = 5). c, Animal weight loss measured 2 and 4 days after Doxo injection (n = 3). d, Representative images of SA-β-Gal staining of induced cardiomyocytes, with Doxo (SenCMs) or without (iCMs) or with 100 μg ml−1 of HK (n = 5) (left), and its quantification (right). Insets show enlarged image of dashed box. e, mRNA expression of CDKN1A (p21) as determined by RT-qPCR (n = 4). f, HK effect on SenCMs field potentials. Examples of QT interval measured in field potential recorded from different experimental conditions in comparison with baseline (black traces) at day 0 and day 6 are shown in subsets. g, The electrical activity of spontaneously beating iCMs was recorded using MEA for 6 consecutive days at baseline, after Doxo treatment (red line), following exposure of SenCM to HK (Doxo + HK; green line) and after exposure of iCM to HK (UT + HK; gray line) (n = 5 as means of different recordings). Data in b, c, d, e, g are presented as mean ± s.e.m. Statistical test used in b: one-way ANOVA with Holm–Šidák’s multiple comparisons test. Statistical test used in c: two-way ANOVA with Dunnettʼs multiple comparisons test. Statistical test performed in d and e: repeated measures one-way ANOVA with Tukey’s multiple comparisons test. Statistical test performed in g: two-tailed unpaired t-test analyses of Doxo versus Doxo + HK. *P < 0.05; **P < 0.01. Exact P values found in source data files. Source data
Fig. 5
Fig. 5. HK contains luteolin, which prevents stress-induced senescence.
a, Top, Schematic representation of the experimental design; bottom, characterization of HK constituents by UPLC-QTOF-MS (Supplementary Table 4). b, Quantification of SA-β-Gal assay of UV-B-irradiated IMR90 fibroblasts, treated with the indicated compounds at 1 μM concentration or 10 μg ml−1 for HK (UV-B n = 9, isoquercetin n = 3, isorhamnetin n = 3, kaempferol n = 3, luteolin n = 7, luteolin-7-O-glucuronide n = 4, nobiletin n = 3, pinoresinol n = 4, rosmarinic acid n = 3, dicaffeoylquinic acid n = 4, HK n = 6 biological replicates). c, Quantification of SA-β-Gal-positive cells of UV-B irradiated IMR90 fibroblasts treated with different concentrations of Lut (0.01–2.5 μM) and HK (10 μg ml−1) (UV-B, Lut 0.01 μM, Lut 0.1 μM, n = 6 biological replicates; Lut 1 μM, Lut 2.5 μM, HK 10 μg ml−1, n = 3 biological replicates). d, Quantification of SA-β-Gal assay of Doxo-treated WI38 fibroblasts with or without Lut (0.1 and 1 µM) or HK (1 and 10 µg ml−1) (n = 2 biological replicates). e, Quantification of SA-β-Gal assay of Doxo-treated iCM cardiomyocytes treated with or without Lut (1 µM) or HK (100 µg ml−1) (n = 4 biological replicates). f, Luteolin plasma concentration in mice treated with a single dose of HK by oral gavage (0.5 mg kg−1) at 0, 15, 60 and 360 min (n = 3 animals per timepoint). g, Schematic representation of the experimental design. h, Representative pictures of SA-β-Gal staining (left) and quantification (right) on kidney sections. Insets show enlarged image of dashed box. (Untreated n = 3, Doxorubicin n = 2, Doxo + Luteolin n = 3 animals). Data in b, c, d, e, f and h are presented as mean ± s.e.m. Statistical test performed in b, c, d, e: one-way ANOVA with Dunnett’s multiple comparisons test. Statistical test performed in h: one-way ANOVA with Tukey’s multiple comparisons test. *P < 0.05; **P < 0.01, ***P < 0.001; ****P < 0.0001; NS, nonsignificant. Exact P values found in source data files. Image in Fig. 5a created in using BioRender.com. Source data
Fig. 6
Fig. 6. Disruption of the p16–CDK6 complex by luteolin.
a, Atomistic model of the CDK6–p16 complex with luteolin obtained by the alignment of the results of docking calculations. b, SPR analysis to determine the CDK6–p16 interaction alone or with Fisetin (Fis) or Lut (Control n = 4, CDK6 + Fis n = 5, CDK6 + Lut n = 5 independent experiments). c, Representative pictures of PLA of CDK6–p16 interaction in UV-B-irradiated WI38 fibroblasts, pretreated with Lut (0.1 and 1 μM) for 1 h. Scalebars, 100 μm in merged panels, 25 μm in DAPI and p16–CDK6 PLA panels. Experiment performed twice independently with similar results. d, Quantification of PLA assay (UT n = 134, UV-B 6 h n = 142, Lut 0.1 6 h n = 122, Lut 1 6 h n = 170 cells observed over two independent experiments). e, Western blot analysis of the indicated proteins before and after UV-B irradiation of WI38 cells (n = 2 independent experiments). Data in b and d are presented as mean ± s.e.m. Statistical test performed in b: one-way ANOVA with Dunnett’s multiple comparisons test. Statistical test performed in d: one-way ANOVA with Bonferroni’s multiple comparisons test. **P < 0.01, ****P < 0.0001; NS, nonsignificant. Exact P values found in source data files. Source data
Extended Data Fig. 1
Extended Data Fig. 1. Haenkenium expands healthspan and lifespan in mice and does not show toxicity in vivo.
a, Lifespan comparison of the most longest-lived mice from untreated and treated groups (top 50%); pink marks indicate females, blue marks indicate males (Female UT n = 11; Female T n = 14; Male UT n = 8; Male T n = 11). b, Survival curves for female mice (UT n = 21, T n = 27). c, Survival curves for male mice (UT n = 16, T n = 21) animals. d, Survival curves of animals hosted and treated in the different facilities (Facility 1 Treated n = 15; Untreated n = 15; Facility 2 Treated n = 23; Untreated n = 14; Facility 3 Treated n = 10; Untreated n = 8). e, Hematological parameters of treated and untreated animals: white blood cells (WBC), red blood cells (RBC), hemoglobin concentration (HGB), hematocrit (HCT) (WBC, HGB, HCT; UT n = 7, T n = 9. RBC, UT n = 6, T n = 8). f, Representative images of lung, kidney and liver of 24-month old treated and untreated animals after 4 months of treatment. No significant differences can be spotted among groups (photomicrographs representative of similar results from n = 4 mice per group). Scalebar: 200 μm. g, Glucose concentration after insulin injection (ITT upper panel) and after glucose injection (GTT, lower panel) (UT n = 7, T n = 9, Young n = 10). h, Average water intake during the whole day, ml/h (Young n = 15, UT n = 13, T n = 17). i-j, Lean and Fat mass were analyzed by EchoMRI in male (i) (UT n = 5. Treated n = 7. Young Control n = 4) and female (j) (UT n = 3, Treated n = 3, Young Control n = 4) animals. k, Physical appearance score progression of animals hosted and treated in the different facilities (Facility 1 Treated n = 15; Untreated n = 15; Facility 2 Treated n = 23; Untreated n = 14; Facility 3 Treated n = 10; Untreated n = 8). l, Area under the curve (AUC) analysis for data in e. (A.U. Arbitrary Units). m, Percentage of animals with kyphosis after 4 months of treatment (UT n = 27, T n = 46). n, Tumor prevalence after four months of treatment (UT n = 9, T n = 10). Data presented in panels e, g, h, i, j, k, l are presented as mean ± SEM. Statistical test used in b and c: Log-rank test. Statistical test used in e, l: Two-tailed unpaired t-test. Statistical test used in g: Two-way RM ANOVA with Dunnet’s multiple comparisons test. Statistical test used in h: One-Way ANOVA with Tukey’s test. Statistical test used in i, j: Two-way ANOVA with Dunnet’s multiple comparisons test. *=p < 0.05; ***=p < 0.001; # =p < 0.05 (UT vs Young Control). Exact p values found in source data files. Source data
Extended Data Fig. 2
Extended Data Fig. 2. Haenkenium protects joints and modulates cytokine expression in tissues.
a, Representative micrographs of Hematoxylin & Eosin staining of the knee joints of young (4-month-old), 24-month-old untreated, and 24-month-old treated animals after 4 months of treatment (top images observed at 10x magnification, bottom at 40x). Scalebar = 200 μm, inserts 50 μm. Photomicrographs representative of similar results from Young n = 8; UT n = 10; T n = 12 independent experiments. b, Proteome profiler analysis of cytokines expressed in serum of 24-month old untreated and animals, after 4 months of treatment. The heatmap represents the log2 fold change of the comparison between treated and untreated animals. c, Proteome profiler analysis of cytokines of kidney protein lysates from young (4-month-old), 24-month-old untreated, and 24-month-old treated mice after 4 months of treatment. The heatmap represents the fold change (FC) of the comparison of untreated/treated old mice relative to young. d, Highlight of proteins that are increased (FC > 1.5) and decreased (FC < 0.75) by aging, respectively. Source data
Extended Data Fig. 3
Extended Data Fig. 3. Haenkenium treatment does not affect several hallmarks of aging in muscle transcriptome and in kidneys.
a, Gene Set Enrichment Analysis (GSEA) of manually curated gene sets corresponding to different aging-related pathways in muscle tissue from HK-treated and untreated 24-month-old animals after 4 months of treatment (n = 10). b, Results of GSEA analysis shown in (a). Barplots indicate the significance of the comparison between HK-treated and untreated 24-month-old animals after 4 months of treatment. c, Western blot and densitometric analysis of of p-eIF2α, p-4EBP1, p-S6, LC3A/B and PGC1α from the kidney of young (4-month-old), 24-month-old untreated, and 24-month-old treated animals after 4 months of treatment. (n = 3). Data in c are presented as mean ± SD. Statistical test used in c: One Way ANOVA with Tukey’s test. ns = not significant. Exact p values found in source data files. Source data
Extended Data Fig. 4
Extended Data Fig. 4. Anti-senescence effect of HK and luteolin in different cell types.
a-c, Representative SA-β-Gal photomicrographs of WI38 fibroblasts (a, n = 2 biological replicates), iCMs (b, n = 4 biological replicates). c, Representative SA-β-Gal photomicrographs of HK-2 renal proximal tubular cells (right) and their quantification (n = 3 biological replicates). Scalebar = 200 μm. Statistical test used in c: One Way ANOVA with Holm-Šídák’s test. Quantifications for a and b are shown in Fig. 5. Source data
Extended Data Fig. 5
Extended Data Fig. 5. Chemogenomic analysis and Surface plasmon resonance.
a, Evaluation of the GLIDE docking score for luteolin and other components of HK extract. b-c, Surface Plasmon Resonance Dose-response curve (b) and SPR sensograms (c) of the analysis of the SPR experiment to determine the CDK6-p16 Kd without any other molecules (UT) or in the presence of Luteolin (Lut) or Fisetin (Fis). Quantifications are shown in Fig. 6. d, Representative immunoblot of hyperphosphorylated Rb in untreated 48 hours serum starved IMR90 fibroblasts (t 0) or 6 hours following release from serum starvation induced cell cycle arrest with or without 1 μg/ml HK or 0.1 μM Lut (Lut 0.1). e, Densitometry of (d) (n = 3 biological replicates). Data are presented as mean ± SEM. Statistical test performed in e: One-way ANOVA with Dunnett’s test. *=p < 0.05; **=p < 0.01. Exact p values found in source data files. Source data

References

    1. Lutz, W., Sanderson, W. & Scherbov, S. The coming acceleration of global population ageing. Nature451, 716–719 (2008). - PubMed
    1. Kirkland, J. L. Translating advances from the basic biology of aging into clinical application. Exp. Gerontol.48, 1–5 (2013). - PMC - PubMed
    1. Kirkland, J. L. & Tchkonia, T. Clinical strategies and animal models for developing senolytic agents. Exp. Gerontol.68, 19–25 (2015). - PMC - PubMed
    1. Khosla, S., Farr, J. N., Tchkonia, T. & Kirkland, J. L. The role of cellular senescence in ageing and endocrine disease. Nat. Rev. Endocrinol.16, 263–275 (2020). - PMC - PubMed
    1. Goldman, D. P. et al. Substantial health and economic returns from delayed aging may warrant a new focus for medical research. Health Aff. (Millwood)32, 1698–1705 (2013). - PMC - PubMed