. 2024 Aug;26(8):1287-1295.
doi: 10.1038/s41556-024-01456-1. Epub 2024 Jul 1.

VAMP2 chaperones α-synuclein in synaptic vesicle co-condensates

Affiliations

VAMP2 chaperones α-synuclein in synaptic vesicle co-condensates

Chuchu Wang et al. Nat Cell Biol. 2024 Aug.

Abstract

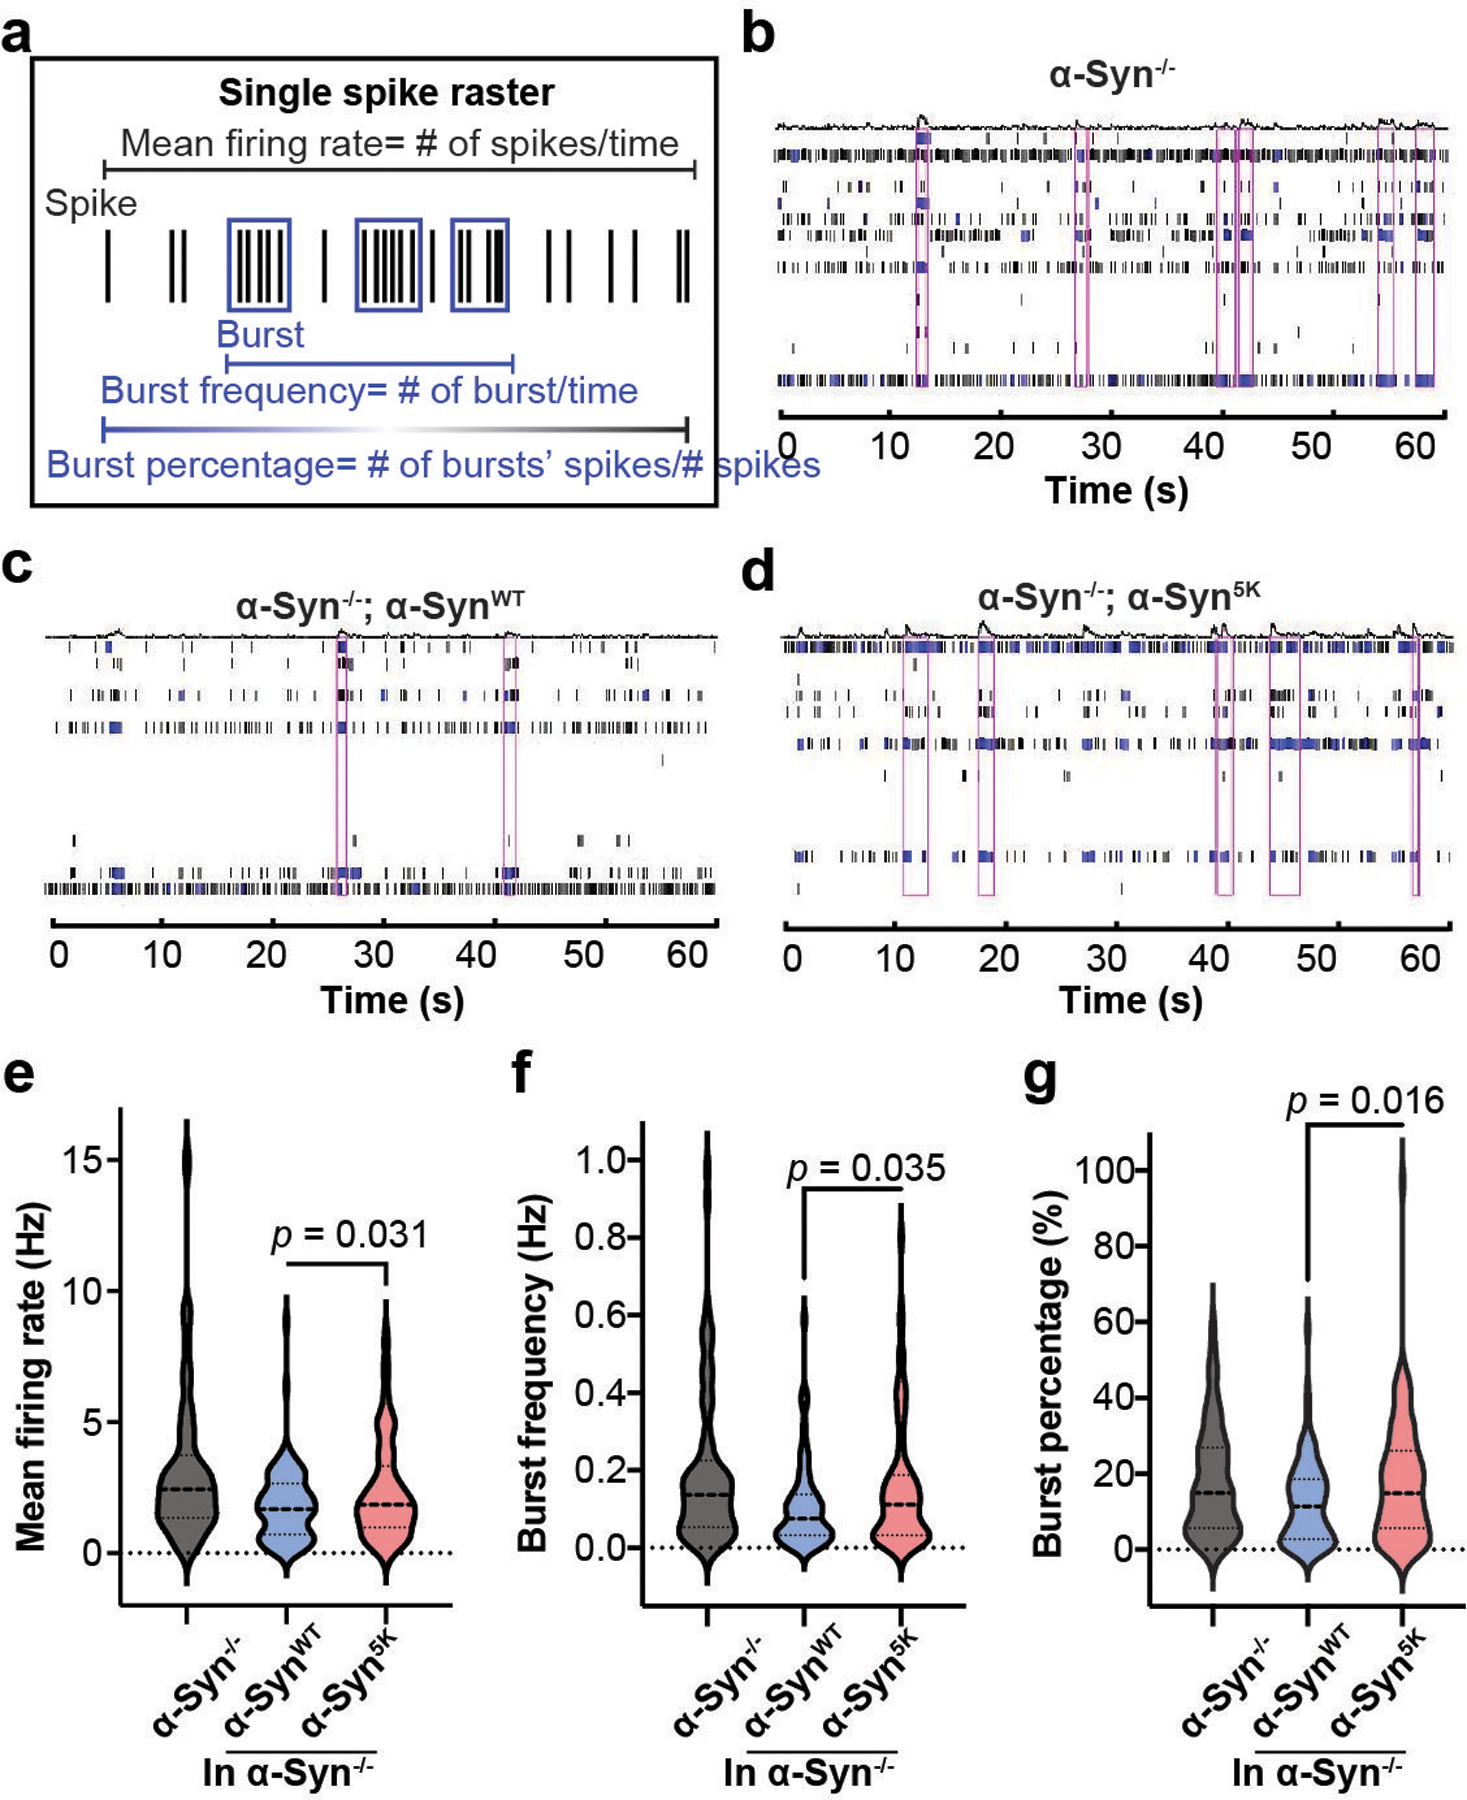
α-Synuclein (α-Syn) aggregation is closely associated with Parkinson's disease neuropathology. Physiologically, α-Syn promotes synaptic vesicle (SV) clustering and soluble N-ethylmaleimide-sensitive factor attachment protein receptor (SNARE) complex assembly. However, the underlying structural and molecular mechanisms are uncertain and it is not known whether this function affects the pathological aggregation of α-Syn. Here we show that the juxtamembrane region of vesicle-associated membrane protein 2 (VAMP2)-a component of the SNARE complex that resides on SVs-directly interacts with the carboxy-terminal region of α-Syn through charged residues to regulate α-Syn's function in clustering SVs and promoting SNARE complex assembly by inducing a multi-component condensed phase of SVs, α-Syn and other components. Moreover, VAMP2 binding protects α-Syn against forming aggregation-prone oligomers and fibrils in these condensates. Our results suggest a molecular mechanism that maintains α-Syn's function and prevents its pathological amyloid aggregation, the failure of which may lead to Parkinson's disease.


Conflict of interest statement

Competing interests: The authors declare no competing financial interests.

Figures

Extended Data Figure 1 |
Extended Data Figure 1 |. α-Syn, VAMP2, and SVs form a multi-component condensed phase.
(a) Dynamic light scattering measurement of the size distribution of SVM in solution. (b) Molecular weight and concentration of PEG pairs, (c) SVM lipid, and (d) NaCl concentrations scoring positive (blue dots) or negative (red dots) for the appearance of droplets. 100 μM VAMP21–96, and 100 μM α-Syn were used for all the titrations. Additionally, 1 mM SVMs, 5% (w/v) PEG 3350, or 1 mM SVMs and 5% (w/v) PEG 3350 were used for the titration in (b), (c), or (d), respectively. Fluorescence images of (e, top) 100 μM α-Syn (containing 1% Alexa555-α-Syn), (e, middle) 100 μM VAMP21−96 (containing 1% Alexa647-V2), (e, bottom) 100 μM α-Syn (containing 1% Alexa555-α-Syn) and 100 μM VAMP21−96 (containing 1% Alexa647-V2), (f) 100 μM α-Syn (containing 1% α-Syn-Alexa488) and 1 mM SVM with 100 μM other synaptic proteins (90 μM SNAP-25, 5 μM Munc18, and 5 μM Munc13), or (g) 100 μM α-Syn (containing 1% Alexa555-α-Syn) and 1 mM carboxyfluorescein-green-labeled SVM with 100 μM VAMP21−96 (containing 1% Alexa647-V2) in the buffer A (10 mM HEPES-Na pH 7.4, 5 mM Zn2+, 5% PEG3350), respectively. DIC: differential interference contrast. (h) The final SV product was fractionated into three fractions by gradient centrifugation. The SVs in the bottom layer were used for experiments. (i) Western blot of fractions collected from each step of SV purification. The fraction containing SV is highlighted in red boxes. Other fractions are labeled in abbreviations (see details in Methods). The fractions were immunoblotted for tubulin (cytosol marker), synaptophysin (SV marker), Rpt4 (proteasome marker), VDAC (mitochondria marker), and Sec61B (endoplasmic reticulum marker), respectively. (j) Representative negative staining TEM image of endogenous SVs (bottom layer) purified from mouse brains. Unprocessed blots are available in the Source Data Extended Data Fig. 1.
Extended Data Figure 2 |
Extended Data Figure 2 |. The C-terminal region of α-Syn electrically interacts with the juxtamembrane region of VAMP2.
(a) Top: residue-resolved relative NMR cross-peak intensity ratios (I/I0) of 100 μM N15α-Syn in 200 μM soluble VAMP2 (VAMP21−96) to that in solution. Bottom: residue-resolved relative NMR cross-peak intensity ratios (I/I0) of 100 μM soluble N15VAMP2 in 150 μM α-Syn to that in solution. (b) The C-terminal region of α-Syn is important for interacting with VAMP2. The 2D 1H-15N HSQC spectrum of 15N-labled soluble VAMP2 (black) and in the presence of α-Syn1−100 alone (red) are almost identical, which validates that the C-terminal end of α-Syn is responsible for the interaction between α-Syn and VAMP2. (c) Circular dichroism spectroscopy of α-Syn1−100 alone (black), in the presence of DOPS (red) or DOPC (blue) liposomes, shows that the C-terminal truncation does not influence membrane binding of α-Syn. The molar ratios of VAMP2 to α-Syn are indicated. (d) The turbidity was measured for several mixtures: 1 mM SVM alone, SVM mixed with α-Syn only, SVM with VAMP21−96 and α-Syn, SVM with VAMP21−96 and α-Syn1−100, and SVM with VAMP21−78 and α-Syn. The wavelength was 600 nm, and the molar ratio of liposome:VAMP2:α-Syn was 10:1:1. Data are means ± SD; error bars represent the SD of three replicates. (e) Comparison of expression levels of α-Syn-GFP (Fig. 1e) and α-Syn1−100-GFP (Fig. 3b) in cultured cortical neurons by immunoblotting. (f) 2D 1H-15N HSQC of 15N-labled soluble VAMP2 only (black) and in the presence of α-Syn5A (E105A, D119A, E126A, E130A, E137A) alone (red) are nearly identical. (g) Per residue chemical shift changes of soluble VAMP2 signals upon α-Syn5A titration. Source numerical data and unprocessed blots are available in the Source Data Extended Data Fig. 2.
Extended Data Figure 3 |
Extended Data Figure 3 |. The negatively charged phosphatidylserine (PS) is important in α-Syn-induced clustering.
(a) Experimental scheme of single-vesicle assay for monitoring vesicle clustering. A saturated layer of DiI-labeled SVM was immobilized on an imaging surface via biotin–NeutrAvidin interactions. After free-floating DiD-labeled SVM was injected into the sample chamber, clustering in the presence or absence of α-Syn was determined by counting the number of spots arising from the fluorescence emission of DiD upon excitation at 633 nm. (b) The number of interacting DiD-labeled, protein-free SVMs—with or without PS—interacting on the imaging surface was assessed both in the presence of α-Syn or not. (c) The number of interacting DiD-labeled, full-length VAMP2 reconstituted SVMs—with or without PS—interacting on the imaging surface was assessed both in the presence of α-Syn or not. (b-c) Bar graphs: quantification of interacting vesicles; data are means ± SD; unpaired two-tailed t-test; n (left to right) = 8, 20, 25, 12, or 16 random imaging locations for (b) or (c), respectively. (d) Residue-resolved relative NMR signal intensity ratios (I/I0) of α-Syn titrated by DOPC liposome at indicated protein/lipid molar ratios. Dashed lines highlight the residue positions 30 and 95. Source numerical data is available in the Source Data Extended Data Fig. 3.
Extended Data Figure 4 |
Extended Data Figure 4 |. Disrupting the interface between α-Syn and VAMP2 impairs the catalysis role of α-Syn in SNARE complex assembly.
Expression levels of three SNARE proteins in HEK293T cells co-transfected with plasmids expressing syntaxin-1 (Synt-1), VAMP2, and SNAP-25 at a 1:1:1 ratio, together (a,b) with an increasing amount (0–3-fold) of α-Syn variant plasmids (WT and α-Syn100), and (c,d) with 4-fold expression plasmids of GFP, α-SynWT and α-Syn5K. Cell lysates were immunoblotted for the indicated SNAREs, followed by quantitation for representative immunoblots (see Fig. 4e). Total expression levels of individual SNARE proteins or balancing emerald in transfected HEK-293T cells were analyzed by melting SNARE-complexes in SDS sample buffer (100 °C for 20 min), and quantitated by immunoblotting, normalized to α-tubulin (α-Tub) or heat shock cognate 71 kDa protein. HEK293T cell lysates (e) (n = 6 independent replicates) or primary neuron lysates (f) (n = 5 independent replicates) were immunoblotted for SNARE complexes and α-Syn followed by quantification and normalization to heat shock cognate 71 kDa protein (Hsc70) or β-tubulin-III (Tuj1) levels. Data shown are means ± SD; unpaired two-tailed t-test; n = 3 or 6 independent cultures for (a-b) or (d), respectively. Source numerical data and unprocessed blots are available in the Source Data Extended Data Fig. 4.
Extended Data Figure 5 |
Extended Data Figure 5 |. Disrupting the interface between α-Syn and VAMP2 impairs the role of α-Syn in synaptic transmission.
(a) Graphic annotation of the multi-electrode array (MEA) assay on cultured primary neurons. (b-d) Representative images of conducting MEA assay in the α-Syn knockout neurons or knockout neurons expressing wildtype α-Syn or α-Syn5K mutant. (e-g) Violin plots of MEA data from α-Syn knockout neurons or knockout neurons expressing wildtype α-Syn or α-Syn5K mutant were subjected to analyze mean firing rate (d), burst frequency (e), and burst percentage activity (f). In the Violin plots, the lower dashed line represents the first quartile, the middle dashed line represents the median, and the upper dashed line represents the third quartile; unpaired two-tailed t-test; n (left to right) = 88 or 82, 73, 80 or 84, 80, 86 events for (e) or (f) or (g), respectively. Source numerical data is available in the Source Data Extended Data Fig. 5.
Extended Data Figure 6 |
Extended Data Figure 6 |. VAMP2 prevents α-Syn aggregation in vitro and in neurons.
(a) ThT spectra and (b) negative staining TEM images show α-Syn (50 μM) amyloid aggregation in the presence of PS liposomes with VAMP25A (S80A, K83A, K85A, R86A, K87A) mutant or VAMP2. Data are means ± SD; error bars represent the SD of three replicates. (c) Immunofluorescence images of hippocampal neurons transfected with the same amount of plasmids of full-length and C-terminally-truncated α-Syn-GFP, respectively, for 12 days with anti-P-S129-α-Syn. This antibody stains the human hippocampus of Parkinson’s disease brains but shows no staining in normal brains. Source numerical data is available in the Source Data Extended Data Fig. 6.
Figure 1
Figure 1. SVs and α-Syn form co-condensation.
(a) Images of protein-free SV mimics (SVMs; 1 mM) in the presence of both VAMP21−96 and α-Syn at a molar ratio of 10:1:1 at room temperature as well as in SVM+V21−96 or SVM+α-Syn conditions. CF-SVM:carboxyfluorescein-labeled SVM. DIC: differential interference contrast. The buffer is 10 mM HEPES-Na, pH 7.4, 5% (w/v) PEG3350, and 5 mM Zn2+. The size of SVM is ~50 nm in diameter (Extended Data Fig. 1a). (b) Fluorescence recovery after photobleaching (FRAP) for CF-SVM in the presence of both VAMP21−96 and α-Syn. The time to reach half-maxim (t1/2) is 47.2 sec by fitting a single-term exponential model. Upper: representative fluorescence images of one droplet at the indicated time points in six FRAP experiments. Data are means ± SD; error bars (black) represent the SD of six independent measurements. (c) Images of α-Syn (contain 1% α-Syn-Alexa488) with or without isolated synaptic vesicles (SVs) from mouse brains and (d) FRAP of the α-Syn droplets in the presence of SVs. The t1/2 is 15.6 sec. Data are means ± SD; error bars (black) represent the SD of six independent measurements. (e) Representative images of cortical neurons expressing GFP or α-Syn-GFP loaded with FM 4–64 dye (labeling endocytosed SVs) show puncta of α-Syn and SVs (n = 6 independent cultures for each condition). (f) FRAP of α-Syn-GFP and FM4–64 in a single bouton. Upper, representative pseudo-color images of a string of boutons were selected, and a single bouton (middle) was selectively photobleached and recovered for the indicated time. Bottom, average FRAP time course of α-Syn-GFP and FM4–64 in similar single boutons as in the upper images. Data are means ± SD; n = 5 independent measurements on the same bouton for the two fluorescent conditions. Source numerical data is available in the Source Data Fig. 1
Figure 2
Figure 2. The juxtamembrane region of VAMP2 interacts with the C-terminal region of α-Syn.
(a) Left, overlay of the 2D 1H-15N HSQC spectra of N15α-Syn alone (100 μM, black) and in the presence of soluble VAMP2 (blue); right, overlay of the 2D 1H-15N HSQC spectra of soluble N15VAMP2 alone (100 μM, black) and in the presence of α-Syn (red). The residues harboring significant chemical shift changes are magnified. The NMR buffer is 50 mM NaH2PO4 (pH 6.5) with 50 mM NaCl. (b) Residue-specific changes in the chemical shift of α-Syn signals upon VAMP2 titration (upper) and VAMP2 signals upon α-Syn titration (bottom). (c) Mapping of the interfaces between α-Syn and VAMP2. The C-terminal domain of α-Syn and the juxtamembrane region (amino acids 79–96) of VAMP2 are involved in the interaction between the molecules. The VAMP2 SNARE motif next to the juxtamembrane region also weakly interacts with α-Syn. (d) Left, diagram of cross-linked lysine (K)-pairs of α-Syn and soluble VAMP2 identified by Mass Spectrometry (MS). The black and white circles labeled on the protein domain represent cross-linked and unlinked lysine (K), respectively. Right, a representative MS2 of a cross-linked pair of α-Syn K97 and VAMP2 K91 corresponds to the grey line on the left. The molar ratio of α-Syn (50 μM), VAMP21−96, and PS liposome is 1:1:20, and the cross-linking buffer is 10 mM HEPEs-Na (pH 7.4). Source numerical data is available in the Source Data Fig. 2.
Figure 3
Figure 3. Disruption of the α-Syn–VAMP2 interface abolishes co-condensation.
(a) Images of 1 mM CF-SVM alone and in the presence of VAMP21−96 and α-Syn1−100 or VAMP21−78 and α-Syn. The molar ratio of SVM:VAMP2:α-Syn was =10:1:1. CF-SVM: carboxyfluorescein-labeled SVM. DIC: differential interference contrast. (b) Representative images of cortical neurons expressing α-Syn-GFP and α-Syn1−100-GFP (n = 6 independent cultures for each condition) loaded with FM 4–64 dye labeling endocytosed SVs. (c) Images of 1 mM CF-SVM vesicles alone and in the presence of soluble VAMP2 (V2) and α-SynWT, α-Syn5A (E105A, D119A, E126A, E130A, E137A) or α-Syn5K (E105K, D119K, E126K, E130K, E137K) mutants. The molar ratio of SVM:VAMP2:α-Syn was 10:1:1. (d) Representative pseudo-color snapshots of primary neurons expressing different α-Syn-GFP variants in FRAP assay (n = 8 random imaging locations). The green color represents the α-Syn-GFP variants, and the red color represents the FM 4–64 dye. (e) Representative FRAP experiment of a single bouton (in white boxes) of primary neurons with GFP-linked α-Syn variants. Data are means ± SD; error bars (black) represent the SD of eight independent measurements on the same bouton. Source numerical data is available in the Source Data Fig. 3.
Figure 4
Figure 4. Disruption of the α-Syn–VAMP2 interface impairs α-Syn function of SV trafficking.
(a) Numbers of interacting DiD-labeled protein-free SVMs on the imaging surface with various protein-to-lipid ratios. (b) Numbers of interacting DiD-labeled SVMs reconstituted with VAMP2 on the imaging surface with various protein-to-lipid ratios. (c) α-Syn1−100 and (d) α-Syn5A reduced clustering of DiD-labeled SVMs reconstituted with full-length VAMP2. (a-d) Bar graphs: Quantification of interacting vesicles; data are means ± SD; unpaired two-tailed t-test; n (left to right) = 8, 15, 20, 26 or 20 in (a), n (left to right) = 20, 12, 20, 20 or 16 for (b), n = 16 for (c), n = 20 for (d), respectively; n refers to the number of random imaging locations in the same sample channel. Effects of wild-type α-Syn and α-Syn1−100 (e,f) or α-Syn5K (g,h) on α-Syn mediated catalysis of SNARE-complex assembly measured via the SDS-resistance of SNARE complexes in transfected HEK293T cells (g) or α-Syn knockout neurons (h). HEK293T cells were co-transfected with constant amounts of syntaxin-1, VAMP2, and SNAP-25 and increasing amounts (0–3-fold) of wild-type α-Syn or α-Syn1−100 (e,f) along with decreasing amounts of emerald (3–0-fold, to balance total DNA amount), or 4-fold GFP, wild-type α-Syn or α-Syn5K (g). α-Syn knockout primary neurons were transfected with wild-type α-Syn or α-Syn5K (h). The expression level of individual SNARE proteins is shown in Extended Data Fig. 4a-b,c-d. SNARE complexes and α-Syn were quantified, normalized to control levels, and loading control α-tubulin (α-Tub) or heat shock cognate 71 kDa protein (Extended Data Fig. 4e) or β-tubulin-III (Extended Data Fig. 4f). SNARE-complexes were measured as high molecular mass bands immunoreactive for SNAP-25, which disappear upon boiling. Data are means ± SD; unpaired two-tailed t-test; n = 3 or 6 or 5 independent cultures for (f) or (g) or (h), respectively. Source numerical data and uncropped blots are available in the Source Data Fig. 4.
Figure 5
Figure 5. VAMP2 prevents α-Syn aggregation and cytotoxicity.
The ThT spectra (a) and EM images (b) show α-Syn amyloid aggregation in the presence of PS liposomes with or without VAMP21–96. The molar ratio of liposome:VAMP2:α-Syn is indicated. Scale bar: 200 nm. Data are means ± SD; error bars represent the SD of three independent replicates. (c) Western blot analysis (n = 3 independent replicates) of cross-linked α-Syn induced by PS liposomes reconstituted with decreasing concentrations of full-length VAMP2. The falling wedge represents molar ratios of 50 μM α-Syn to full-length VAMP2 (1:2, 1:1, 1:0.5, and 1:0). (d) Gel image of α-Syn levels in HEK293T cells with or without expressing VAMP21–96. The up-pointing arrow indicates the supernatant, whereas the down-pointing arrow designates the pellet containing intact cells. The NP-40 insoluble form of α-Syn was fractionated and quantified by western blot (n = 2 independent replicates). (e,f) HEK293T cell and primary neuron survival measurements with α-Syn and specified VAMP21−96 concentrations. Recombinant α-Syn and VAMP21−96 were added into cell culture media at the indicated ratios for cell viability measurements. Data are means ± SD; unpaired two-tailed t-test; n = 3 or 6 biologically independent replicates for (e) or (f), respectively. The ThT spectra (g) and EM images (h) show α-Syn amyloid aggregation in the presence of PS liposomes with VAMP21−96 or VAMP21–78. The molar ratio of protein and PS lipids is indicated. Scale bar: 500 nm. Data are means ± SD; error bars represent the SD of three independent replicates. (i) Schematics of VAMP2 chaperones α-Syn in co-condensates. In neurons, α-Syn exits in a dynamic equilibrium between cytosolic and membrane-bound states. Cytosolic α-Syn is intrinsically disordered, whereas membrane-bound α-Syn adopts α-helical conformations. The latter tends to form oligomers on the membrane, which could trigger α-Syn forming β-sheet-rich amyloid fibrils (bottom route). α-Syn can cluster SVs and assist in forming co-condensates, and this effect depends on the specific interaction between VAMP2 and α-Syn (top route). Notably, VAMP2 can reduce the size of membrane-induced α-Syn pathological oligomers, thereby preventing cytosolic α-Syn from forming amyloid aggregation. The schematics are created with BioRender.com. Source numerical data and uncropped blots are available in the Source Data Fig. 5.

References

    1. Burre J et al. Properties of native brain alpha-synuclein. Nature 498, E4–6; discussion E6–7 (2013). - PMC - PubMed
    1. Maroteaux L, Campanelli JT & Scheller RH Synuclein - a Neuron-Specific Protein Localized to the Nucleus and Presynaptic Nerve-Terminal. J Neurosci 8, 2804–2815 (1988). - PMC - PubMed
    1. Jensen PH, Nielsen MS, Jakes R, Dotti CG & Goedert M Binding of alpha-synuclein to brain vesicles is abolished by familial Parkinson’s disease mutation. J Biol Chem 273, 26292–26294 (1998). - PubMed
    1. Serpell LC, Berriman J, Jakes R, Goedert M & Crowther RA Fiber diffraction of synthetic alpha-synuclein filaments shows amyloid-like cross-beta conformation. Proc Natl Acad Sci U S A 97, 4897–4902 (2000). - PMC - PubMed
    1. Goedert M Alpha-synuclein and neurodegenerative diseases. Nat Rev Neurosci 2, 492–501 (2001). - PubMed

MeSH terms

Substances

LinkOut - more resources