. 2024 Aug;26(8):1296-1308.
doi: 10.1038/s41556-024-01451-6. Epub 2024 Jul 1.

VAMP2 regulates phase separation of α-synuclein

Affiliations

VAMP2 regulates phase separation of α-synuclein

Aishwarya Agarwal et al. Nat Cell Biol. 2024 Aug.

Abstract

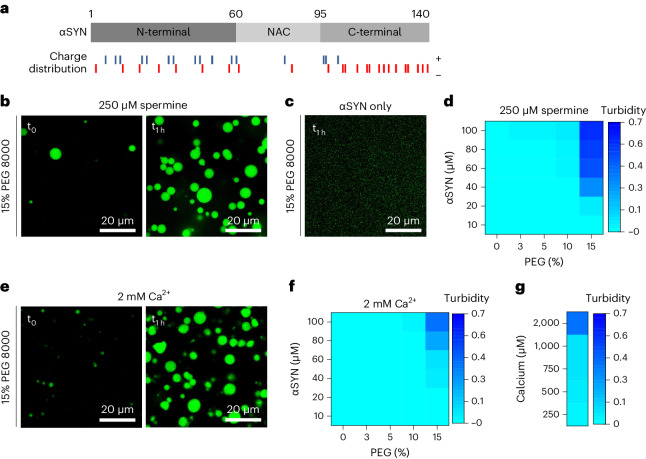
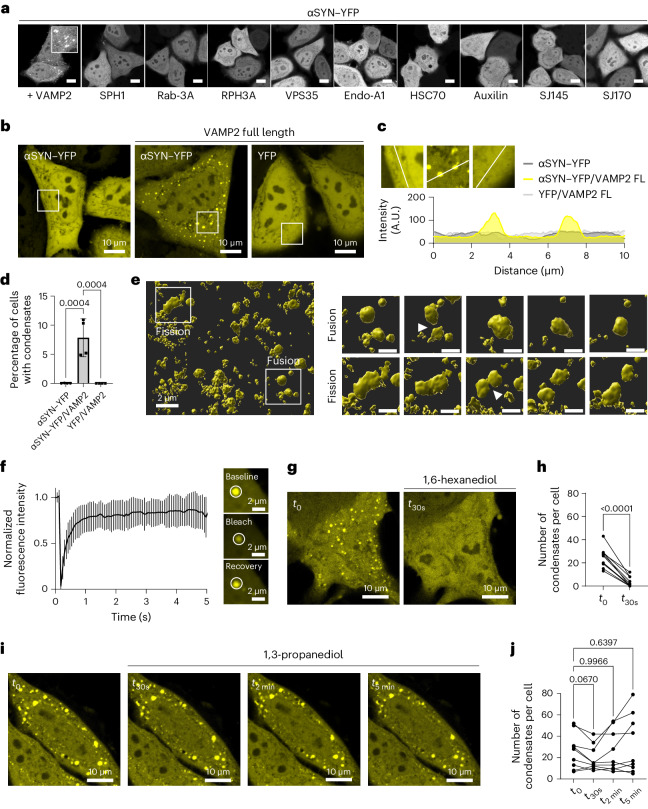
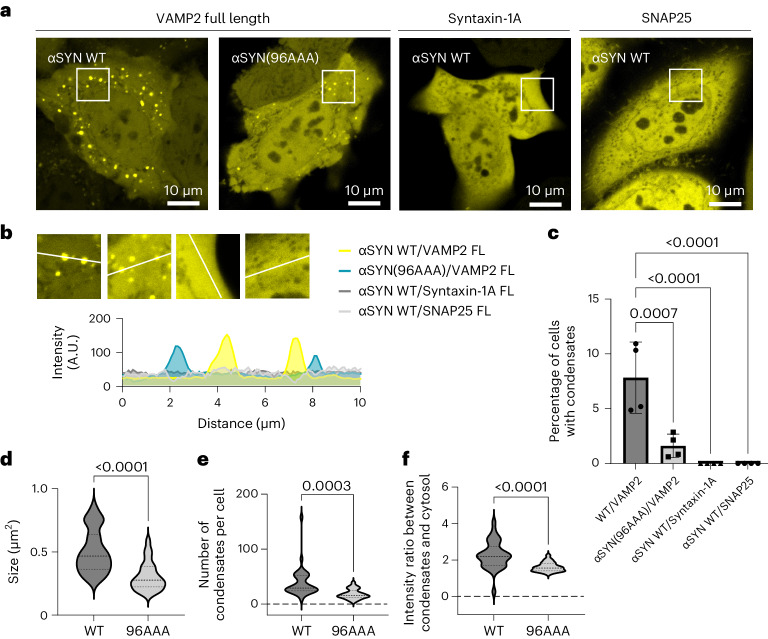
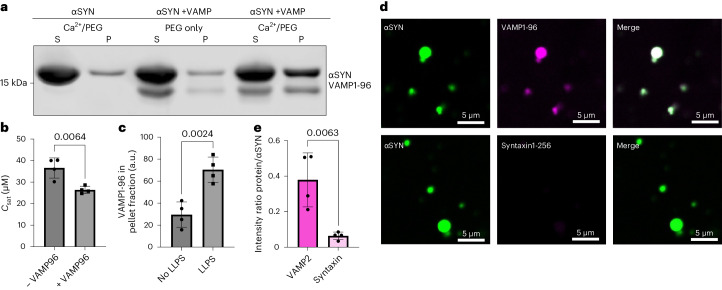
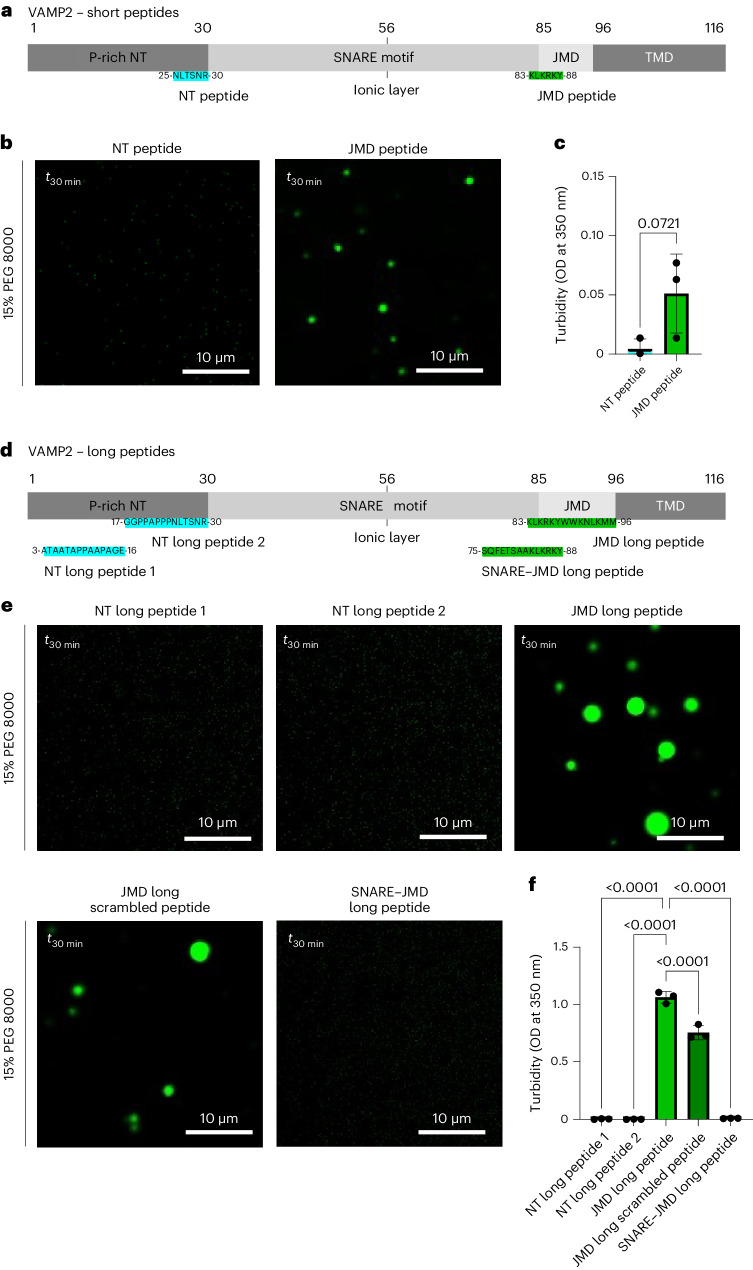
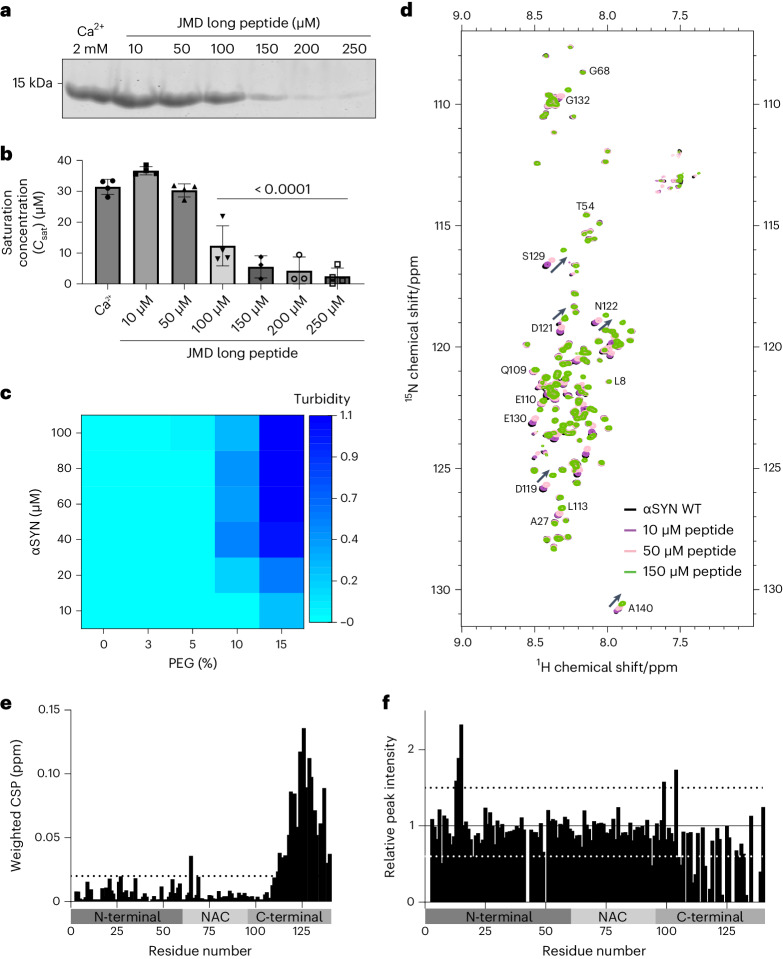
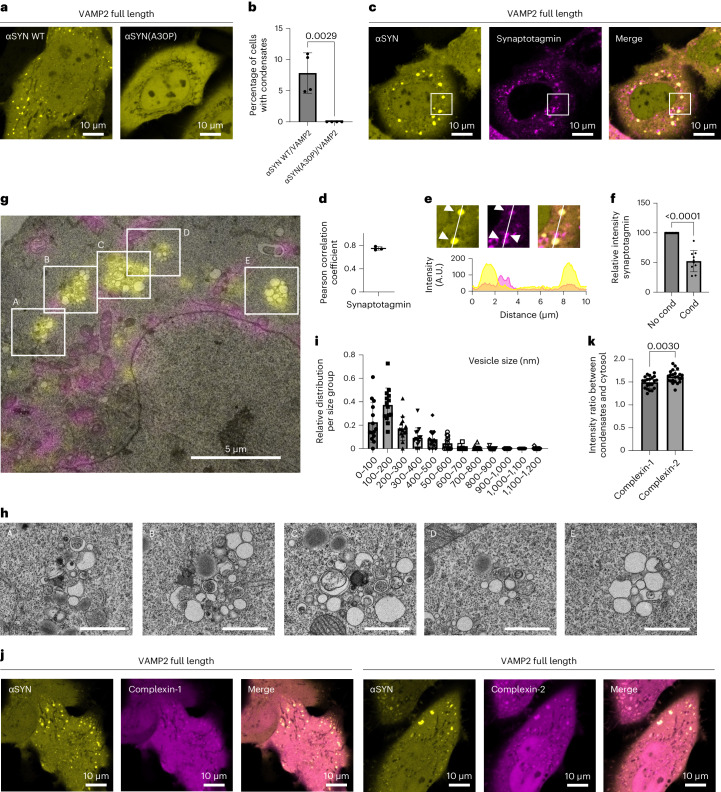
α-Synuclein (αSYN), a pivotal synaptic protein implicated in synucleinopathies such as Parkinson's disease and Lewy body dementia, undergoes protein phase separation. We reveal that vesicle-associated membrane protein 2 (VAMP2) orchestrates αSYN phase separation both in vitro and in cells. Electrostatic interactions, specifically mediated by VAMP2 via its juxtamembrane domain and the αSYN C-terminal region, drive phase separation. Condensate formation is specific for R-SNARE VAMP2 and dependent on αSYN lipid membrane binding. Our results delineate a regulatory mechanism for αSYN phase separation in cells. Furthermore, we show that αSYN condensates sequester vesicles and attract complexin-1 and -2, thus supporting a role in synaptic physiology and pathophysiology.


Conflict of interest statement

The authors declare no competing interests.

Figures

Fig. 1
Fig. 1. αSYN undergoes phase separation upon electrostatic interaction.
a, Schematic of αSYN showing its three main protein regions, the N-terminal lipid binding region, the NAC region and the negatively charged C terminus. Charge distribution along αSYN sequence; blue indicates positively charged residues and red indicates negatively charged residues. b, αSYN phase separation in the presence of 250 µM spermine and crowding with 15% PEG 8000, immediately after PEG addition (t0) and after 1 h (t1h). αSYN was used at 100 µM. c, αSYN on its own does not show droplet formation in the presence of 15% PEG 8000. αSYN was used at 100 µM. d, Heatmap showing turbidity measurements of αSYN phase separation in the presence of 250 µM spermine. Data represent three biological repeats. e, αSYN phase separation in the presence of 2 mM Ca2+ and crowding with 15% PEG 8000, immediately after PEG addition (t0) and after 1 h (t1h). αSYN was used at 100 µM. f, Heatmap showing turbidity measurements of αSYN phase separation in the presence of 2 mM Ca2+. Data represent three biological repeats. g, Heatmap for αSYN phase separation in the presence of different Ca2+ concentrations in the presence of 15% PEG 8000. αSYN was used 100 µM. Data represent three biological repeats. Source data
Fig. 2
Fig. 2. VAMP2 enables αSYN condensate formation in cells.
a, Screening of disease-relevant synaptic proteins on αSYN–YFP distribution upon co-expression in HeLa cells. Scale bar, 20 µm. SPH1, synphilin-1; Rab-3A, Ras-related protein Rab-3A; RPH3A, rabphilin-3A; VPS35, vacuolar protein sorting-associated protein 35; Endo-A1, endophilin-A1; HSC70, heat shock cognate 71 kDa protein; auxilin, putative tyrosine-protein phosphatase auxilin; SJ145 and SJ170, synaptojanin-1 isoforms 1-145 and 1-170. b, Cytosolic–nuclear distribution of αSYN–YFP upon ectopic expression in HeLa cells, condensate formation upon co-expression of αSYN–YFP and VAMP2, co-expression of YFP and VAMP2 shows no condensate formation. c, Zoomed-in regions and fluorescence intensity distribution for cells with αSYN–YFP only, αSYN with VAMP2 and YFP with VAMP2. FL, full-length. d, Quantification of cells forming condensates. Data are derived from Incucyte screening, with 16 images per well, three wells per biological repeat and four biological repeats. n indicates biological repeats. Data are mean ± s.d. One-way ANOVA with Dunnett’s multiple comparison test. e, αSYN–YFP condensates show fluid-like behaviour. Zoomed-in region showing individual fusion event and fission event. Scale bar, 1 µm. See also Supplementary Videos 1–4 and Extended Data Fig. 2. f, Photobleaching and recovery of αSYN condensate in cells. Quantification of FRAP experiments. Data are mean ± s.d. with four biological repeats, n = 22, n represents individual FRAP experiments. g, αSYN–YFP condensates show dispersal upon incubation with 3% 1,6-hexanediol. See also Extended Data Fig. 3 for recovery of αSYN condensates after 1,6-hexanediol washout. h, Quantification of staining in g before and after incubation with 3% 1,6-hexanediol. n = 11 cells, pooled from three biological repeats. The same cells were followed over 30 s. Paired two-tailed t-test. i, αSYN–YFP condensates are still present after incubation with 3% 1,3-propanediol. j, Quantification of staining in i before and after incubation with 3% 1,3-propanediol. n = 9 cells, pooled from three biological repeats. The same cells were followed over 30 s, 2 min and 5 min. Repeated measures one-way ANOVA with Dunnett’s multiple comparison test. Source data
Fig. 3
Fig. 3. αSYN–VAMP2 interaction regulates αSYN condensate formation.
a, Condensate formation for wild-type (WT) αSYN–YFP and αSYN(96AAA)–YFP upon co-expression with VAMP2. Wild-type αSYN–YFP co-expressed with syntaxin-1A or SNAP25 does not show condensate formation. b, Zoomed-in regions and fluorescence intensity distribution for cells with co-expression of wild-type αSYN–YFP with VAMP2 (yellow), αSYN(96AAA)–YFP with VAMP2 (turquoise), and wild-type αSYN–YFP with syntaxin-1A (dark grey) and SNAP25 (light grey). c, Quantification of cells forming condensates. Data are derived from Incucyte screening, with 16 images per well, three wells per biological repeat and four biological repeats; n indicates biological repeats. Data are mean ± s.d. One-way ANOVA with Dunnett’s multiple comparison test. d, Quantification of condensate size for cells co-expressing wild-type αSYN–YFP and αSYN(96AAA)–YFP with VAMP2. Data are represented as violin plots, n = 33 and 26 cells for WT and 96AAA, respectively, pooled from three biological repeats. Unpaired two-tailed t-test. e, Quantification of condensates per cell for cells co-expressing wild-type αSYN–YFP and αSYN(96AAA)–YFP with VAMP2. mData are represented as violin plots, n = 33 and 26 cells for WT and 96AAA, respectively, pooled from three biological repeats. Unpaired two-tailed t-test. f, Quantification of the intensity ratio between condensates and cytosolic αSYN–YFP for cells co-expressing wild-type αSYN–YFP and αSYN(96AAA)–YFP with VAMP2. Data are represented as violin plots., n = 33 and 26 cells for WT and 96AAA, respectively, pooled from three biological repeats. Unpaired two-tailed t-test. Source data
Fig. 4
Fig. 4. VAMP1-96 promotes αSYN phase separation in vitro.
a, Sedimentation-based assay showing supernatant (S, dilute phase) and pellet (P, droplet phase) fraction upon αSYN phase separation in the presence of Ca2+ (concentrations used: 40 µM αSYN, 2 mM Ca2+, 15% PEG 8000), upon αSYN and VAMP1-96 incubation (40 µM αSYN, no Ca2+, 10 µM VAMP1-96, 15% PEG 8000) and αSYN phase separation in the presence of VAMP1-96 (40 µM αSYN, 2 mM Ca2+, 10 µM VAMP1-96, 15% PEG 8000). b, Quantification of saturation concentration (Csat) of αSYN phase separation in the presence of 2 mM Ca2+ (–VAMP) and 2 mM Ca2+ with 10 µM VAMP1-96 (+VAMP). Data derived from four biological repeats; n indicates biological repeats. Data are mean ± s.d. Unpaired two-tailed t-test. c, Quantification for the intensity of VAMP1-96 in the pellet fraction, either under no phase separation (40 µM αSYN, no Ca2+, 10 µM VAMP1-96, 15% PEG) or under αSYN phase separation conditions in the presence of Ca2+ (40 µM αSYN, 2 mM Ca2+, 10 µM VAMP1-96, 15% PEG). Data derived from four biological repeats; n indicates biological repeats. Data are mean ± s.d. Unpaired two-tailed t-test. d, Co-localization of VAMP1-96 or syntaxin1-265 with αSYN droplets induced in the presence of 2 mM Ca2 and 15% PEG 8000. Co-localization was evaluated 30 min after induction of αSYN phase separation and addition of the respective labelled protein. αSYN was used at 100 µM. e, Quantification of co-localization showing intensity ratio of VAMP1-96 and syntaxin1-265 to αSYN after 30 min. Data derived from four biological repeats; n indicates biological repeats. Data are mean ± s.d. Unpaired two-tailed t-test. Source data
Fig. 5
Fig. 5. The JM domain of VAMP2 enables αSYN phase separation.
a, Schematic of VAMP2 with the respective NT peptide and JMD peptide. b, Evaluation of αSYN phase separation in the presence of 150 µM peptide and crowding with 15% PEG 8000, 30 min after PEG addition (t30 min), 40 µM αSYN. c, Quantification of turbidity measurements at t30 min. Data are mean ± s.d. from three biological repeats; n indicates biological repeats. Unpaired two-tailed t-test. d, Schematic of VAMP2 with the respective N-terminal long peptides (NT long peptide 1 and 2), the native JMD long peptide and the SNARE–JMD long peptide. e, Evaluation of αSYN phase separation in the presence of 150 µM peptide and crowding with 15% PEG 8000, 30 min after PEG addition (t30 min), 40 µM αSYN. f, Quantification of turbidity measurements at t30 min. Data are mean ± s.d. from three biological repeats; n indicates biological repeats. One-way ANOVA with Dunnett’s multiple comparison test. Source data
Fig. 6
Fig. 6. The JM domain of VAMP2 interacts with αSYN.
a, Sedimentation-based assay showing supernatant (dilute phase) upon αSYN phase separation in the presence of the JMD long peptide (40 µM αSYN, 15% PEG 8000, concentrations of peptide as indicated). b, Quantification of Csat of αSYN phase separation in the presence of the JMD long peptide. Data are mean ± s.d., n represents three biological repeats for 150 µM and 200 µM peptide and four biological repeats for all other conditions. One-way ANOVA with Dunnett’s multiple comparison test. c, Heatmap showing turbidity measurements of αSYN phase separation in the presence of 150 µM JMD long peptide. Data represent three biological repeats. See also Extended Data Fig. 4 for αSYN droplet formation in the presence of 150 µM JMD long peptide at lower PEG concentrations. d, Overlapped 1H-15N-BEST-TROSY spectra of αSYN without (black) and in the presence of increasing concentrations of JMD long peptide as indicated. Also see Extended Data Fig. 5a for the 1H-15N-BEST-TROSY spectra of αSYN in the presence of NT long peptide 1. αSYN concentration was 40 µM and peptide concentrations were 10 µM, 50 µM and 150 µM. e, Weighted average (of 15N and 1H) chemical shift perturbation (Δδ = √(δH2 + 0.2 (δ15N)2)) of residues in αSYN in the presence of 150 µM JMD long peptide. Also see Extended Data Fig. 5b weighted average (of 15N and 1H) chemical shift perturbation in the presence of NT long peptide 1. Dashed line indicates weighted CSP of 0.02 ppm. f, Relative peak intensities of αSYN residues in the presence of 150 µM JMD long peptide. Also see Extended Data Fig. 5c for relative peak intensities of αSYN residues in the presence of NT long peptide 1. The black dashed line indicates a relative peak intensity of 1.5 and the white dashed line indicates a relative peak intensity of 0.6. Source data
Fig. 7
Fig. 7. αSYN condensate formation is dependent on αSYN lipid membrane binding and attracts vesicles and protein partners.
a, Co-expression of VAMP2 and wild-type αSYN–YFP in HeLa cells showing condensate formation. Cells co-expressing VAMP2 and αSYN(A30P)–YFP lack condensate formation. b, Quantification of cells forming condensates. Data are derived from Incucyte screening, with 16 images per well, three wells per biological repeat and four biological repeats. n indicates biological repeats. Data are mean ± s.d. One-way ANOVA with Dunnett’s multiple comparison test. c, Co-expression of αSYN–YFP, VAMP2 and mScarlet synaptotagmin showing partial co-localization of mScarlet synaptotagmin with αSYN–YFP condensates. d, Quantification of Pearson correlation coefficient for αSYN–YFP and mScarlet synaptotagmin co-localization. Three biological repeats were conducted; n indicates biological repeats. Data are mean ± s.d. Unpaired two-tailed t-test. e, Zoomed-in areas highlighting co-localization of αSYN condensates with co-expressed mScarlet synaptotagmin and mScarlet synaptotagmin outside αSYN condensates. Fluorescence intensity distribution for αSYN–YFP (yellow) and mScarlet synaptotagmin (magenta). f, Quantification of mScarlet synaptotagmin intensity outside and within αSYN condensates. n = 10 cells, pooled from four biological repeats. Data are mean ± s.d. Unpaired two-tailed t-test. g, HeLa cells with ectopic expression of αSYN–YFP, VAMP2 and 4xMTS-mScarlet, electron microscopy image overlaid with fluorescence microscopy, showing assemblies of vesicles colocalizing with αSYN–YFP condensates. Also see Extended Data Fig. 6 for individual images. h, Electron microscopy images for individual vesicle clusters in Fig. 7g. Scale bar, 1 µm. i, Histogram showing size distribution of vesicles contained within αSYN condensates. Data are mean ± s.d. n = 14 vesicle clusters pooled from two cells from two biological repeats. j, Co-expression of αSYN–YFP, VAMP2 and complexin-1/2 mScarlet demonstrating enrichment of complexins within αSYN–YFP condensates. k, Quantification of complexin in αSYN condensates versus cytosolic complexin levels. Complexin-2 levels were significantly higher than complexin-1. n = 21 and 23 cells for complexin-1 and complexin-2, respectively, pooled from three biological repeats. Data are mean ± s.d. Unpaired two-tailed t-test. Source data
Extended Data Fig. 1
Extended Data Fig. 1. αSYN YFP / VAMP2 co-expression.
a) Cells expressing aSYN YFP also show expression of VAMP2 as revealed upon immunocytochemistry. b) Quantification of aSYN YFP expressing cells and cells expressing aSYN YFP and immunostained for VAMP2-Flag shows that between 97 to 100% of aSYN YFP cells show VAMP2 co-expression. n = 22 images, pooled from 3 biological repeats. Data are represented as mean ± s.d.. Source data
Extended Data Fig. 2
Extended Data Fig. 2. Non-rendered images of aSYN condensate fusion and fission.
Non-rendered image showing aSYN YFP condensates displayed in Fig. 2e (full frame, left image). Right panels showing zoom in and time frames for aSYN YFP condensate fusion (upper panel) and aSYN YFP condensate fission (lower panel). This experiment has been repeated independently two times with similar results. Scale bars in zoom in images indicates 1 µm.
Extended Data Fig. 3
Extended Data Fig. 3. Sensitivity of alpha-synuclein condensates to 1,6-hexanediol.
aSYN YFP condensates show dispersal upon incubation with 3% 1,6-hexanediol with fast recovery after 1,6-hexanediol washout. This experiment has been repeated independently three times with similar results.
Extended Data Fig. 4
Extended Data Fig. 4. aSYN condensate formation at lower PEG concentrations.
Evaluation of aSYN phase separation in the presence of 150 µM peptide and crowding with 10%, 5%, 3% and 0% PEG 8000 respectively. 30 min after PEG addition (t30min), 40 µM aSYN. This experiment has been repeated independently twice with similar results.
Extended Data Fig. 5
Extended Data Fig. 5. 1H-15N-BEST-TROSY spectra of aSYN in the presence of NT long peptide 1.
a) Overlapped 1H-15N-BEST-TROSY spectra of aSYN without (black) and in the presence (turquoise) of NT long peptide 1. aSYN concentration used: 40 µM, peptide concentration: 500 µM. b) Weighted average (of 15N and 1H) chemical shift perturbation (Δδ = √(δH2 + 0.2 (δ15N)2)) of residues in aSYN in the presence of 500 µM NT long peptide 1. Dashed line indicates Weighted CSP of 0.02 ppm. c) Relative peak intensities of aSYN residues in the presence of 500 µM NT long peptide 1. Black dashed line indicates Relative Peak Intensity of 1.5. Source data
Extended Data Fig. 6
Extended Data Fig. 6. Correlative Light and Electron Microscopy (CLEM), Supplement for Fig. 7g.
Light microscopy and electron microscopy overlay, original electron microscopy and light microscopy image side by side. This experiment has been repeated independently twice with similar results.

References

    1. Boeynaems, S. et al. Protein phase separation: a new phase in cell biology. Trends Cell Biol.28, 420–435 (2018). 10.1016/j.tcb.2018.02.004 - DOI - PMC - PubMed
    1. Banani, S. F., Lee, H. O., Hyman, A. A. & Rosen, M. K. Biomolecular condensates: organizers of cellular biochemistry. Nat. Rev. Mol. Cell Biol.18, 285–298 (2017). 10.1038/nrm.2017.7 - DOI - PMC - PubMed
    1. Alberti, S., Gladfelter, A. & Mittag, T. Considerations and challenges in studying liquid-liquid phase separation and biomolecular condensates. Cell176, 419–434 (2019). 10.1016/j.cell.2018.12.035 - DOI - PMC - PubMed
    1. Brangwynne, C. P., Tompa, P. & Pappu, R. V. Polymer physics of intracellular phase transitions. Nat. Phys.11, 899–904 (2015). 10.1038/nphys3532 - DOI
    1. Alberti, S. & Hyman, A. A. Biomolecular condensates at the nexus of cellular stress, protein aggregation disease and ageing. Nat. Rev. Mol. Cell Biol.22, 196–213 (2021). 10.1038/s41580-020-00326-6 - DOI - PubMed

Publication types

MeSH terms

LinkOut - more resources