. 2024 Jun 30;14(7):e11651.
doi: 10.1002/ece3.11651. eCollection 2024 Jul.

Variations of floral temperature in changing weather conditions

Affiliations

Variations of floral temperature in changing weather conditions

Michael J M Harrap et al. Ecol Evol. .

Abstract

Floral temperature is a flower characteristic that has the potential to impact the fitness of flowering plants and their pollinators. Likewise, the presence of floral temperature patterns, areas of contrasting temperature across the flower, can have similar impacts on the fitness of both mutualists. It is currently poorly understood how floral temperature changes under the influence of different weather conditions, and how floral traits may moderate these changes. The way that floral temperature changes with weather conditions will impact how stable floral temperatures are over time and their utility to plants and pollinators. The stability of floral temperature cues is likely to facilitate effective plant-pollinator interactions and play a role in the plant's reproductive success. We use thermal imaging to monitor how floral temperatures and temperature patterns of four plant species (Cistus 'snow fire' and 'snow white', Coreopsis verticillata and Geranium psilostemon) change with several weather variables (illumination, temperature; windspeed; cloud cover; humidity and pressure) during times that pollinators are active. All weather variables influenced floral temperature in one or more species. The directionality of these relationships was similar across species. In all species, light conditions (illumination) had the greatest influence on floral temperatures overall. Floral temperature and the extent to which flowers showed contrasting temperature patterns were influenced predominantly by light conditions. However, several weather variables had additional, lesser, influences. Furthermore, differences in floral traits, pigmentation and structure, likely resulted in differences in temperature responses to given conditions between species and different parts of the same flower. However, floral temperatures and contrasting temperature patterns that are sufficiently elevated for detection by pollinators were maintained across most conditions if flowers received moderate illumination. This suggests the presence of elevated floral temperature and contrasting temperature patterns are fairly constant and may have potential to influence plant-pollinator interactions across weather conditions.

Keywords: angiosperms; floral Signalling; floral display; floral temperature; infrared thermography; pollinators; weather effects.


Conflict of interest statement

The authors declare no conflicts of interest.

Figures

FIGURE 1
FIGURE 1
The four species surveyed within the study viewed under human‐visible (a, c, e, g) light and UV light (b, d, f, h): (a) and (b) Cistus ‘snow fire’; (c) and (d) Cistus ‘snow white’; (e) and (f) Coreopsis verticillata; (g) and (h) Geranium psilostemon. UV images were collected using a Nikon D90 with all internal light filter components removed, and a UV permeable lens (UV‐MACRO‐APO 108012, Coastal Optics) with a filter transmissive to only light of wavelengths 320–380 nm (U‐Venus‐Filter, Baader) fitted externally to the camera. UV images are captured under daylight conditions with approximately a 6‐s exposure to compensate for the relatively low UV light illumination of daylight conditions. UV images are recoloured to black and white for ease of interpretation (the camera as described assigns a colour, normally red, to the UV signals inappropriately, thus only the brightness in these images is appropriate). White areas indicate areas that are UV reflective.
FIGURE 2
FIGURE 2
Example thermal images of (a–c) Cistus ‘snow fire’, (d–f) Cistus ‘snow white’, (g–i) Coreopsis verticillata and (j–l) Geranium psilostemon. Human colour images captured by the thermal camera (a, d, g, j) are provided for reference (not this camera cannot have focus or exposure adjusted). Thermal images are provided as captured (b, e, h, k) for each species. Temperature is given by the colour scale to the right of thermal images in degrees Celsius. Lastly, the floral temperature measurement points corresponding to one petal are given as a screen capture from FLIR tools (c, f, i, l). FLIR tools measurement superimposed with black or white rings that contrast with thermal image colouration for heightened clarity. Numerals on screen capture indicate the position of thermal measurement on the flower: i. Reproductive structures, ii. Petal base, iii. Petal middle, and iv. Petal tip. Specific thermograph details and environmental conditions of thermographs are discussed in Supplementary Material S1 in Data S1.
FIGURE 3
FIGURE 3
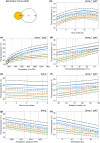
The effects of weather conditions on the floral temperature of Cistus ‘snow fire’ according to our best model of floral temperature. The influence of changes in (b) hour of the day, (c) illumination at the time of imaging, (d) hourly environmental temperature (e) hourly cloud cover (f) hourly relative humidity (g) hourly atmospheric pressure, and (h) hourly wind speed, is shown for mean conditions (from across all the sampling period) for all other weather variables and during the 13th hour of the day (13:00, true mean hour across sampling was 12:46). Line colour indicates the location on the flower: ‘black’, the reproductive structures; ‘blue’ the petal base; ‘orange’ the petal middle; ‘green’ the petal tip. These locations are indicated by crosses of the same colour on the diagram of the species' petal and reproductive structures in panel (a). The mean temperature of each flower location as described by the best model is indicated by bold solid lines, and ±0.5 SEM by long‐dash lines. Vertical dotted lines indicate (from left to right) the first quartile, mean and third quartile conditions for each weather variable across the whole of the sampling (hour 13 is taken for the mean hour of the day, see above). Note first quartile cloud cover is 0 oktas, this line is offset this position slightly to be made visible. Conditions at the middle, mean, and vertical line are the same across all panels. ‘temp.*’ and ‘patt.*’ in panel corners indicate the corresponding variable influences absolute floral temperature (temp*) and the contrast of the temperature pattern (*patt), respectively according to our best‐fitting model.
FIGURE 4
FIGURE 4
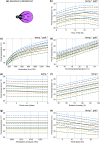
The effects of weather conditions on the floral temperature of Cistus ‘snow white’ according to our best model of floral temperature. The schematic diagram sketched in (a) gives the locations of the four measurements taken. The influence of changes in (b) hour of the day, (c) illumination at the time of imaging, (d) hourly environmental temperature (e) hourly cloud cover (f) hourly relative humidity (g) hourly atmospheric pressure, and (h) hourly wind speed, is shown for mean conditions (from across all the sampling periods) for all other weather variables and during the 13th hour of the day (13:00, true mean hour across sampling was 12:46). Details otherwise as in Figure 3.
FIGURE 5
FIGURE 5
The effects of weather conditions on the floral temperature of Coreopsis verticillata according to our best model of floral temperature. The schematic diagram sketched in (a) gives the location of the four measurements taken. The influence of changes in (b) hour of the day, (c) illumination at the time of imaging, (d) hourly environmental temperature (e) hourly cloud cover (f) hourly relative humidity (g) hourly atmospheric pressure, and (h) hourly wind speed, is shown for mean conditions (from across all of the sampling periods) for all other weather variables and during the 13th hour of the day (13:00, true mean hour across sampling was 12:46). Details otherwise as in Figure 3.
FIGURE 6
FIGURE 6
The effects of weather conditions on the floral temperature of Geranium psilostemon according to our best model of floral temperature. The schematic diagram sketched in (a) gives the locations of the four measurements taken. The influence of changes in (b) hour of the day, (c) illumination at the time of imaging, (d) hourly environmental temperature, (e) hourly cloud cover, (f) hourly relative humidity, (g) hourly atmospheric pressure, and (h) hourly wind speed, is shown for mean conditions (from across all of the sampling periods) for all other weather variables and during the 13th hour of the day (13:00, true mean hour across sampling was 12:46). Details otherwise as in Figure 3.

References

    1. Altner, H. , & Loftus, R. (1985). Ultrastructure and function of insect thermo‐and hygroreceptors. Annual Review of Entomology, 30, 273–295. 10.1146/annurev.en.30.010185.001421 - DOI
    1. Angioy, A.‐M. , Stensmyr, M. C. , Urru, I. , Puliafito, M. , Collu, I. , & Hansson, B. S. (2004). Function of the heater: The dead horse arum revisited. Proceedings of the Royal Society B, 271, S13–S15. 10.1098/rsbl.2003.0111 - DOI - PMC - PubMed
    1. Ashman, T.‐L. , Knight, T. M. , Steets, J. A. , Amarasekare, P. , Burd, M. , Campbell, D. R. , Dudash, M. R. , Johnston, M. O. , Mazer, S. J. , Mitchell, R. J. , Morgan, M. T. , & Wilson, W. G. (2004). Pollen limitation of plant reproduction: Ecological and evolutionary causes and consequences. Ecology, 85, 2408–2421. 10.1890/03-8024 - DOI
    1. Atamian, H. S. , Creux, N. M. , Brown, E. A. , Garner, A. G. , Blackman, B. K. , & Harmer, S. L. (2016). Circadian regulation of sunflower heliotropism, floral orientation, and pollinator visits. Science, 353, 587–590. 10.1126/science.aaf9793 - DOI - PubMed
    1. Bates, D. , Mächler, M. , Bolker, B. , & Walker, S. (2015). Fitting linear mixed‐effects models using lme4 . Journal of Statistical Software, 67, 1–48. 10.18637/jss.v067.i01 - DOI

LinkOut - more resources