Multicenter Study
. 2024 Aug;17(4):e004569.
doi: 10.1161/CIRCGEN.124.004569. Epub 2024 Jul 2.

Multisite Validation of a Functional Assay to Adjudicate SCN5A Brugada Syndrome-Associated Variants

Affiliations
Multicenter Study

Multisite Validation of a Functional Assay to Adjudicate SCN5A Brugada Syndrome-Associated Variants

Joanne G Ma et al. Circ Genom Precis Med. 2024 Aug.

Abstract

Background: Brugada syndrome is an inheritable arrhythmia condition that is associated with rare, loss-of-function variants in SCN5A. Interpreting the pathogenicity of SCN5A missense variants is challenging, and ≈79% of SCN5A missense variants in ClinVar are currently classified as variants of uncertain significance. Automated patch clamp technology enables high-throughput functional studies of ion channel variants and can provide evidence for variant reclassification.

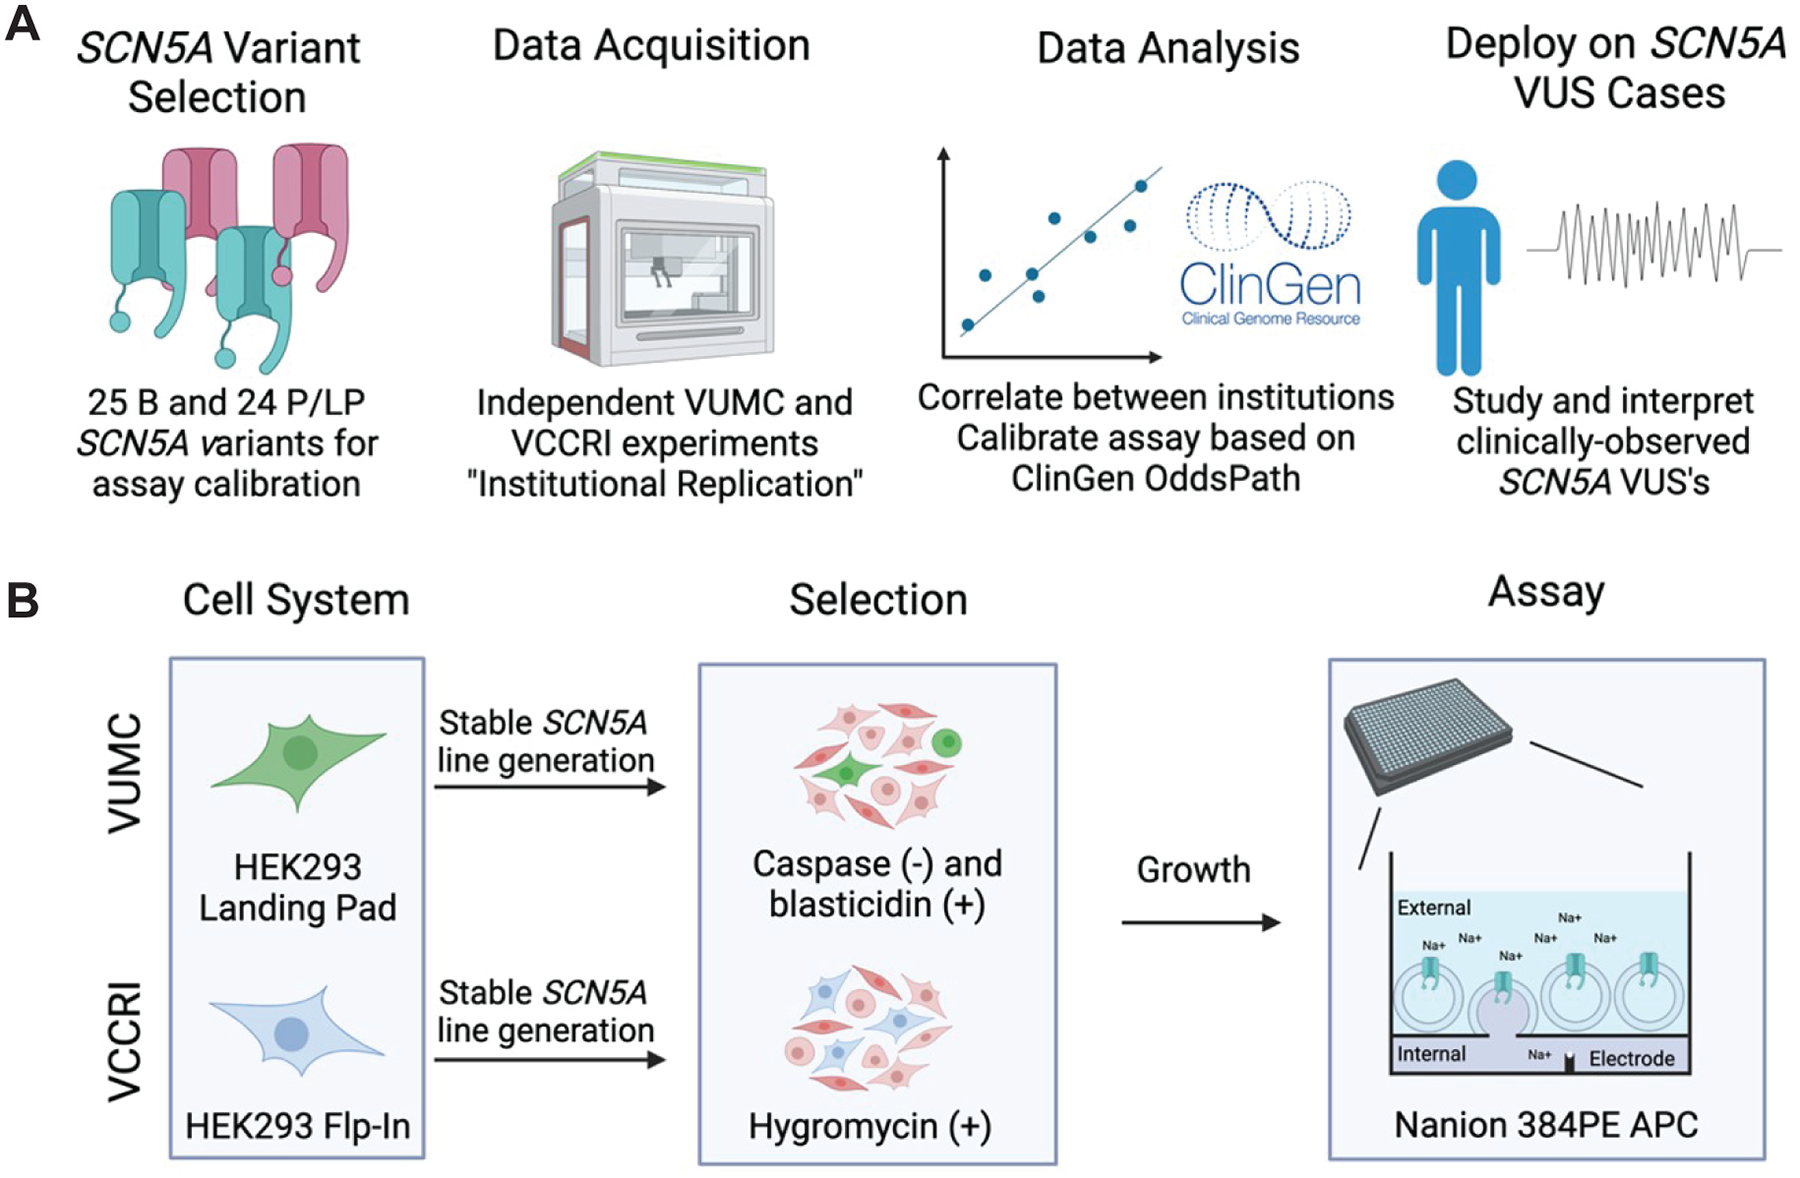
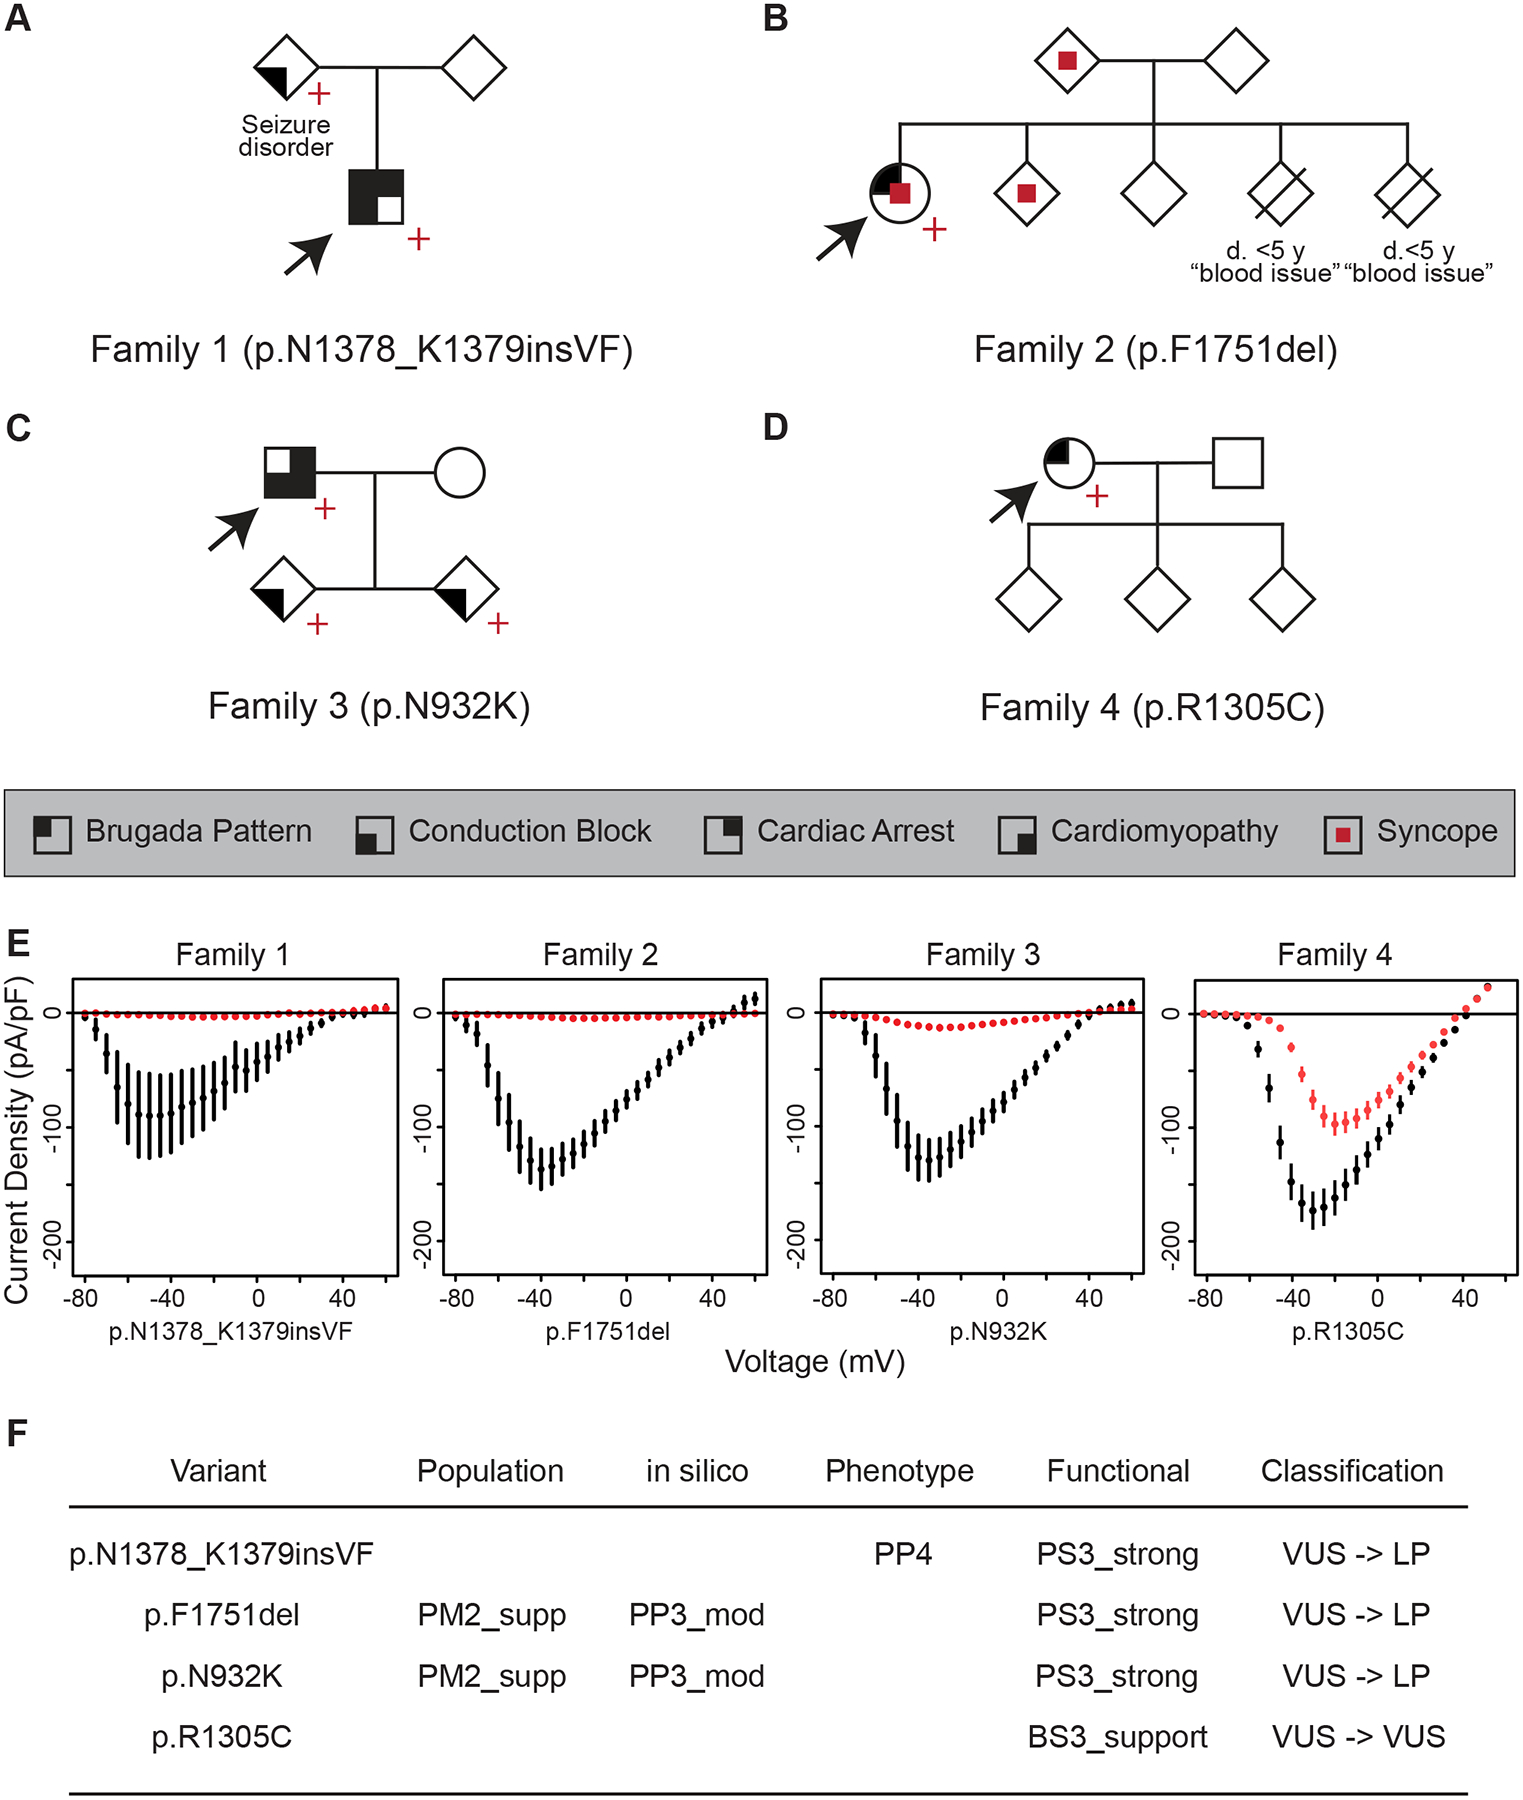
Methods: An in vitro SCN5A-Brugada syndrome automated patch clamp assay was independently performed at Vanderbilt University Medical Center and Victor Chang Cardiac Research Institute. The assay was calibrated according to ClinGen Sequence Variant Interpretation recommendations using high-confidence variant controls (n=49). Normal and abnormal ranges of function were established based on the distribution of benign variant assay results. Odds of pathogenicity values were derived from the experimental results according to ClinGen Sequence Variant Interpretation recommendations. The calibrated assay was then used to study SCN5A variants of uncertain significance observed in 4 families with Brugada syndrome and other arrhythmia phenotypes associated with SCN5A loss-of-function.

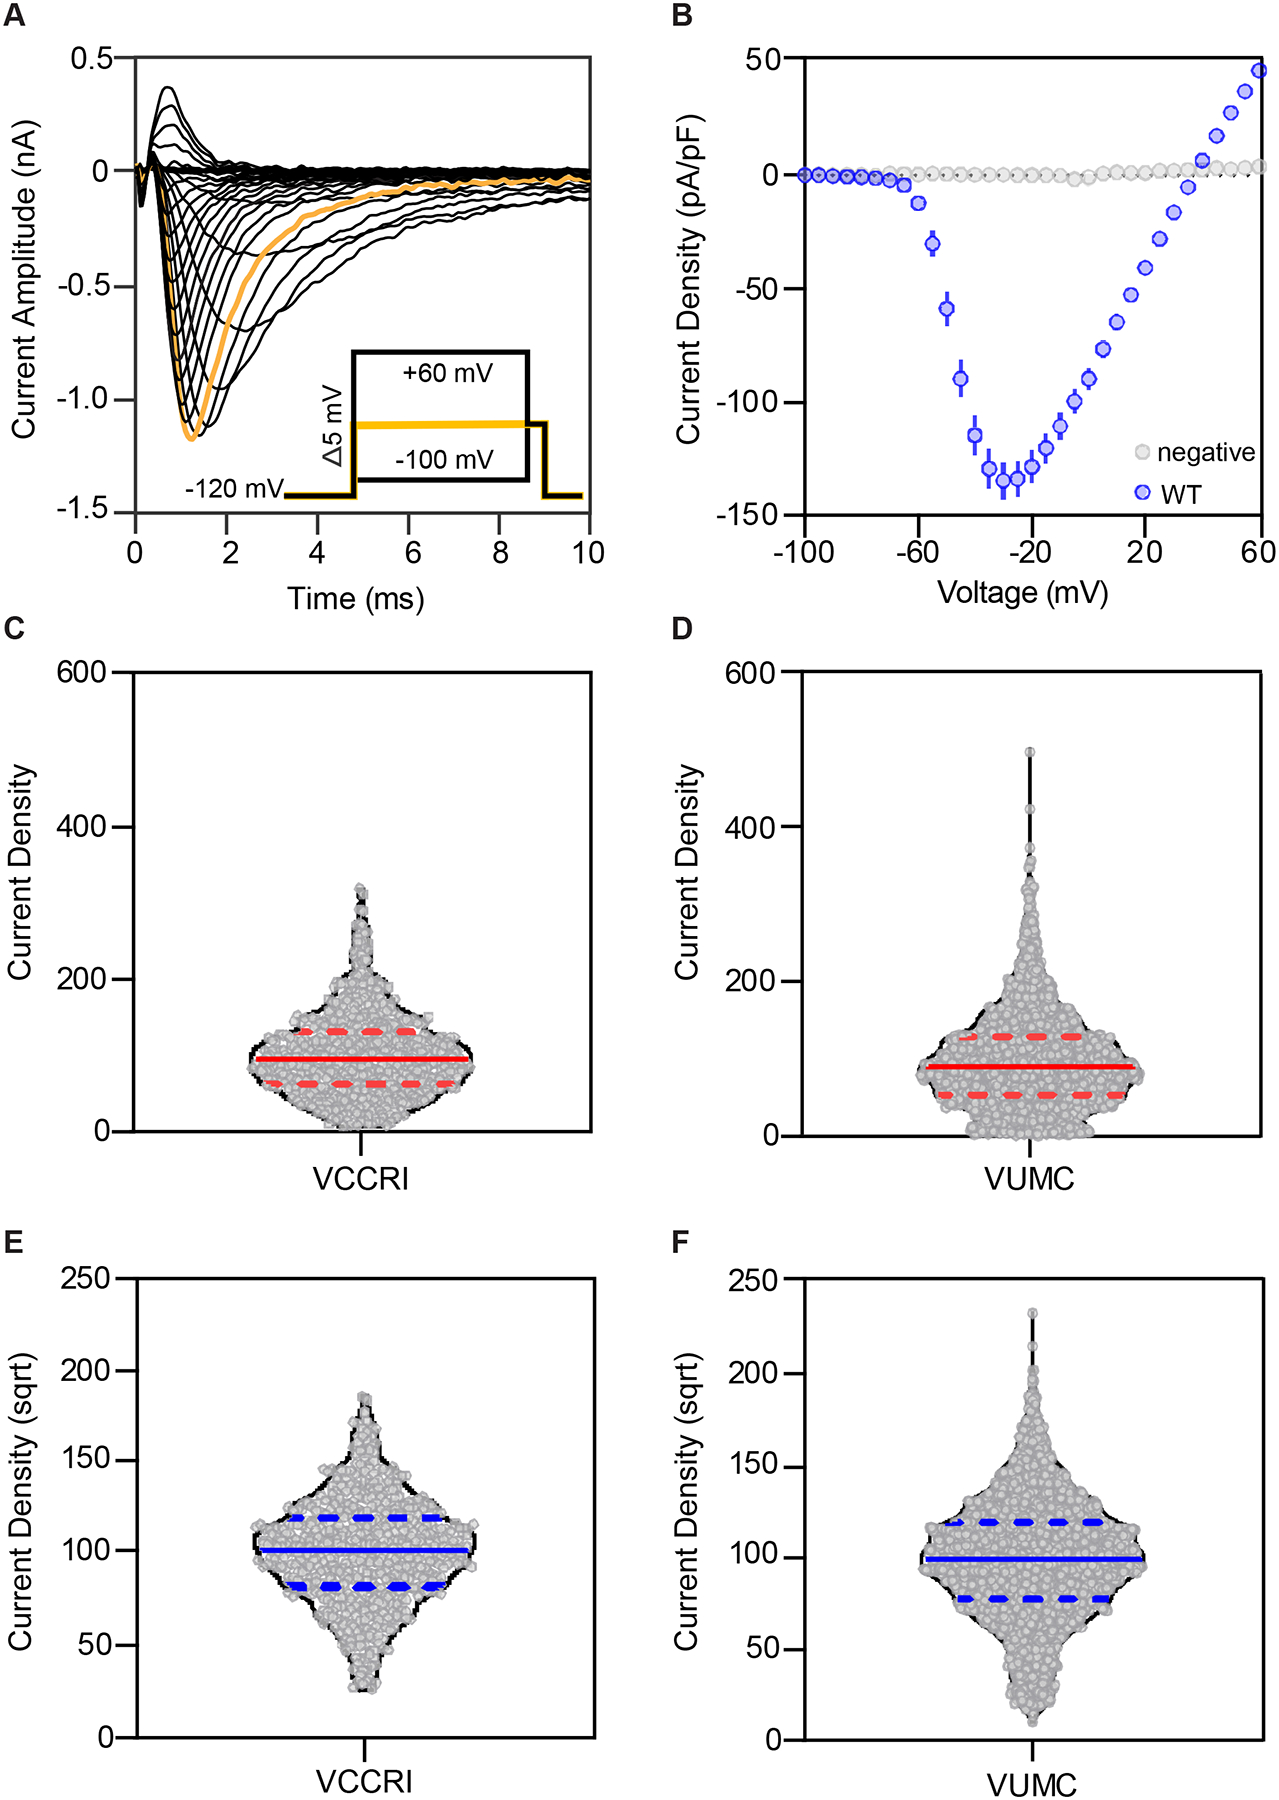
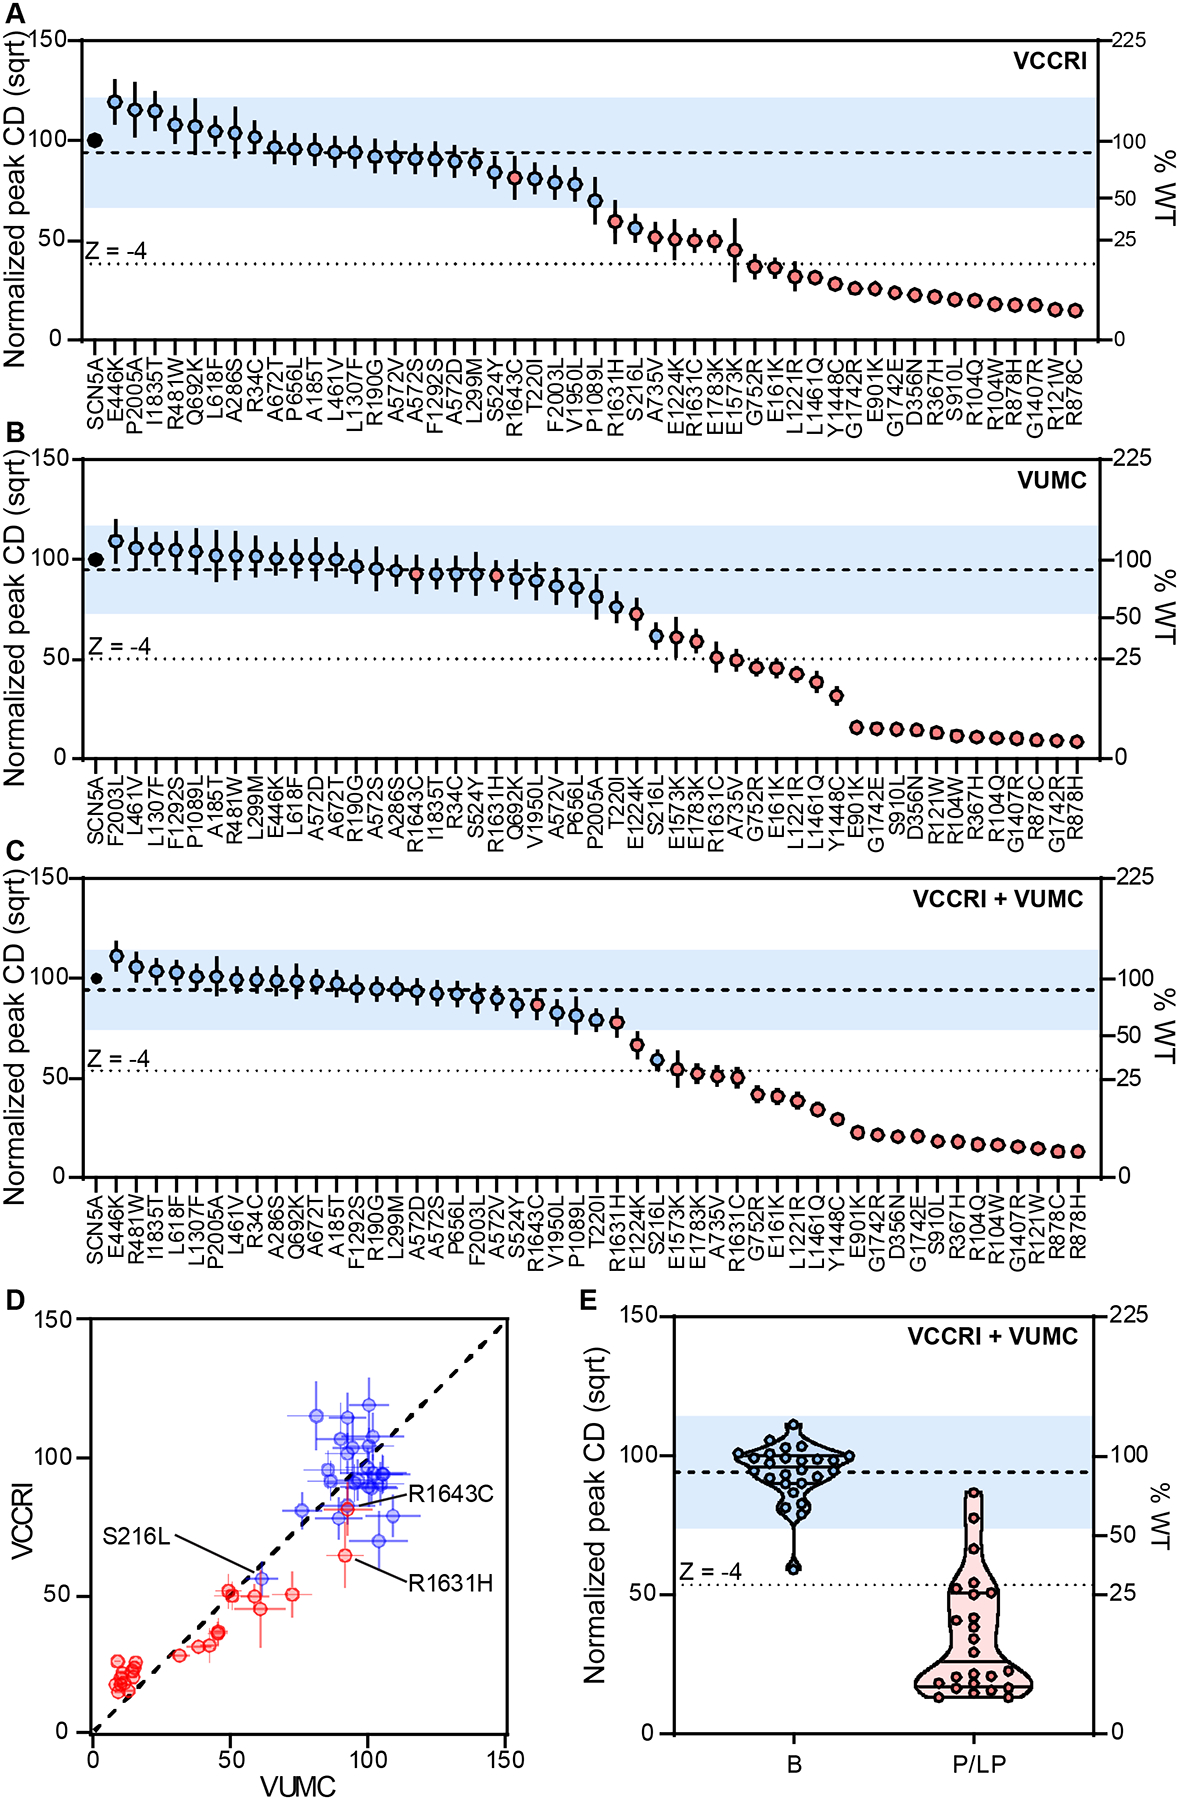
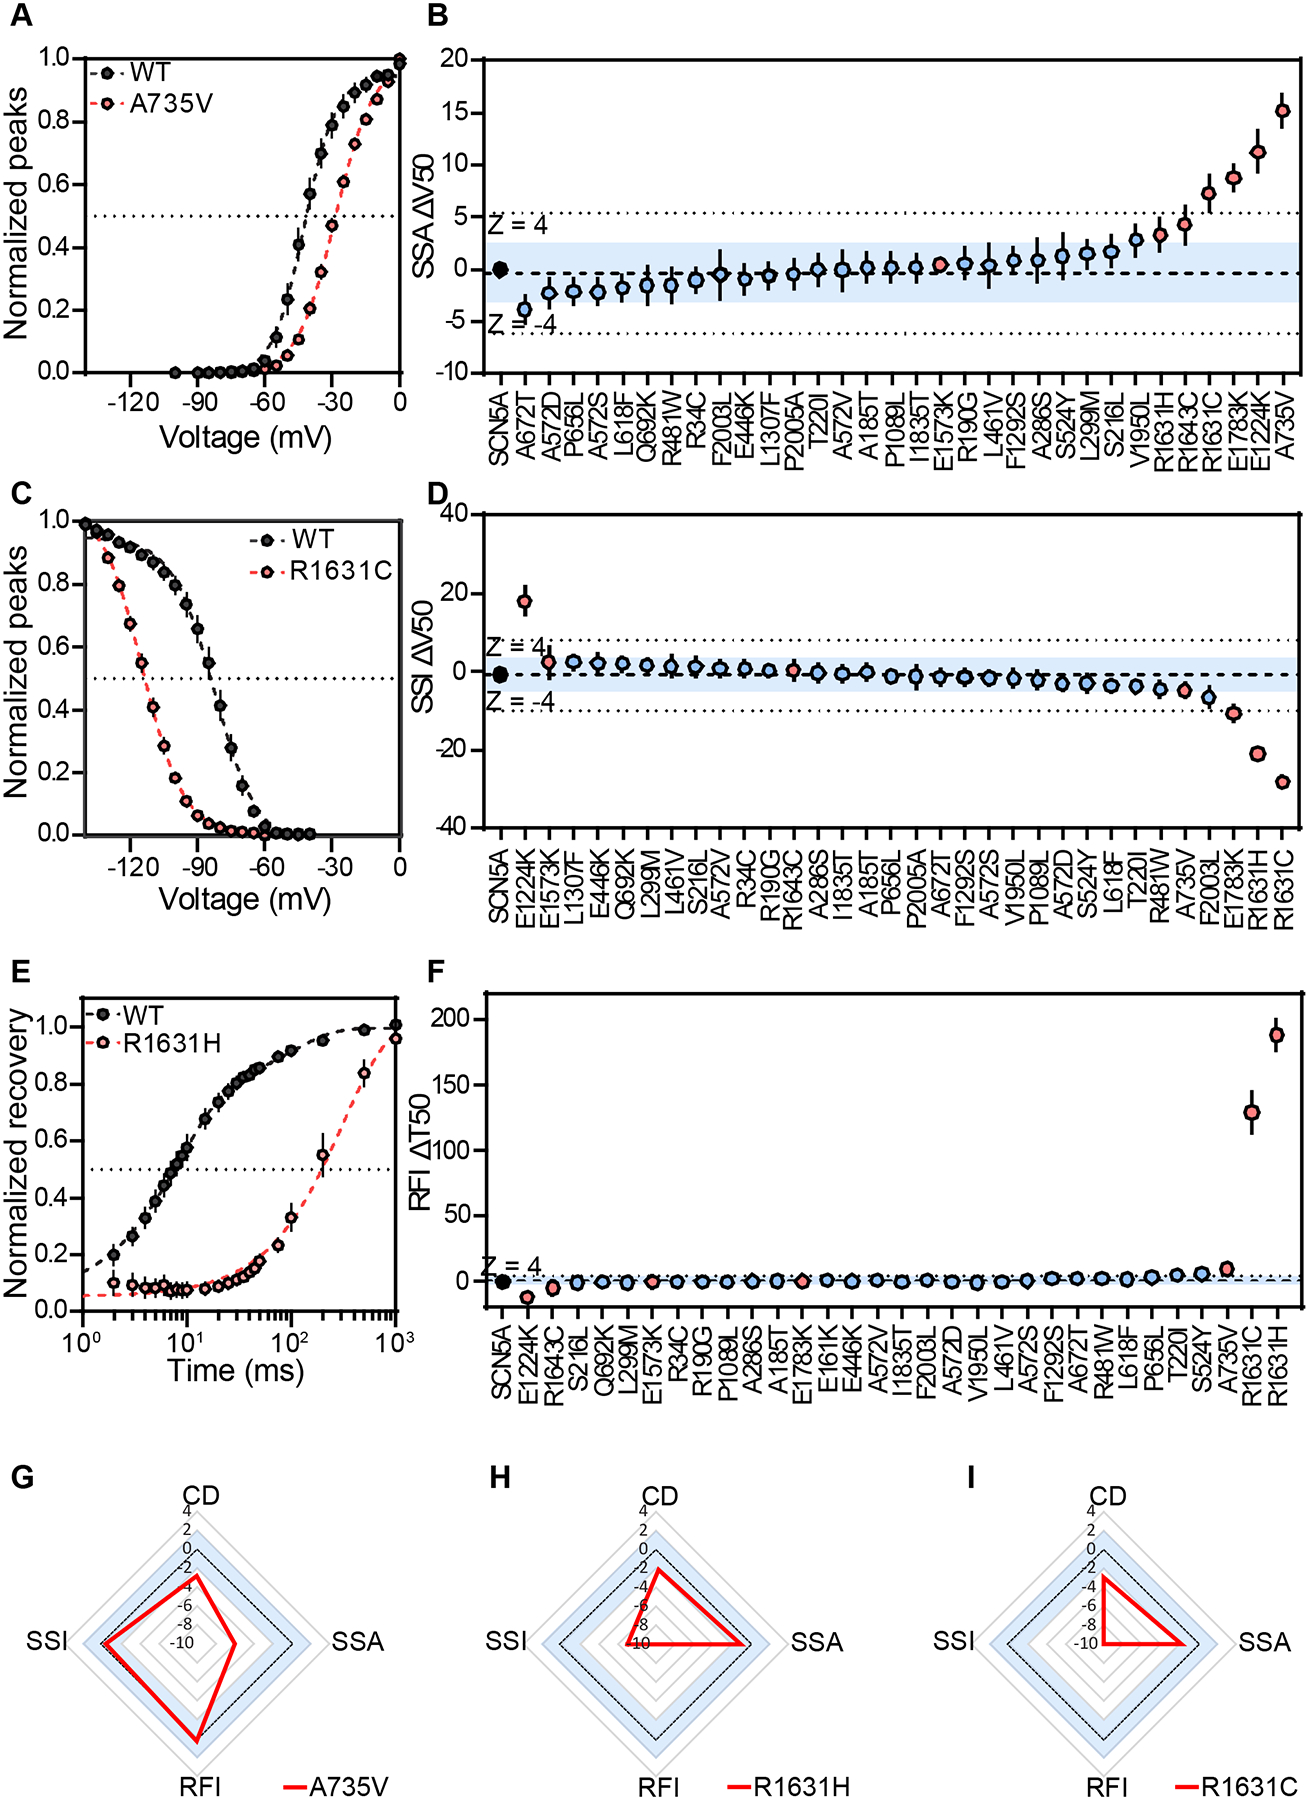
Results: Variant channel parameters generated independently at the 2 research sites showed strong correlations, including peak INa density (R2=0.86). The assay accurately distinguished benign controls (24/25 concordant variants) from pathogenic controls (23/24 concordant variants). Odds of pathogenicity values were 0.042 for normal function and 24.0 for abnormal function, corresponding to strong evidence for both American College of Medical Genetics and Genomics/Association for Molecular Pathology benign and pathogenic functional criteria (BS3 and PS3, respectively). Application of the assay to 4 clinical SCN5A variants of uncertain significance revealed loss-of-function for 3/4 variants, enabling reclassification to likely pathogenic.

Conclusions: This validated high-throughput assay provides clinical-grade functional evidence to aid the classification of current and future SCN5A-Brugada syndrome variants of uncertain significance.

Keywords: Brugada syndrome; arrhythmias, cardiac; genetic testing; patch-clamp techniques; voltage-gated sodium channels.


Conflict of interest statement

Dr Glazer is a consultant for BioMarin Inc Victoria Parikh is a scientific advisory board member (Lexeo Therapeutics), clinical advisor (Constantiam Biosciences), and consultant (BioMarin Inc, viz.ai). Dr Parikh also receives research support from BioMarin, Inc. The other authors report no conflicts.

Figures

Figure 1:
Figure 1:
A Calibrated SCN5A Automated Patch Clamp Assay. (A) Overview of project design. Selection of calibration variants, independent execution of experiments at two sites, calibration of results, and application to clinical cases. (B) Individual site assay schematic. Minor differences in cell systems, selection drugs, and APC conditions/analysis existed between sites and are described in the Methods.
Figure 2:
Figure 2:
Establishing an SCN5A voltage protocol and data transformation for normal distribution. (A) Example traces from a single cell expressing WT SCN5A illustrating sodium conductance following activation from −100 mV to +60 mV in +5 mV increments. The −30 mV sweep is highlighted in orange and was used for analyses. (B) Current-voltage curves show current densities at voltages −100 mV to +60 mV for WT (blue, N = 521) and negative cell lines (grey, N = 664). Mean ± 95% confidence interval values are shown. (C-D) Violin plot of WT SCN5A current density at each site (VCCRI N = 609; VUMC N = 2,118 cells). The current density of WT SCN5A did not follow a normal distribution (W = 0.956 and W = 0.942 at VCCRI and VUMC, respectively; Shapiro-Wilk test). The median value and 1st and 3rd quartiles are indicated with red lines. (E-F) Violin plots of WT SCN5A current density at each site after square root transformation. The square root-transformed current densities more closely followed a normal distribution (W = 0.997 and W = 0.995 at VCCRI and VUMC, respectively; Shapiro-Wilk test). The median value and 1st and 3rd quartiles are indicated with blue lines. The resulting mean ± SD of the square root-transformed distribution was 100 ± 29.2 (VCCRI) and 100 ± 34.1 (VUMC).
Figure 3:
Figure 3:
Distinguishing pathogenic and likely pathogenic variants from benign variants with NaV1.5 peak current density measurements. (A-C) Square-root transformed, normalized peak current densities at −30mV obtained by VCCRI (94.1 ± 13.9; N = 75; A), VUMC (94.8 ± 11.1; N = 50; B) and a combined dataset (94.2 ± 10.3; N = 125; C). Mean sample sizes are presented. See Table S3–S5 for variant- and site- specific sample sizes. SCN5A peak INa densities (pA/pF) were measured after holding at −120 mV. The normal functional range was defined as the mean ± 2 SD of the benign variant values (blue region). The peak current measurements distinguished the P/LP and B variants, apart from three variants (S216L, R1631H, and R1643C) discussed further in the text. (D) Peak current densities from the two sites were highly correlated (p<0.0001; R2 = 0.86). (E) Violin plot summary of combined current densities among B and P/LP variants. Blue-filled circles (●) indicated B variant controls. Red-filled circles (●) indicates P/LP variant controls. Data is presented as mean ± 95% CI.
Figure 4:
Figure 4:
Analysis of channel gating parameters reveals variants that affect gating. (A) SSA of A735V compared to WT, showing a right-shift in voltage of activation. Boltzmann best-fit curves are plotted. N = 48 and 1581, respectively. (B) Steady-state voltage of half-activation difference from wildtype (SSA ΔV50) for variant controls (N = 41.6). Combined SSA ΔV50 = −0.37 ± 1.71. ΔV50 represents the shift in voltage where variants are half activated, as compared to WT. (C) SSI of R1631C compared to WT, showing a left-shift in voltage of inactivation. Boltzmann best-fit curves are plotted. N = 65 and 1818, respectively. (D) Steady-state voltage of half-inactivation difference from wildtype (SSI ΔV50) for variant controls (N = 47.6). Combined SSI ΔV50 = −0.37 ± 1.71. ΔV50 represents the shift in voltage where variants are half inactivated, as compared to WT. (E) RFI of R1631H compared to WT, showing a large delay in recovery post inactivation. Double exponential best-fit curves are plotted. N = 39 and 1723, respectively. (F) RFI difference from WT (ΔT50). Combined RFI ΔT50 = 0.933 ± 1.77. ΔT50 represents the shift in time required for channels to reach a half-recovered from inactivation state as compared to WT. N = 46.6. Mean sample sizes are presented. See Table S3 for variant-specific sample sizes. Many P/LP control variants did not have sufficient peak current to measure the three parameters shown in this figure. (G) Sample radar plots for corresponding variants with extreme shifts in gating parameters: A735V (SSA), R1631C (SSI) and R1631H (RFI). Radar plots for all analyzed variants are presented in Figure S5. Blue-filled circles (●) indicated B variant controls. Red-filled circles (●) indicates P/LP variant controls. In panels B, D, F, G, H and I, the dashed line represents Z = 0, and the blue region indicates Z-scores within ± 2. In panels B, D and F, and the dotted lines indicate Z outside of ± 4. Data is presented as mean ± 95% CI.
Figure 5:
Figure 5:
Current density measured from a physiological resting potential is a single variable that distinguishes benign from pathogenic variants. (A) Protocol showing holding voltages of −120 mV −90 mV for 500 ms prior to activation of channels. Sample raw traces showing current measured with holding potentials of −120 mV and −90 mV for the same variant cell when depolarized to −30 mV. (B) Correlation between the different holding membrane voltages show strong correlation (R2=0.95), with outliers R1631H, R1631C and E1783K. (C) Normalized current density of variant controls activated from a holding voltage of −90 mV to represent the resting membrane potential of human cardiomyocytes encompasses gating parameters such as SSA, SSI and RFI. Mean = 91.7 ± 14.9. N = 520 for WT. N = 79.3 for variants. Mean sample sizes are presented for variants. See Table S5 for variant- and site- specific sample sizes. Blue-filled circles (●) indicated B variant controls. Red-filled circles (●) indicates P/LP variant controls. Data is presented as mean ± 95% CI.
Figure 6:
Figure 6:
Evaluation of assay according to ClinGen SVI recommendations for functional evidence. (A) Confusion matrix showing sensitivity and specificity of our previously deployed functional assessment combining −120 mV-held peak current (Z = 2) and gating (Z = 4) properties using data from both sites. (B) BS3_strong and PS3_strong may be applied for this combination of parameters functional assay, following ClinGen guidelines. (C) Confusion matrix showing sensitivity and specificity for a single parameter, −90 mV-held peak current (Z = 2) from the VCCRI site. The B variant S216L is concordantly classified in this implementation of the assay. (D) BS3_strong and PS3_strong may be applied for this single parameter functional assay, following ClinGen guidelines.
Figure 7:
Figure 7:
Reclassification of clinically observed variants with calibrated functional data. (A-D) Four clinical cases of families segregating SCN5A VUS. Arrows indicate the proband. Red crosses indicate variant carriers. The sexes of family members have been anonymized as indicated by diamond-shaped symbols. (A) Proband with sudden cardiac arrest and successful out-of-hospital defibrillation, subsequently diagnosed with Brugada Syndrome and Progressive Cardiac Conduction Defect. The SCN5A VUS segregated with conduction disease in the proband and the affected parent. There was a family history of cardiac arrests. (B) Proband with syncope and fever-induced Type 1 Brugada pattern on ECG, with a family history of recurrent syncope, seizures, and one cardiac arrest. Family members were hesitant to engage in genetic testing preventing segregation analysis. (C) Pedigree of family members with conduction block, cardiomyopathy, ventricular tachycardia/fibrillation and aborted cardiac arrest. The SCN5A VUS segregated with a severe arrhythmia phenotype in the proband and conduction block in his two young children. (D) Proband with spontaneous Type 1 Brugada pattern on a screening ECG, found to have a VUS in SCN5A. (E) Current-voltage diagrams for variants and WT cells functionally profiled by APC. (F) ACMG/AMP classification criteria and reclassifications following incorporation of functional data for the four clinically observed variants. Classifications were performed independently at each clinical site by a genetic counselor, clinical geneticist, or physician specializing in genomic medicine.

Update of

References

    1. Brugada P, Brugada J. Right bundle branch block, persistent st segment elevation and sudden cardiac death: A distinct clinical and electrocardiographic syndrome. A multicenter report. J Am Coll Cardiol. 1992;20:1391–1396 - PubMed
    1. Amin AS, Asghari-Roodsari A, Tan HL. Cardiac sodium channelopathies. Pflugers Arch. 2010;460:223–237 - PMC - PubMed
    1. Cerrone M, Costa S, Delmar M. The genetics of brugada syndrome. Annu Rev Genomics Hum Genet. 2022 - PubMed
    1. Hosseini SM, Kim R, Udupa S, Costain G, Jobling R, Liston E, et al. Reappraisal of reported genes for sudden arrhythmic death. Circulation. 2018;138:1195–1205 - PMC - PubMed
    1. Barc J, Tadros R, Glinge C, Chiang DY, Jouni M, Simonet F, et al. Genome-wide association analyses identify new brugada syndrome risk loci and highlight a new mechanism of sodium channel regulation in disease susceptibility. Nature Genetics. 2022;54:232–239 - PMC - PubMed

Substances

LinkOut - more resources