. 2024 Nov;20(11):2490-2510.
doi: 10.1080/15548627.2024.2374692. Epub 2024 Jul 10.

Metabolic stress induces a double-positive feedback loop between AMPK and SQSTM1/p62 conferring dual activation of AMPK and NFE2L2/NRF2 to synergize antioxidant defense

Affiliations

Metabolic stress induces a double-positive feedback loop between AMPK and SQSTM1/p62 conferring dual activation of AMPK and NFE2L2/NRF2 to synergize antioxidant defense

Eun-Ji Choi et al. Autophagy. 2024 Nov.

Abstract

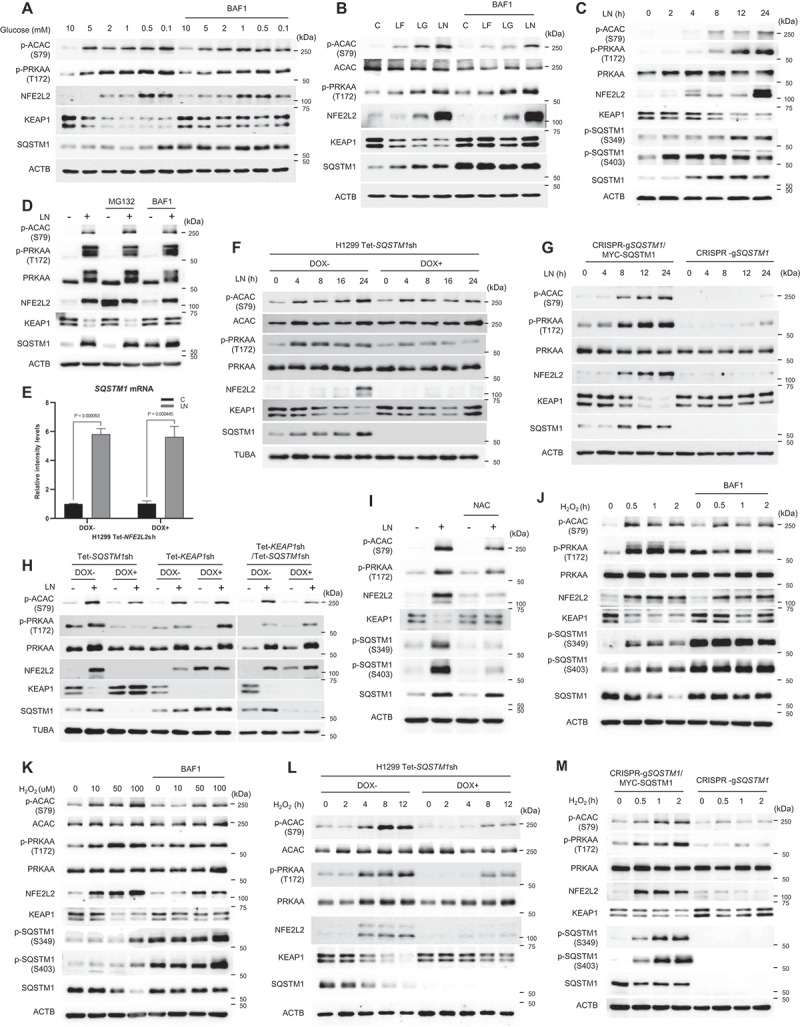
Co-occurring mutations in KEAP1 in STK11/LKB1-mutant NSCLC activate NFE2L2/NRF2 to compensate for the loss of STK11-AMPK activity during metabolic adaptation. Characterizing the regulatory crosstalk between the STK11-AMPK and KEAP1-NFE2L2 pathways during metabolic stress is crucial for understanding the implications of co-occurring mutations. Here, we found that metabolic stress increased the expression and phosphorylation of SQSTM1/p62, which is essential for the activation of NFE2L2 and AMPK, synergizing antioxidant defense and tumor growth. The SQSTM1-driven dual activation of NFE2L2 and AMPK was achieved by inducing macroautophagic/autophagic degradation of KEAP1 and facilitating the AXIN-STK11-AMPK complex formation on the lysosomal membrane, respectively. In contrast, the STK11-AMPK activity was also required for metabolic stress-induced expression and phosphorylation of SQSTM1, suggesting a double-positive feedback loop between AMPK and SQSTM1. Mechanistically, SQSTM1 expression was increased by the PPP2/PP2A-dependent dephosphorylation of TFEB and TFE3, which was induced by the lysosomal deacidification caused by low glucose metabolism and AMPK-dependent proton reduction. Furthermore, SQSTM1 phosphorylation was increased by MAP3K7/TAK1, which was activated by ROS and pH-dependent secretion of lysosomal Ca2+. Importantly, phosphorylation of SQSTM1 at S24 and S226 was critical for the activation of AMPK and NFE2L2. Notably, the effects caused by metabolic stress were abrogated by the protons provided by lactic acid. Collectively, our data reveal a novel double-positive feedback loop between AMPK and SQSTM1 leading to the dual activation of AMPK and NFE2L2, potentially explaining why co-occurring mutations in STK11 and KEAP1 happen and providing promising therapeutic strategies for lung cancer.Abbreviations: AMPK: AMP-activated protein kinase; BAF1: bafilomycin A1; ConA: concanamycin A; DOX: doxycycline; IP: immunoprecipitation; KEAP1: kelch like ECH associated protein 1; LN: low nutrient; MAP3K7/TAK1: mitogen-activated protein kinase kinase kinase 7; MCOLN1/TRPML1: mucolipin TRP cation channel 1; MEFs: mouse embryonic fibroblasts; MTORC1: mechanistic target of rapamycin kinase complex 1; NAC: N-acetylcysteine; NFE2L2/NRF2: NFE2 like bZIP transcription factor 2; NSCLC: non-small cell lung cancer; PRKAA/AMPKα: protein kinase AMP-activated catalytic subunit alpha; PPP2/PP2A: protein phosphatase 2; ROS: reactive oxygen species; PPP3/calcineurin: protein phosphatase 3; RPS6KB1/p70S6K: ribosomal protein S6 kinase B1; SQSTM1/p62: sequestosome 1; STK11/LKB1: serine/threonine kinase 11; TCL: total cell lysate; TFEB: transcription factor EB; TFE3: transcription factor binding to IGHM enhancer 3; V-ATPase: vacuolar-type H+-translocating ATPase.

Keywords: AXIN; KEAP1; STK11/LKB1; lysosomal stress; metabolic stress; oxidative stress.


Conflict of interest statement

No potential conflict of interest was reported by the author(s).

Figures

Figure 1.
Figure 1.
Metabolic stress activates NFE2L2 via SQSTM1-dependent inhibition of KEAP1 through ROS-dependent and -independent mechanisms. (A) H1299 cells were incubated with the indicated concentrations of glucose and 10% FBS for 24 h in the absence or presence of bafilomycin A1 (BAF1, 10 nM) followed by cell lysis and western blotting. (B) H1299 cells were incubated with control (C; 10% FBS, 10 mM glucose), LF (0.5% FBS, 10 mM glucose), LG (10% FBS, 0.5 mM glucose), or LN (0.5% FBS, 0.5 mM glucose) for 24 h in the absence or presence of BAF1 (10 nM), followed by cell lysis and western blotting. (C) H1299 cells were incubated in LN for the indicated times, followed by cell lysis and western blot analysis. (D) H1299 cells were incubated in LN for 24 h. MG132 (10 μM) and BAF1 (100 nM) were added for the last 3 or 12 h of incubation, respectively, followed by cell lysis and western blotting. (E) H1299 cells stably expressing tet-NFE2L2sh were cultured in the absence or presence of doxycycline (DOX) for 5 days and then incubated in LN for 24 h. Total RNA was extracted to measure SQSTM1 mRNA levels using real-time PCR. The results are shown as mean ± SD. p values of C vs. LN in each group are indicated. (F and G) H1299-tet-SQSTM1sh cells cultured in the absence or presence of DOX for 5 days (F) or H1299-CRISPR-gSQSTM1 cells and the cells reconstituted with MYC-tagged SQSTM1 were incubated in LN for the indicated time points (G), followed by cell lysis and western blotting. (H) H1299 cells stably expressing tet-SQSTM1sh, tet-KEAP1sh, or both, cultured in the absence or presence of DOX for 5 d, were incubated in LN for 24 h followed by cell lysis and western blotting. (I) H1299 cells were incubated in LN for 24 h in the presence or absence of NAC (2 mM) followed by cell lysis and western blotting. (J) H1299 cells were incubated with H2O2 (100 μM) for the indicated time points in the absence or presence of BAF1 (100 nM) followed by cell lysis and Western blot. (K) H1299 cells were incubated with H2O2 (100 nM) for the indicated concentrations of H2O2 for 2 h in the absence or presence of BAF1 (100 nM) followed by cell lysis and western blot. (L) H1299-tet-SQSTM1sh cells were cultured in the absence or presence of DOX for 5 days, followed by incubation with H2O2 (500 μM) for the indicated time points followed by cell lysis and western blotting. (M) H1299-CRISPR-gSQSTM1 cells and the cells reconstituted with MYC-tagged SQSTM1 were incubated with H2O2 (100 μM) for the indicated time points followed by cell lysis and western blotting.
Figure 2.
Figure 2.
SQSTM1 promotes AMPK activation by inducing lysosomal AXIN-STK11-AMPK complex during metabolic stress. (A) WT Sqstm1 or sqstm1 KO MEFs were incubated in a medium deprived of glucose for 2 h, then the cells were lysed and immunoprecipitated with an AXIN antibody, followed by western blotting with the indicated antibodies. TCL, total cell lysate. (B) WT SQSTM1or sqstm1 KO MEFs were incubated in glucose-deprived medium for 2 h, then the localisation of AXIN was determined by immunostaining. Endogenous AXIN (green) and LAMP2 (red) were stained with goat anti-AXIN and rat anti-LAMP2 antibodies and imaged using confocal microscopy. (C-G) H1299 cells stably expressing tet-SQSTM1sh were cultured in the absence or presence of DOX for 5 days, followed by incubation with DMSO (control), Thapsigargin (TG, 1 μM) (C), BAPTA-AM (50 μM) (D), AMG-9810 (100 μM) (E), BAF1 (100 nM) (F), concanamycin a (Con A, 100 nM) (G), for the indicated time points followed by cell lysis and western blotting.
Figure 3.
Figure 3.
Dual activation of AMPK and NFE2L2 mediated by SQSTM1 during metabolic stress synergize antioxidant defenses and tumor growth. (A and B) H1299 cells stably expressing tet-PRKAAsh, tet-NFE2L2sh, or both were cultured in the absence or presence of DOX for 5 days, followed by incubation in LN followed by cell lysis and western blotting (A), or the cells were treated with CM-DCFDA (5 μM) for 30 min to measure the ROS levels. The results are shown as mean ± SD. p values for -DOX vs. +DOX in each group are indicated (B). (C) H1299 cells stably expressing tet-PRKAAsh, tet-NFE2L2sh, or both were subjected to clonogenic assay in the absence or presence of DOX in the medium containing 2 mM glucose with 10% FBS. The results are shown as mean ± SD. p values for -DOX vs. +DOX in each group are indicated. (D) H1299 cells stably expressing tet-PRKAAsh, tet-NFE2L2sh, or both were subjected to soft agar assay in the absence or presence of DOX, NAC (2 mM), or CAT (400 unit/ml). The results are shown as mean ± SD. p values for -DOX vs. +DOX in each group are indicated. (E and F) Athymic nude mice inoculated with H1299 cells (5 × 106) stably expressing tet-PRKAAsh, tet-NFE2L2sh, or both were divided into two groups each (n = 6) for DOX administration. Tumor sizes (E) were measured every 3–4 days, and tumor images and weights (F) were obtained after 41 days of treatment as described in Methods. The data are mean ± sd (n = 5). p values for -DOX vs. +DOX in each group are indicated. (G) H1299-CRISPR-gSQSTM1 cells or the cells reconstituted with MYC-tagged SQSTM1 were incubated in LN media for the indicated time points followed by ROS measurement. The results are shown as mean ± SD. p values are indicated. (H) H1299 cells stably expressing tet-SQSTM1sh were subjected to clonogenic assay in the absence or presence of DOX in the medium containing 2 mM glucose and 10% FBS. The results are shown as mean ± SD. p values for -DOX vs. +DOX in each group are indicated. (I) H1299 cells stably expressing tet-SQSTM1sh were subjected to a soft agar assay in the absence or presence of DOX, NAC (2 mM), or CAT (400 unit/ml). The results are shown as mean ± SD. p values for -DOX vs. +DOX in each group are indicated.
Figure 4.
Figure 4.
The STK11-AMPK pathway is required for the activation of SQSTM1-KEAP1-NFE2L2 axis during metabolic stress. (A) H1299 vs. H1299-CRISPR-gPRKAA cells were incubated in LN for the indicated time points, followed by cell lysis for western blotting. (B and C) WT Prkaa vs. prkaa1 prkaa2 double knockout (prkaa DKO) MEFs were incubated in LN for the indicated time points followed by cell lysis and analysis by immunoblotting (B), or RNA extraction to measure Sqstm1 mRNA levels by real-time qPCR (C). The results are shown as mean ± SD. p values of C vs. LN in each group are indicated. (D and E) H1299-tet-PRKAAsh cells cultured in the absence or presence of DOX for 5 days (D), or WT Prkaa vs. prkaa DKO MEFs (E), were incubated with H2O2 (100 μM) for the indicated time points, followed by cell lysis for western blotting. (F and G) H1299-CRISPR-gPRKAA cells (F), or WT Prkaa vs. prkaa DKO MEFs (G), stably expressing MYC-tagged WT SQSTM1, SQSTM1S349A, SQSTM1S403A, SQSTM1S349A,S403A were incubated in LN for 24 h followed by cell lysis for western blotting. (H) Correlation analysis of TCGA-LUAD data between p-ACC(S79) levels and mRNA levels of the NFE2L2 target gene set (pentose phosphate pathway). (I) Illustration depicting why co-occurring mutations in STK11 and KEAP1 occur in NSCLC. In the absence of AMPK-SQSTM1 activity in STK11 mutant cells, NFE2L2 cannot be fully activated due to failure of KEAP1 inhibition under metabolic stress conditions leading to oxidative cell death. Thus, KEAP1 mutations should be selected in STK11 mutant cells to fully activate NFE2L2 in the absence of AMPK-SQSTM1 activity to survive and grow.
Figure 5.
Figure 5.
AMPK induces SQSTM1 expression via PPP2 dependent dephosphorylation of TFE3 and TFEB during metabolic stress. (A and B) WT Prkaa vs. prkaa DKO MEFs were incubated in LN for 16 h, followed by cytosol-nuclear fractionation for western blotting (A) or immunostaining with anti-TFE3 (green) and DAPI (blue) (B). Scale bars: 50 μm. (C) H1299 cells were incubated in LN for 24 h in the presence or absence of NAC (2 mM), followed by cell lysis and western blot analysis. (D and E) H1299 cells stably expressing tet-TFEBsh, tet-TFE3sh, or both were cultured in the absence or presence of DOX for 5 days, followed by incubation in LN for 24 h. The cells were then lysed for western blotting (D) or total RNA extraction to measure SQSTM1 mRNA levels using real-time qPCR (E). The results are shown as mean ± SD. p values for -DOX vs. +DOX in each group are indicated. (F) H1299 cells incubated in LN for 24 h, or stably expressing TFEB or TFE3 were lysed for western blot analysis. (G) H1299 cells were incubated in LN for 24 h in the absence or presence of okadaic acid (OA, 100 nM) for a least 12 h of incubation, followed by cell lysis for western blotting. (H) H1299 cells were treated with FTY720 (1, 10 μM) for 24 h in the absence or presence of BAF1, followed by cell lysis for western blotting.
Figure 6.
Figure 6.
AMPK induces lysosomal deacidification during metabolic stress leading to the expression of SQSTM1 via PPP2-TFEB and PPP2-TFE3 axis. (A) H1299-plenti-CAG-RpH-LAMP1 cells were incubated in LN for 16 h in the absence or presence of lactic acid (LA, 25 mM) followed by the measurement of pHluorin (green, pH sensitive) vs. mCherry (red, pH insensitive) fluorescence intensities indicating lysosomal pH. Scale bars: 50 μm. The results are shown as mean ± SD. p values of C vs. LN vs. LN + LA are indicated. (B) the MEFs were incubated in LN for 6 h in the absence or presence of LA (10 mM). Then the cells were loaded with Dextran-Oregon 488 (Green) and Dextran-TMR (red) for 1 h followed by the measurement of green (pH sensitive) vs. red (pH insensitive) fluorescence intensities indicating lysosomal pH. Scale bars: 50 μm. The results are shown as mean ± SD. p values of C vs. LN vs. LN + LA are indicated. (C) WT Prkaa vs. prkaa DKO MEFs were incubated in LN for 6 h, or NH4Cl (25 mM), or Con a (100 nM) for 2 h. Then the cells were loaded with Dextran-Oregon 488 (Green) and Dextran-TMR (red) for 1 h followed by the measurement of green (pH sensitive) vs. red (pH insensitive) fluorescence intensities indicating lysosomal pH. Scale bars: 50 μm. The results are shown as mean ± SD. p values for each treatment vs. C are indicated. (D and E) H1299-tet-PRKAAsh cells cultured in the absence or presence of DOX for 5 days (D), or WT Prkaa vs. prkaa DKO MEFs (E) were incubated with NH4Cl (25 mM), BAF1 (100 nM), or Con a (100 nM) for 4 h, followed by cell lysis for western blotting. (F) H1299 cells were incubated in LN or NH4Cl (25 mM) for 24 h in the absence or presence of OA (100 nM) for the last 12 h of incubation, followed by cell lysis for western blotting. (G) H1299 cells stably expressing both tet-TFEBsh and tet-TFE3sh were cultured in the absence or presence of DOX for 5 days and then incubated in LN for 16 h or with NH4Cl (25 mM), BAF1 (100 nM), or ConA (100 nM) for 4 h, followed by cell lysis for western blotting. (H) the H1299 cells were incubated in LN with LA (5, 15, and 25 mM) for 16 h, followed by cell lysis for western blotting. (I) H1299 cells were incubated in LN for 8 or 16 h in the absence or presence of LA (25 mM) followed by cell lysis for western blot analysis.
Figure 7.
Figure 7.
AMPK is required for ROS-dependent activation of lysosomal calcium-MAP3K7-SQSTM1 phosphorylation axis during metabolic stress. (A and B) H1299-tet-PRKAAsh cells were cultured in the absence or presence of DOX for 5 days (A) or WT Prkaa vs. prkaa DKO MEFs (B) were incubated in LN for 6 h, or with H2O2 (100 nM) for 2 h. Then the cells were loaded with Dextran-Oregon 488 (Green) and Dextran-TMR (red) for 1 h followed by the measurement of green (pH sensitive) vs. red (pH insensitive) fluorescence intensities indicating lysosomal pH. Scale bars: 50 μm. The results are shown as mean ± SD. p values for each treatment vs. C are indicated. (C) H1299-tet-MCOLN1sh cells were cultured in the absence or presence of DOX for 5 days, then incubated with H2O2 (500 μM) for the indicated time points followed by cell lysis for western blotting. (D) H1299 cells were incubated with H2O2 (100 μM) for 2 h in the absence or presence of BAPTA-AM (5, 10, and 50 μM) followed by cell lysis for western blotting. (E and F) H1299 cells were incubated with H2O2 (100 μM) for 2 h (E) or in LN for 24 h (F) in the absence or presence of MAP3K7/TAK1 inhibitor (Takinib, 0.1, 1, and 5 μM), followed by cell lysis for western blotting. (G) MEFs were incubated in LN for 16 h in the absence or presence of MAP3K7 inhibitor (Takinib, 1 and 5 μM), followed by cell lysis for western blotting. (H and I) H1299-tet-MAP3K7sh cells were cultured in the absence or presence of DOX for 5 days, then incubated with H2O2 (100 μM) for 2 h (H), or in LN for 24 h (I), followed by cell lysis for western blotting.
Figure 8.
Figure 8.
Phosphorylation of SQSTM1 at S24 and S226 by the ROS-MAP3K7 axis is critical for the activation of AMPK and NFE2L2 and colony growth during metabolic stress. (A and B) H1299-CRISPR-gSQSTM1 cells stably reconstituted with MYC-tagged WT SQSTM1, SQSTM1S24A, SQSTM1S226A, SQSTM1S24A,S226A, SQSTM1Ser349A,S403A, and SQSTM1S24A,S226A,S349A,S403A were incubated in LN for 5 h (A), or with H2O2 (100 μM) for 2 h (B), followed by cell lysis for western blotting. (C and D) H1299-CRISPR-gSQSTM1 cells stably reconstituted with MYC-tagged WT SQSTM1, SQSTM1S24A,S226A, or SQSTM1S349A,S403A were transfected with AXIN-HA (C), or KEAP1-HA (D). The cells were incubated in LN for 11 h, lysed, and immunoprecipitated with an HA antibody, followed by western blotting with the indicated antibodies. TCL, total cell lysate. (E) prkaa DKO MEFs cells stably expressing KEAP1-HA with MYC-tagged WT SQSTM1, SQSTM1S24A,S226A, SQSTM1S349A, or SQSTM1S349A,S403A were incubated in LN for 4 h, followed by cell lysis for western blotting. (F) H1299 cells (P) and H1299-CRISPR-gPRKAA cells stably expressing MYC-tagged WT SQSTM1 or SQSTM1S24A,S226A were incubated in LN for 24 h followed by cell lysis for western blotting. (G) prkaa DKO MEFs cells stably reconstituted with MYC-tagged WT SQSTM1, SQSTM1S24A,S226A, SQSTM1S349A or SQSTM1S349A,S403A were transfected with KEAP1-HA. The cells were incubated in LN for 4 h, lysed, and immunoprecipitated with an HA antibody, followed by western blotting with the indicated antibodies. TCL, total cell lysate. (H and I) H1299-CRISPR-gSQSTM1 cells stably reconstituted with MYC-tagged WT SQSTM1, SQSTM1S24A, SQSTM1S226A, SQSTM1S24A,S226A, SQSTM1S349A,S403A, and SQSTM1S24A,S226A,S349A,S403A were incubated in LN media for 4 h by ROS measurement (H). The cells were subjected to clonogenic assays in a medium containing 2 mM glucose and 10% FBS (I). The results are shown as mean ± SD, p values are indicated. (J) H1299-CRISPR-gSQSTM1 cells stably reconstituted with MYC-tagged WT SQSTM1, SQSTM1S24E, SQSTM1S226E, SQSTM1S24E,S226E, or SQSTM1S349E were incubated in the absence or presence of BAF1 (100 nM) for 24 h, followed by cell lysis for western blotting. (K) H1299-CRISPR-gSQSTM1 cells stably reconstituted with MYC-tagged WT SQSTM1, SQSTM1S24E, SQSTM1S226E, SQSTM1S24E,S226E, or SQSTM1S349E were transfected with KEAP1-HA, lysed, and immunoprecipitated with an HA antibody, followed by western blotting with the indicated antibodies. TCL, total cell lysate. (L) Summary: Metabolic stress (low nutrient) induces ROS production and reduces proton generation, which is further inhibited by AMPK activation, resulting in lysosomal deacidification. ROS induces MCOLN1-dependent lysosomal Ca2+ secretion which induces SQSTM1 phosphorylation via MAP3K7. Mild AMPK-dependent increase in lysosomal pH is required for ROS-induced SQSTM1 phosphorylation. A substantial increase in lysosomal pH caused by both low nutrient conditions and AMPK activation induces SQSTM1 expression through PPP2-dependent TFEB and TFE3 dephosphorylation and activation. SQSTM1 is also required for AXIN-STK11-AMPK complex formation and activation of AMPK on the lysosomal membrane during metabolic stress, revealing a novel double-positive feedback loop between AMPK and SQSTM1.

Similar articles

Cited by

References

    1. Denk D, Greten FR.. Inflammation: the incubator of the tumor microenvironment. Trends Cancer. 2022. Nov 1;8(11):901–914. doi: 10.1016/j.trecan.2022.07.002 - DOI - PubMed
    1. de Visser KE, Joyce JA. The evolving tumor microenvironment: from cancer initiation to metastatic outgrowth. Cancer Cell. 2023. Mar 13;41(3):374–403. doi: 10.1016/j.ccell.2023.02.016 - DOI - PubMed
    1. Aki S, Nakahara R, Maeda K, et al. Cancer metabolism within tumor microenvironments. Biochim et Biophys Acta (BBA) – Gener Subj. 2023. May 1;1867(5):130330. doi: 10.1016/j.bbagen.2023.130330 - DOI - PubMed
    1. Jeon S-M. Regulation and function of AMPK in physiology and diseases. Exp & Mol Med. 2016. Jul 1;48(7):e245–e245. doi: 10.1038/emm.2016.81 - DOI - PMC - PubMed
    1. Steinberg GR, Hardie DG. New insights into activation and function of the AMPK. Nat Rev Mol Cell Biol. 2023. Apr 1;24(4):255–272. doi: 10.1038/s41580-022-00547-x - DOI - PubMed

Publication types

MeSH terms