

Infant and adult human intestinal enteroids are morphologically and functionally distinct
- PMID: 38953637
- PMCID: PMC11323560
- DOI: 10.1128/mbio.01316-24
Infant and adult human intestinal enteroids are morphologically and functionally distinct
Abstract
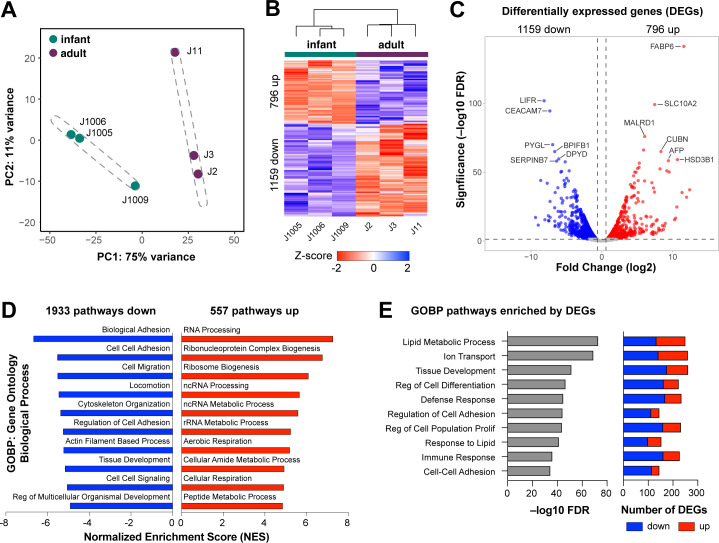
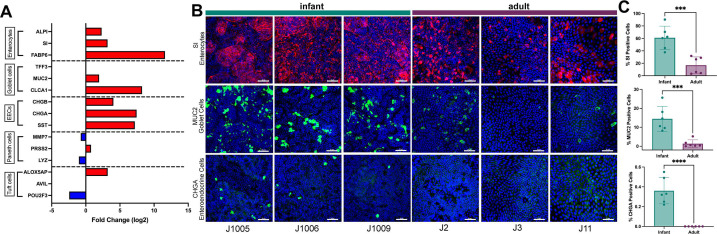
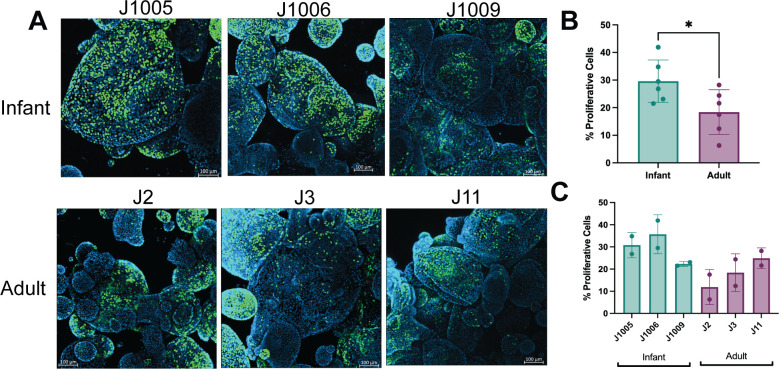
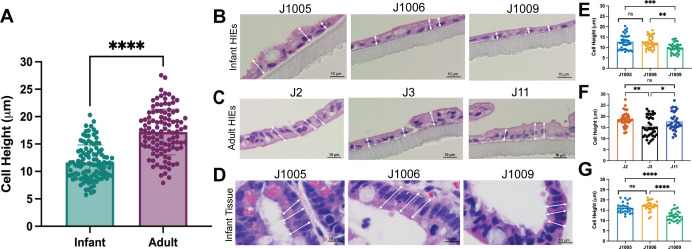
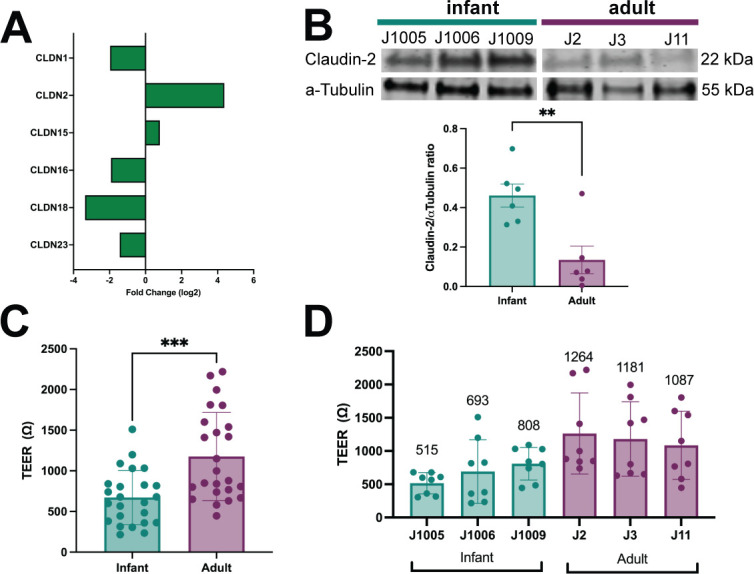
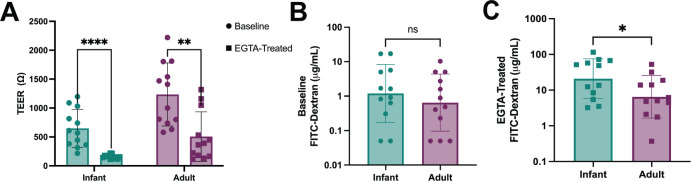
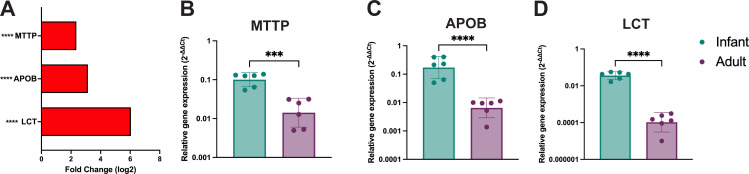
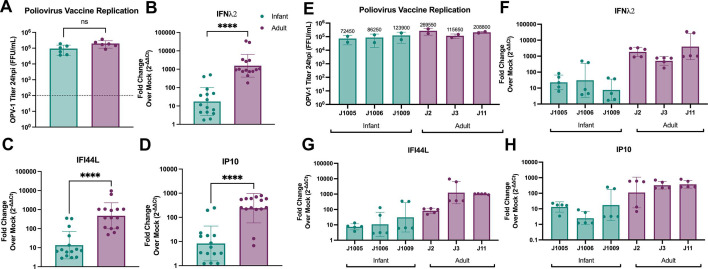
Human intestinal enteroids (HIEs) are gaining recognition as physiologically relevant models of the intestinal epithelium. While HIEs from adults are used extensively in biomedical research, few studies have used HIEs from infants. Considering the dramatic developmental changes that occur during infancy, it is important to establish models that represent infant intestinal characteristics and physiological responses. We established jejunal HIEs from infant surgical samples and performed comparisons to jejunal HIEs from adults using RNA sequencing (RNA-Seq) and morphologic analyses. We then validated differences in key pathways through functional studies and determined whether these cultures recapitulate known features of the infant intestinal epithelium. RNA-Seq analysis showed significant differences in the transcriptome of infant and adult HIEs, including differences in genes and pathways associated with cell differentiation and proliferation, tissue development, lipid metabolism, innate immunity, and biological adhesion. Validating these results, we observed a higher abundance of cells expressing specific enterocyte, goblet cell, and enteroendocrine cell markers in differentiated infant HIE monolayers, and greater numbers of proliferative cells in undifferentiated 3D cultures. Compared to adult HIEs, infant HIEs portray characteristics of an immature gastrointestinal epithelium including significantly shorter cell height, lower epithelial barrier integrity, and lower innate immune responses to infection with an oral poliovirus vaccine. HIEs established from infant intestinal tissues reflect characteristics of the infant gut and are distinct from adult cultures. Our data support the use of infant HIEs as an ex vivo model to advance studies of infant-specific diseases and drug discovery for this population.
Importance: Tissue or biopsy stem cell-derived human intestinal enteroids are increasingly recognized as physiologically relevant models of the human gastrointestinal epithelium. While enteroids from adults and fetal tissues have been extensively used for studying many infectious and non-infectious diseases, there are few reports on enteroids from infants. We show that infant enteroids exhibit both transcriptomic and morphological differences compared to adult cultures. They also differ in functional responses to barrier disruption and innate immune responses to infection, suggesting that infant and adult enteroids are distinct model systems. Considering the dramatic changes in body composition and physiology that begin during infancy, tools that appropriately reflect intestinal development and diseases are critical. Infant enteroids exhibit key features of the infant gastrointestinal epithelium. This study is significant in establishing infant enteroids as age-appropriate models for infant intestinal physiology, infant-specific diseases, and responses to pathogens.
Keywords: development; enteroids; infant gut; intestinal organoids.
Conflict of interest statement
The authors declare no conflict of interest.
Figures
Update of
-
Infant and Adult Human Intestinal Enteroids are Morphologically and Functionally Distinct.bioRxiv [Preprint]. 2024 Feb 17:2023.05.19.541350. doi: 10.1101/2023.05.19.541350. bioRxiv. 2024. Update in: mBio. 2024 Aug 14;15(8):e0131624. doi: 10.1128/mbio.01316-24. PMID: 37292968 Free PMC article. Updated. Preprint.
References
-
- Franco MA, Greenberg HB. 2012. Rotaviruses, noroviruses, and other gastrointestinal viruses. Goldman’s Cecil Medicine:2144–2147. doi:10.1016/B978-1-4377-1604-7.00388-2 - DOI
-
- Sato T, Stange DE, Ferrante M, Vries RGJ, Van Es JH, Van den Brink S, Van Houdt WJ, Pronk A, Van Gorp J, Siersema PD, Clevers H. 2011. Long-term expansion of epithelial organoids from human colon, adenoma, adenocarcinoma, and Barrett’s epithelium. Gastroenterology 141:1762–1772. doi:10.1053/j.gastro.2011.07.050 - DOI - PubMed
MeSH terms
Grants and funding
- P30 ES030285, P42 ES027725/HHS | NIH | National Institute of Environmental Health Sciences (NIEHS)
- T32 GM136554/GM/NIGMS NIH HHS/United States
- RP170005, RP210227, RP200504/Cancer Prevention and Research Institute of Texas (CPRIT)
- U19 AI144297/AI/NIAID NIH HHS/United States
- R21-A1132985, PO1-AI057788, AI144297, AI116497/HHS | NIH | National Institute of Allergy and Infectious Diseases (NIAID)
- P42 ES027725/ES/NIEHS NIH HHS/United States
- P30 DK056338/DK/NIDDK NIH HHS/United States
- S10 OD030414/OD/NIH HHS/United States
- T32GM136554/HHS | NIH | National Institute of General Medical Sciences (NIGMS)
- S10 RR024574/RR/NCRR NIH HHS/United States
- P50MD015496/HHS | NIH | National Institute on Minority Health and Health Disparities (NIMHD)
- Research Starter Grant in Translational Medicine/Pharmaceutical Research and Manufacturers of America Foundation (PhRMAF)
- K08 DK131326/DK/NIDDK NIH HHS/United States
- U19 AI116497/AI/NIAID NIH HHS/United States
- S10 OD028480/OD/NIH HHS/United States
- P30 ES030285/ES/NIEHS NIH HHS/United States
- P30 CA125123/CA/NCI NIH HHS/United States
- DK056338, 1K08DK131326/HHS | NIH | National Institute of Diabetes and Digestive and Kidney Diseases (NIDDK)
- P50 MD015496/MD/NIMHD NIH HHS/United States
- P01 AI057788/AI/NIAID NIH HHS/United States
LinkOut - more resources
Full Text Sources
Molecular Biology Databases
