Case Reports
. 2024 Sep 2;221(9):e20232167.
doi: 10.1084/jem.20232167. Epub 2024 Jul 2.

A novel STING variant triggers endothelial toxicity and SAVI disease

Affiliations
Case Reports

A novel STING variant triggers endothelial toxicity and SAVI disease

Erika Valeri et al. J Exp Med. .

Abstract

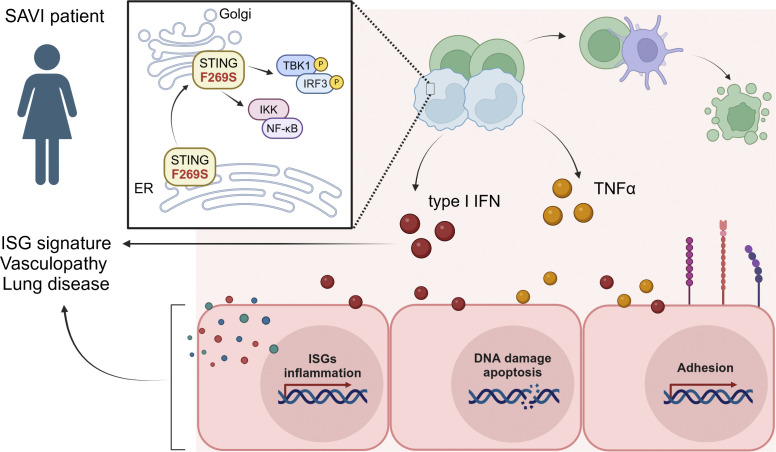
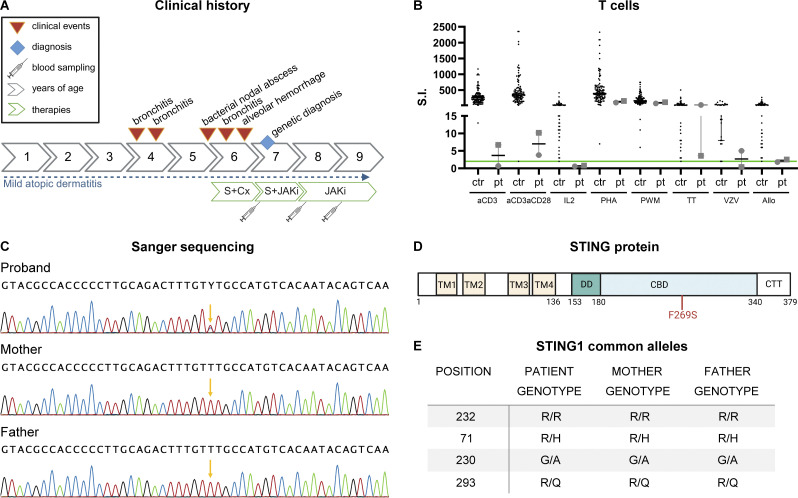
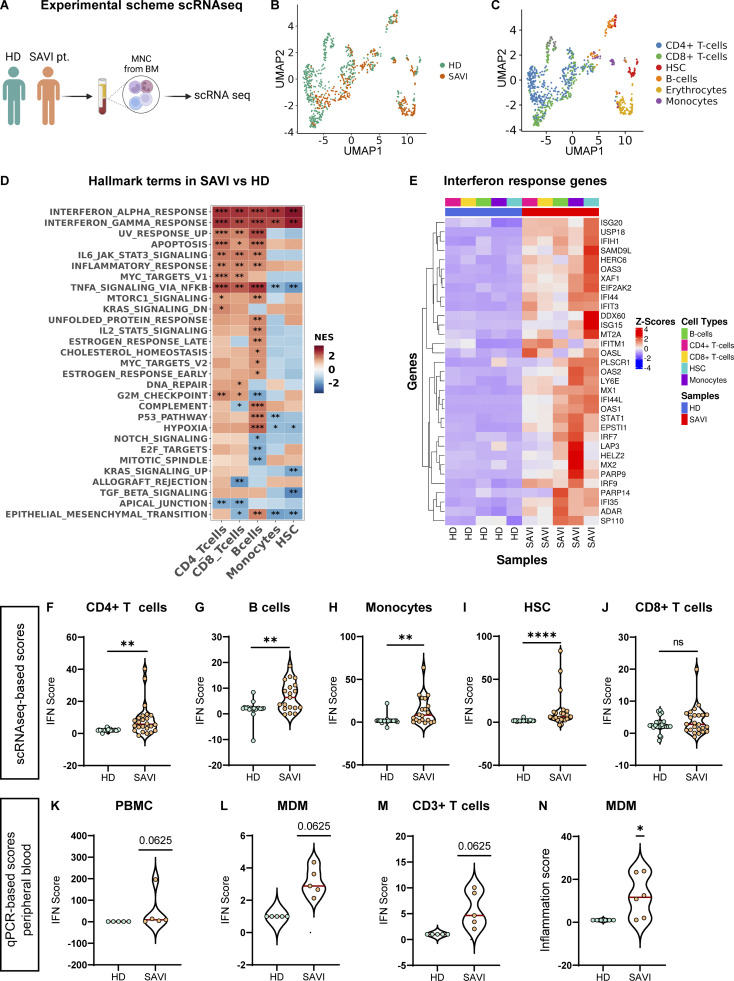
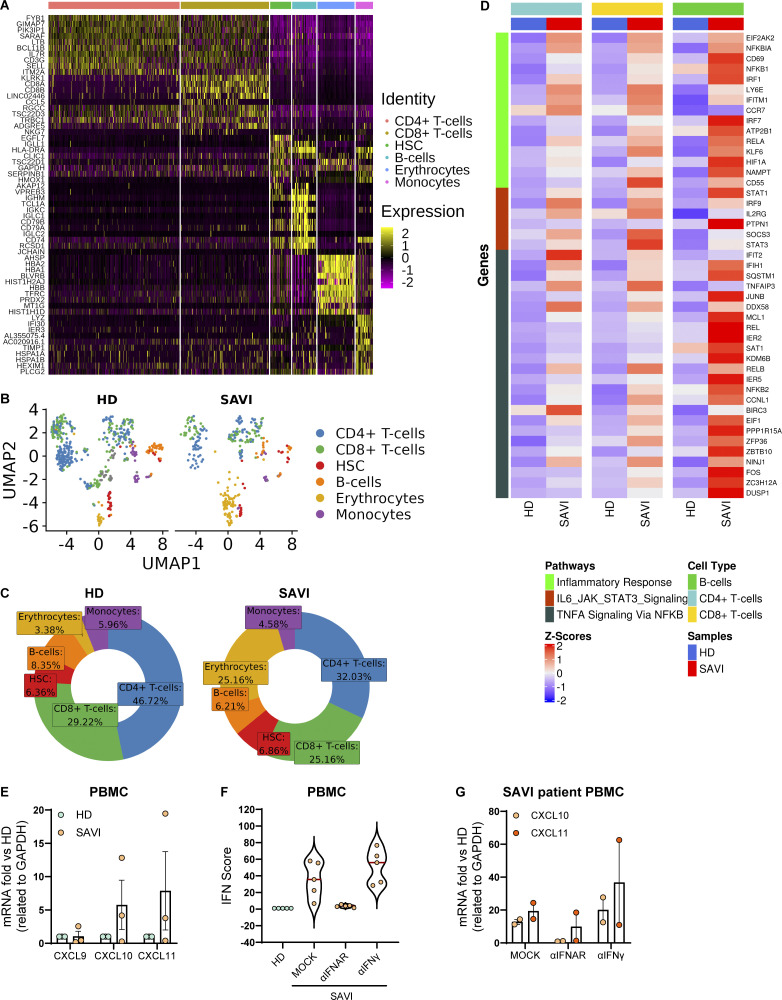
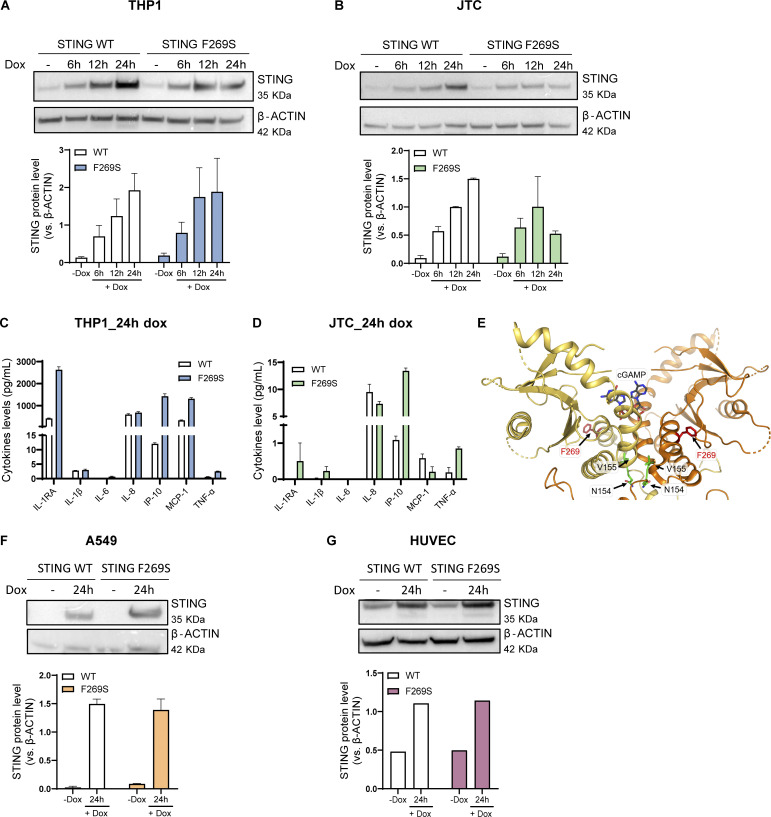
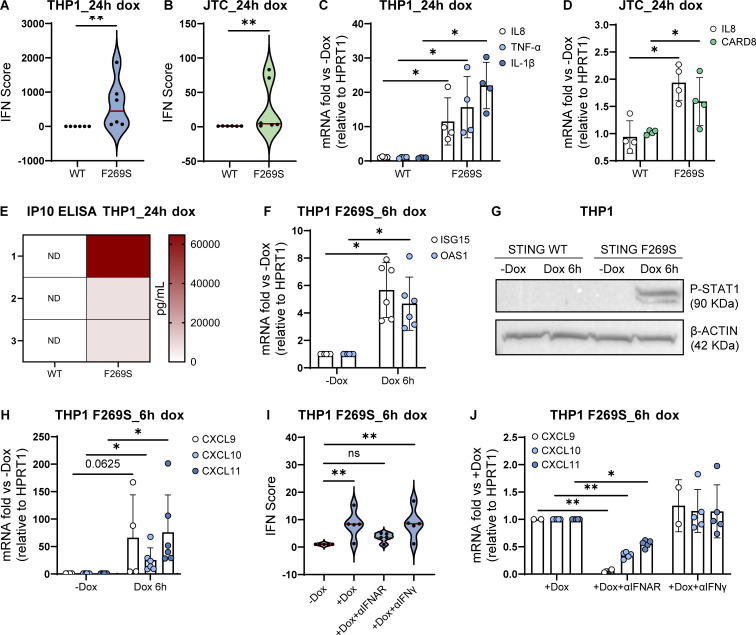
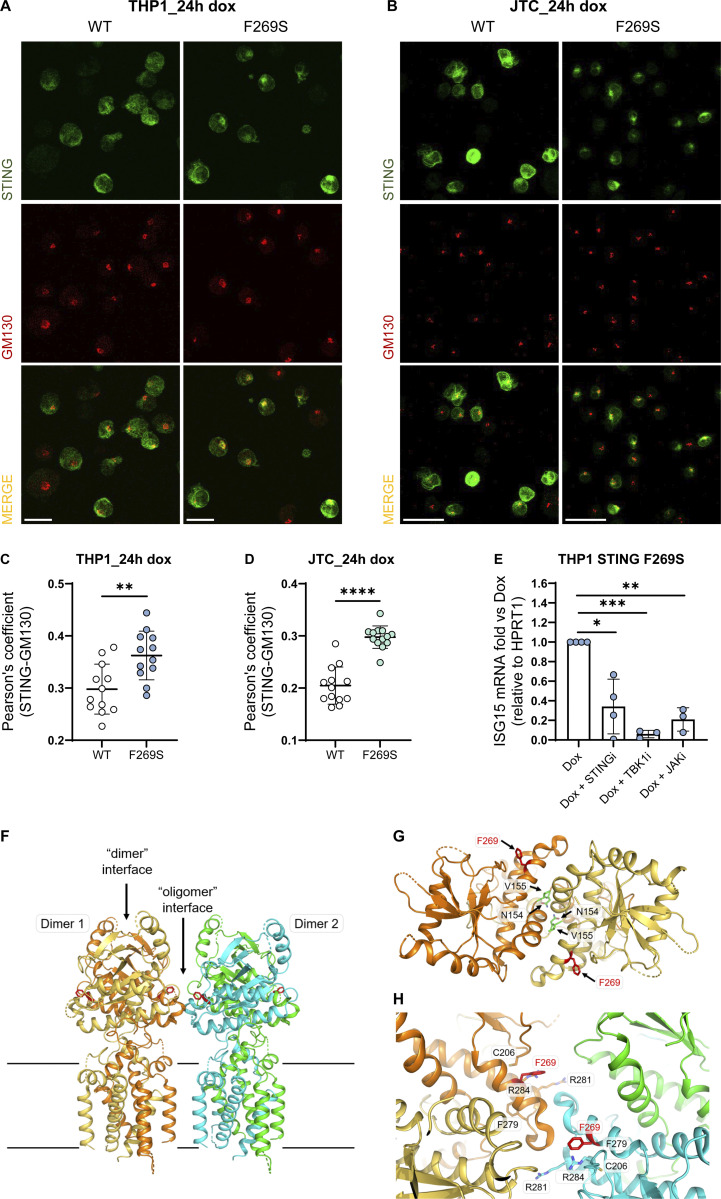
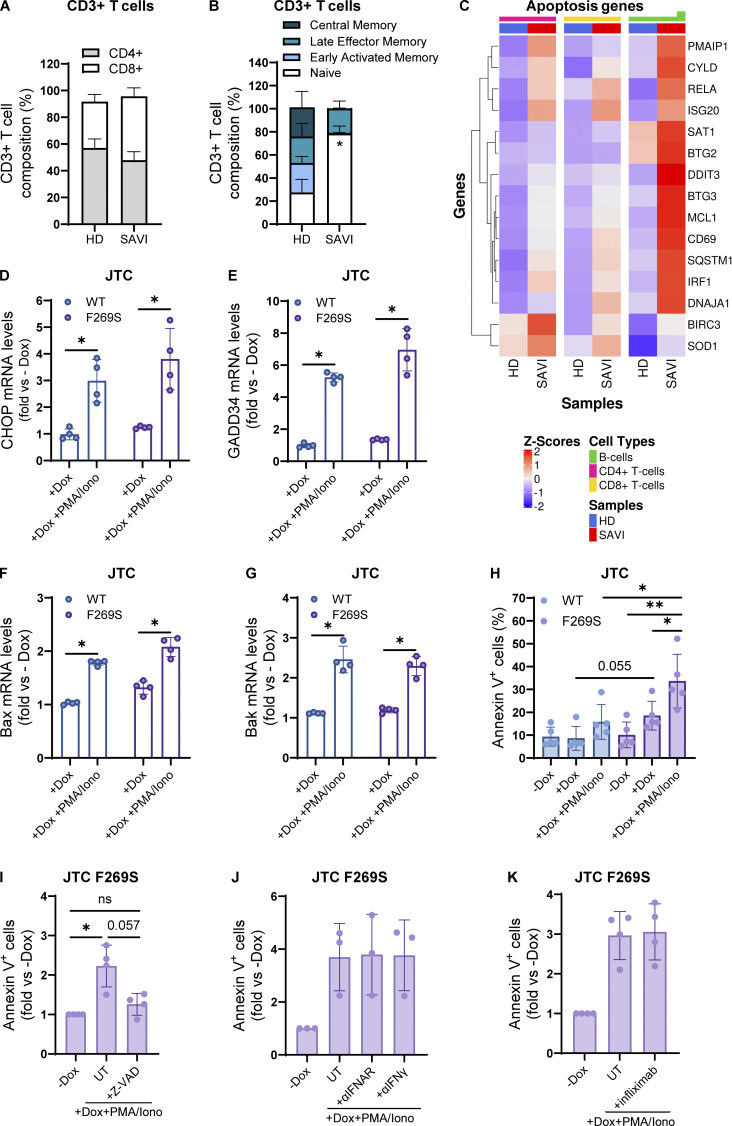
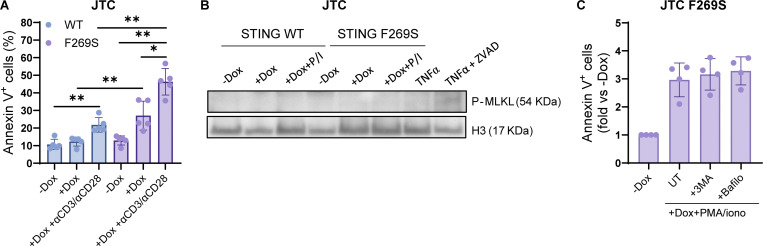
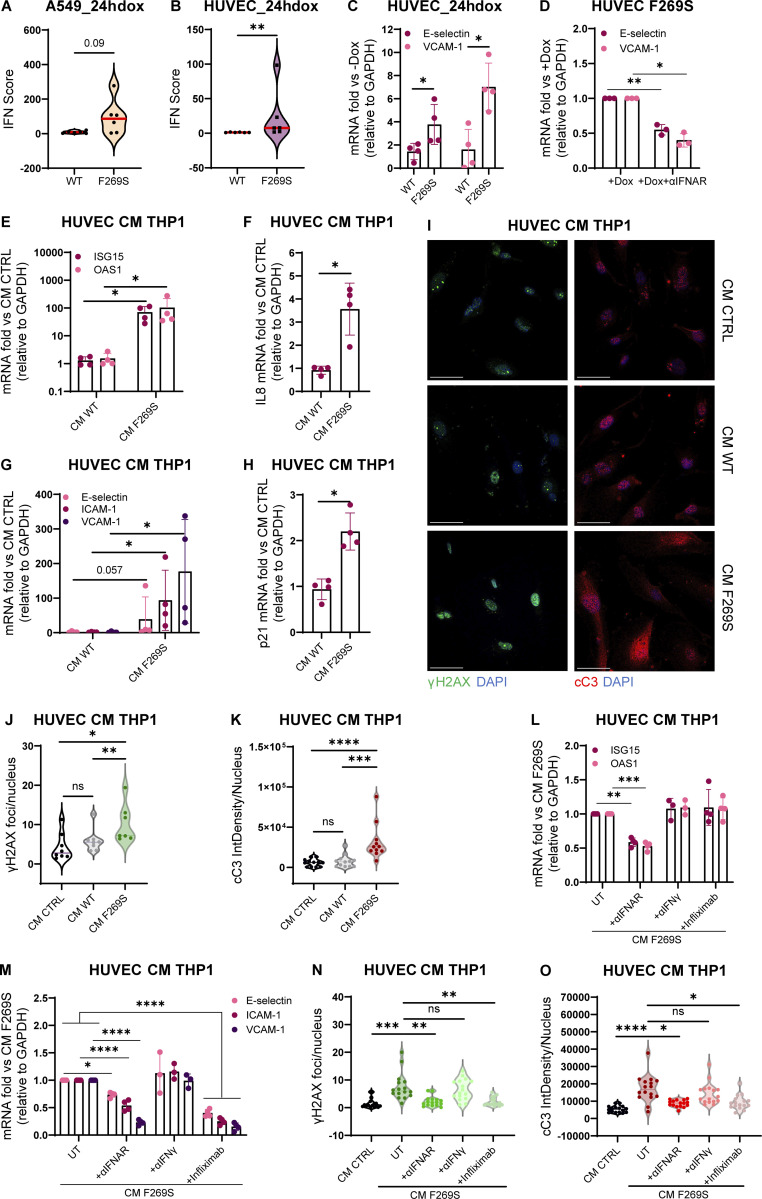
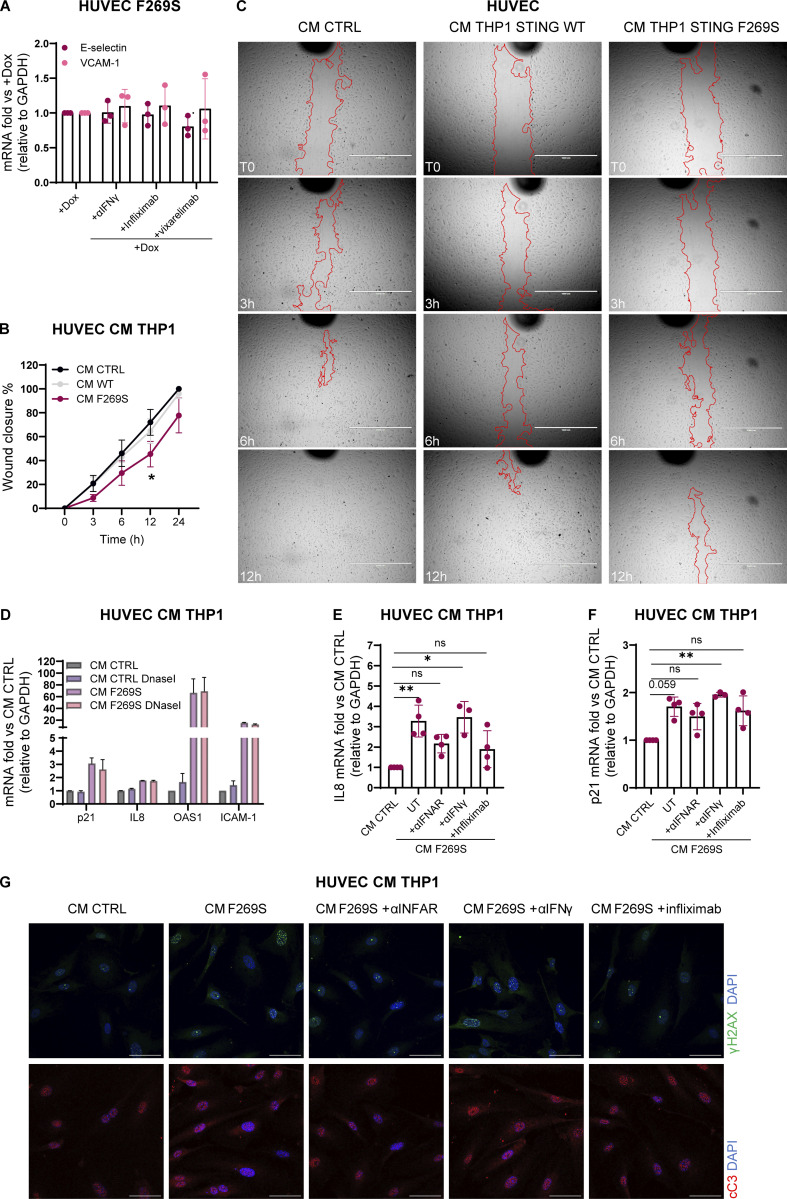
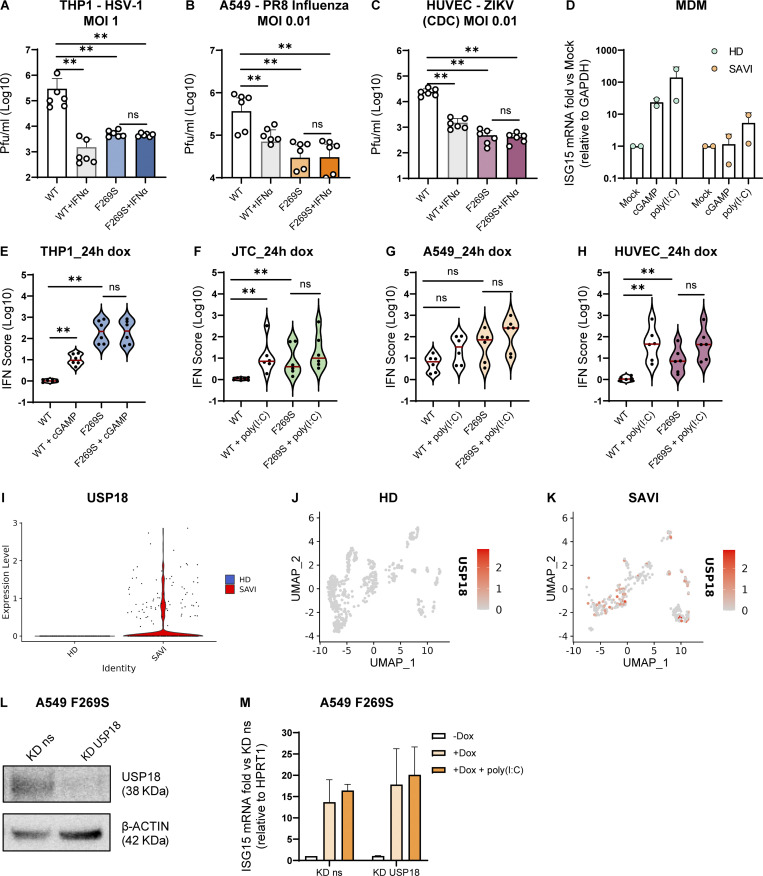
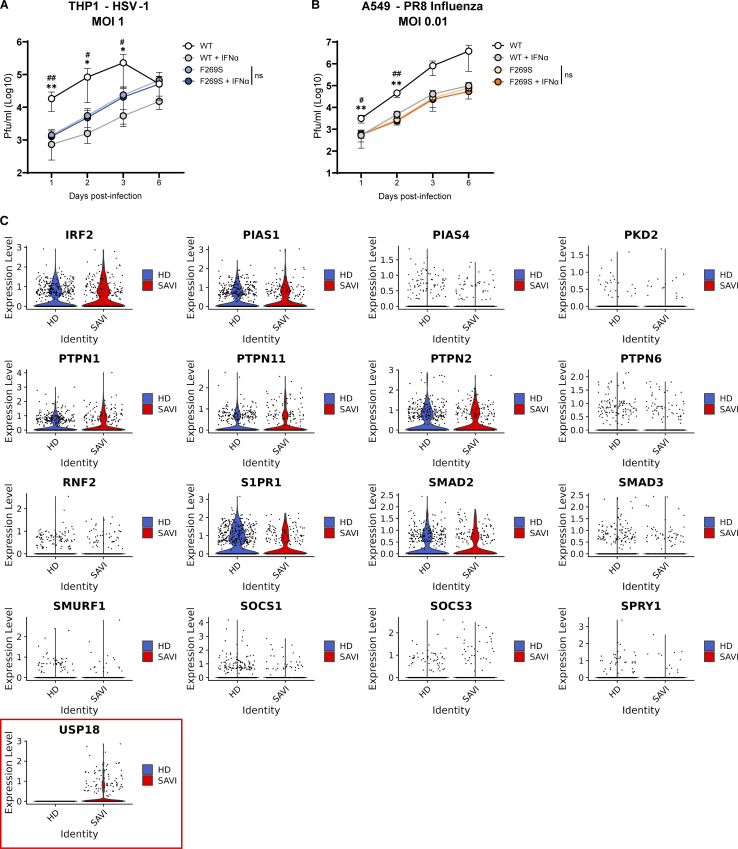
Gain-of-function mutations in STING cause STING-associated vasculopathy with onset in infancy (SAVI) characterized by early-onset systemic inflammation, skin vasculopathy, and interstitial lung disease. Here, we report and characterize a novel STING variant (F269S) identified in a SAVI patient. Single-cell transcriptomics of patient bone marrow revealed spontaneous activation of interferon (IFN) and inflammatory pathways across cell types and a striking prevalence of circulating naïve T cells was observed. Inducible STING F269S expression conferred enhanced signaling through ligand-independent translocation of the protein to the Golgi, protecting cells from viral infections but preventing their efficient immune priming. Additionally, endothelial cell activation was promoted and further exacerbated by cytokine secretion by SAVI immune cells, resulting in inflammation and endothelial damage. Our findings identify STING F269S mutation as a novel pathogenic variant causing SAVI, highlight the importance of the crosstalk between endothelial and immune cells in the context of lung disease, and contribute to a better understanding of how aberrant STING activation can cause pathology.


Conflict of interest statement

Disclosures: The authors declare no competing interests exist.

Figures

None
Graphical abstract
Figure 1.
Figure 1.
Clinical presentation of the SAVI patient. (A) Medical history timeline of the patient (S = steroids; Cx = cyclophosphamide; JAKi = JAK inhibitor). (B) Proliferative response to polyclonal mitogens (antiCD3, antiCD3/CD28, IL2) and antigens (TT: tetanus toxoid, VZV: varicella, Allo: alloantigens) of SAVI patient T cells. The response to each stimulus was compared between a control group of healthy individuals (ctr, black) and the patient (pt, gray). The patient has been evaluated before (gray dots) and after (gray squares) therapy. The green line indicates the cut-off for a positive response (S.I. = 2) (n = 30–115 healthy control samples; n = 2 SAVI patient samples). (C) Sanger sequencing highlights the de novo occurring mutation in STING1 gene in the SAVI patient and the WT sequence in her parents. (D) STING protein domains with highlighted the de novo mutation causing SAVI disease in the patient (TM = transmembrane domain; DD = dimerization domain; CBD = c-di-GMP binding domain; CTT = C-terminal tail; created with https://Biorender.com). (E) Genotype of STING1 common alleles in the SAVI patient and her parents.
Figure 2.
Figure 2.
Single-cell transcriptomic reveals spontaneous upregulation of type I IFN and inflammation in patient blood cells. (A) Experimental scheme (created with https://BioRender.com) of the scRNAseq experiment performed on MNC from a BM sample of the SAVI patient and a pediatric HD control (n = 1 experiment). (B and C) UMAP plots showing cells from scRNAseq data of HD and SAVI samples. Cells are annotated by sample type (B) or according to the identified cell types (C). (D) Heatmap visualizing the enriched GSEA terms in the identified cell types against the Hallmark gene set (Molecular Signatures Database). GSEA was performed on logFC reranked gene lists obtained from SAVI gene expression compared with HD within each cell type (NES: normalized enrichment score; weighted Kolmogorov–Smirnov test with Benjamini-Hochberg adjusted P values; *, adjusted P < 0.05; **, adjusted P < 0.01; ***, adjusted P < 0.001). (E) Heatmap showing the expression level of genes belonging to the IFNα/γ pathways in the identified cell types of HD and SAVI samples. Gene expression, in rows, was row-scaled (z-scores) for visualization. (F–J) Violin plots showing the distribution of IFN scores from scRNAseq data in the identified cell populations. Scores were calculated from the expression of 28 ISGs in SAVI patient compared with HD control (Mann–Whitney test; **, P < 0.01; ****, P < 0.0001; ns = non-significant). (K–M) Violin plots showing the distribution of IFN scores measured in the indicated cell populations from qRT-PCR quantification of the median FC of five ISGs in SAVI patient compared with HD control (n = 3 independent experiments; Mann–Whitney test; P value numbers are shown). (N) Violin plots showing the distribution of the inflammation score measured in MDM from qRT-PCR quantification of the median FC of six IRGs in SAVI patients compared with HD control (n = 3 independent experiments; Mann–Whitney test; *, P < 0.05).
Figure S1.
Figure S1.
Spontaneous activation of multiple inflammatory pathways identified by scRNAseq in SAVI patient blood cells. (A) Hierarchically clustered average gene expression heatmap for genes overexpressed across the different cell types grouped according to the Seurat classification. Yellow, high expression; purple, low expression. Scaled-in normalized gene expression data are shown. (B) Cell type–resolved UMAPs showing cells from scRNAseq data of HD and SAVI samples side by side. (C) Donut plots showing the different cell type percentages quantified from single-cell data in HD and SAVI samples. (D) Heatmaps showing the expression of genes from the different GSEA terms identified in the indicated cell population between HD and SAVI. Gene expression, in rows, was row-scaled (z-scores) for visualization. (E) The expression of different IFNγ-induced cytokines was measured by RT-qPCR in the SAVI patient and HD PBMC and expressed as fold versus HD, normalized to the GAPDH housekeeping gene (mean ± SD; n = 3 independent experiments). (F and G) The distribution of the IFN score (F) and the expression of IFNγ-induced cytokines (G) was evaluated in SAVI patient PBMC after 24 h treatment with a neutralizing antibody targeting the αIFNAR or a neutralizing antibody against the IFNγ (αIFNγ) (each dot in Fig. S1 F represents one ISG calculated from one independent experiment; in Fig. S1 G technical duplicates from one independent experiment are shown).
Figure S2.
Figure S2.
Characterization of SAVI (STING F269S) cell lines. (A and B) STING WT and STING F269S protein levels were evaluated in THP1 (A) and JTC (B) by western blot at different time points after dox exposure and quantified using ImageJ (mean ± SEM; n = 2 independent experiments; one representative blot is shown). (C and D) The levels of the indicated cytokines were measured in the supernatant of THP1 (C) and JTC (D) 24 h after dox-induced expression of STING WT or STING F269S by MSD-based assay (mean ± SEM; n = 1 experiment in technical duplicate). (E) Cartoon representation of the soluble portion of dimeric human STING, with cGAMP modeled in its binding site (gray sticks) based on the observed conformation adopted by the ligand in cryo-EM structures of the chick homolog. F269 is shown with red sticks, and interface residues involved in SAVI N154 and V155 are shown with green sticks. (F and G) STING WT and STING F269S protein levels were evaluated in A549 (F) and HUVEC (G) by western blot at 24 h after dox exposure and quantified using ImageJ (mean ± SEM; n = 1–2 independent experiments; one representative blot is shown). Source data are available for this figure: SourceData FS2.
Figure 3.
Figure 3.
STING F269S expression in immune cell lines recapitulates the SAVI patient phenotype. (A and B) Violin plots showing the distribution of the IFN score in THP1 (A) and JTC (B) from qRT-PCR quantification of the median FC of six ISGs 24 h after dox-induced expression of STING WT or STING F269S. Each dot represents one ISG (n = 3 independent experiments; Mann–Whitney test; **, P < 0.01). (C and D) The expression of different inflammatory genes was measured by RT-qPCR 24 h after dox-induced expression of STING WT or STING F269S in THP1 (C) and JTC (D) and expressed as fold versus −dox, normalized to the HPRT1 housekeeping gene (mean ± SD; n = 4 independent experiments; Mann–Whitney test; *, P < 0.05). (E) IP10 levels were measured by ELISA in the supernatant of THP1 24 h after dox induced expression of STING WT or STING F269S (n = 3 independent experiments, ND = not detected). (F) ISGs levels were measured by RT-qPCR 6 h after dox-induced expression of STING F269S in THP1 and expressed as fold versus −dox, normalized to the HPRT1 housekeeping gene (mean ± SD; n = 6 independent experiments; one sample Wilcoxon test; *, P < 0.05). (G) STAT1 phosphorylation was evaluated by western blot in THP1 6 h after dox-induced expression of STING WT or STING F269S. β-ACTIN was used as loading control (n = 2 independent experiments; one representative blot is shown). (H) IFNγ-inducible genes were measured by RT-qPCR 6 h after dox–induced expression of STING F269S in THP1 and expressed as fold versus −dox, normalized to the HPRT1 housekeeping gene (mean ± SD; n = 4/6 independent experiments; one sample Wilcoxon test; *, P < 0.05). (I) Violin plots showing the distribution of the IFN score in THP1 F269S 6 h after treatment with dox ± αIFNAR or αIFNγ. Each dot represents one ISG (n = 4 independent experiments; two-way ANOVA with Dunnett’s multiple comparisons; **, P < 0.01; ns = not significant). (J) IFNγ-inducible genes were measured by RT-qPCR in THP1 F269S 6 h after treatment with dox ± αIFNAR or αIFNγ and expressed as fold versus +dox, normalized to the HPRT1 housekeeping gene (mean ± SD, n = 5 independent experiments; two-way ANOVA with Tukey’s multiple comparisons; *, P < 0.05; **, P < 0.01). Source data are available for this figure: SourceData F3.
Figure 4.
Figure 4.
STING F269S spontaneously translocates to the Golgi. (A and B) Representative IF images acquired using TCS SP5 Leica confocal microscope, 40× with oil on THP1 (A) or JTC (B) 24 h after dox induced expression of STING WT or STING F269S. Colocalization (yellow area) of STING (green) with the Golgi marker GM130 (red) was evaluated (scale bar, 20 μm). (C and D) Quantification of Pearson’s colocalization coefficient between STING and the Golgi marker GM130 was performed on THP1 (C) and JTC (D) 24 h after dox-induced expression of STING WT or STING F269S (mean ± SD; n = 12–13 images acquired from two independent experiments; Mann–Whitney test; **, P < 0.01; ****, P < 0.0001). (E) THP1 STING F269S were treated with dox and the indicated drugs for 24 h, and the expression of ISG15 was measured by RT-qPCR and expressed as fold versus dox, normalized to the HPRT1 housekeeping gene (mean ± SD; n = 3–4 independent experiments; one sample t test; **, P < 0.01; ***, P < 0.001; ns = not significant). (F) Molecular mapping of the F269S mutation on available STING three-dimensional structures. Cartoon representation of the human STING oligomeric ensemble, modelled based on the cryo-EM structure of chick STING oligomers. Each STING monomer is shown using a different color. The black lines indicate the boundaries of the transmembrane region. (G) Residue F269 (displayed as red sticks) localizes far from the STING dimer interface, characterized by the extensively studied mutations involving residues N154 and V155 (displayed as green sticks). (H) F269 localizes at the interface identified in STING oligomeric structures, resulting in contacts involving two distinct STING dimers in close proximity to previously characterized residues C206, F279, R281, and R284.
Figure 5.
Figure 5.
The STING F269S mutation is associated with T cell cytopenia and lack of memory T cell phenotype. (A) The relative percentages of CD4+ and CD8+ T cells was evaluated in HD and SAVI patient CD3+ T cells by FACS at day 5 after in vitro antiCD3/CD28 beads stimulation (mean ± SEM; n = 3 independent experiments). (B) T cell subpopulation composition was evaluated in HD and SAVI patient CD3+ T cells by FACS at day 5 after in vitro antiCD3/CD28 beads stimulation (mean ± SEM; n = 3 independent experiments; unpaired t test; *, P < 0.05). (C) Heatmap showing the expression level of genes belonging to the apoptosis pathway in HD and SAVI B cells, CD4+ and CD8+ T cells from scRNAseq data. Gene expression, in rows, was row-scaled (z-scores) for visualization. (D and E) JTC were treated with dox for 24 h, washed, and stimulated for an additional 24 h with PMA/ionomycin. The expression of the UPR genes CHOP (D) and GADD34 (E) was measured by RT-qPCR and expressed as fold versus −dox, normalized to the HPRT1 housekeeping gene (mean ± SD; n = 4 independent experiments; Mann–Whitney test; *, P < 0.05). (F and G) JTC were treated with dox for 24 h, washed, and stimulated for additional 24 h with PMA/ionomycin. The expression of the pro apoptotic genes Bax (F) and Bak (G) was measured by RT-qPCR and expressed as fold versus −dox, normalized to the HPRT1 housekeeping gene (mean ± SD; n = 4 independent experiments; Mann–Whitney test; *, P < 0.05). (H) JTC were treated with dox for 24 h, washed, and stimulated for an additional 24 h with PMA/ionomycin. The percentage of apoptotic cells was evaluated by FACS (mean ± SD; n = 5 independent experiments; Mann–Whitney test; *, P < 0.05; **, P < 0.01). (I) JTC were treated with dox for 24 h, washed, and stimulated for an additional 24 h with PMA/ionomycin in the presence or not of the pan caspase inhibitor Z-VAD. The percentage of apoptotic cells was evaluated by FACS and expressed in fold versus −dox (mean ± SD; n = 4 independent experiments; one sample Wilcoxon test versus −dox = 1; *, P < 0.05; ns = not significant; Mann–Whitney test between −/+Z-VAD comparison; P value number is shown). (J and K) JTC were treated with dox for 24 h, washed, and stimulated for additional 24 h with PMA/ionomycin in the presence or not of the indicated inhibitors. The percentage of apoptotic cells was evaluated by FACS and expressed in fold versus −dox (mean ± SD; n = 3 independent experiments for J; n = 4 independent experiments for K).
Figure S3.
Figure S3.
The STING F269S mutation is associated with T cell cytopenia and lack of memory T cell phenotype. (A) JTC were treated with dox for 24 h, washed, and stimulated for additional 24 h with anti-CD3, anti-CD28 antibodies. The percentage of apoptotic cells was evaluated by FACS (mean ± SD; n = 5 independent experiments; Mann–Whitney test; *, P < 0.05; **, P < 0.01). (B) MLKL phosphorylation was evaluated by western blot in JTC treated with dox for 24 h and stimulated for additional 24 h with PMA/ionomycin (P/I). JTC treated with TNFα ± ZVAD were added as the positive control. H3 was used as loading control (n = 2 independent experiments; one representative blot is shown). (C) JTC were treated with dox for 24 h, washed, and stimulated for additional 24 h with PMA/ionomycin in the presence or not of the indicated autophagy inhibitors. The percentage of apoptotic cells was evaluated by FACS and expressed in fold versus –dox (mean ± SD; n = 4 independent experiments). Source data are available for this figure: SourceData FS3.
Figure 6.
Figure 6.
STING F269S immune cell secretome promotes endothelial cells activation and damage. (A and B) Violin plots showing the distribution of the IFN score in A549 (A) and HUVEC (B) from qRT-PCR quantification of the median FC of six ISGs 24 h after dox induced expression of STING WT or STING F269S. Each dot represents one ISG (n = 3 independent experiments; Mann–Whitney test; **, P < 0.01). (C) The expression of adhesion molecules was evaluated in HUVEC 24 h after dox induced expression of STING WT or STING F269S by qRT-PCR and expressed as fold versus −dox, normalized to the GAPDH housekeeping gene (mean ± SD; n = 4 independent experiments; Mann–Whitney test; *, P < 0.05). (D) The expression of adhesion molecules was evaluated in HUVEC F269S 24 h after dox treatment ± αIFNAR and expressed as fold versus +dox, normalized to the GAPDH housekeeping gene (mean ± SD; n = 3 independent experiments; one sample t test; *, P < 0.05; **, P < 0.01). (E–H) The expression of ISGs (E), inflammatory gene (F), endothelial adhesion markers (G), and p21 DNA damage marker (H) was measured by RT-qPCR in HUVEC cells 24 h after exposure to CM from THP1 STING WT or STING F269S and expressed as fold versus control medium (CM CTRL), normalized to the GAPDH housekeeping gene (mean ± SD; n = 4 independent experiments; Mann–Whitney test; *, P < 0.05). (I) Representative IF images acquired using Olympus FluoVIEW 3000 RS confocal microscope, 60× with oil, on HUVEC cells 24 h after exposure to CM from THP1 STING WT or STING F269S stained for γH2AX or cC3 (scale bar, 50 μm). (J and K) The number of γH2AX foci (J) and integrated density of cC3 signal (K) were quantified by ImageJ (n = 7–8 images from two independent experiments for γH2AX; n = 11–12 images from three independent experiments for cC3; Mann–Whitney test; *, P < 0.05; **, P < 0.01; ***, P < 0.001; ****, P < 0.0001; ns = not significant). (L and M) CM from THP1 STING F269S were added to HUVEC cells in combination with the indicated drugs for 24 h. The expression of ISGs (L) and endothelial adhesion markers (M) was measured by RT-qPCR in HUVEC cells and expressed as fold versus CM F269S UT, normalized to the GAPDH housekeeping gene (mean ± SD; n = 3–4 independent experiments; two-way ANOVA with Tukey’s multiple comparisons; *, P < 0.05; **, P < 0.01; ***, P < 0.001; ****, P < 0.0001). (N and O) HUVEC cells were exposed for 24 h to CM from THP1 STING F269S in combination with the indicated drugs or control CM. The number of γH2AX foci (N) and the integrated density of cC3 signal (O) were quantified by ImageJ (n = 16 images from 2 independent experiments; Kruskal–Wallis test with Dunn’s multiple comparisons; *, P < 0.05; **, P < 0.01; ***, P < 0.001; ****, P < 0.0001; ns = not significant).
Figure S4.
Figure S4.
Impact of SAVI immune cells secretome on endothelial cells. (A) The expression of adhesion molecules was evaluated in HUVEC F269S 24 h after dox treatment in the presence or not of the indicated drugs and expressed as fold versus +dox, normalized to the GAPDH housekeeping gene (mean ± SD; n = 3 independent experiments). (B) HUVEC cells were exposed for 24 h to CM from THP1 STING WT or STING F269S. A scratch wound assay was then performed, and the percentage of wound closure was evaluated at indicated time points after the scratch (mean ± SD; n = 5 independent experiments; two-way ANOVA versus CM CTRL; *, P < 0.05). (C) Representative bright-field images of scratch-wound closure from one of the experiments shown in Fig. S4 B monitored over time in HUVEC cells upon exposure to CM derived from THP1 STING WT, THP1 STING F269S, or to control CM (n = 1 of 5 independent experiments is shown; scale bar, 1,000 μm). (D) CM from THP1 STING F269S or control CM were treated for 30′ with DnaseI before addition to HUVEC cells. The expression of selected genes was measured by RT-qPCR in HUVEC cells 24 h after exposure to CM and expressed as fold versus CM CTRL, normalized to the GAPDH housekeeping gene (mean ± SD; n = 2 independent experiments). (E and F) CM from THP1 STING F269S were added to HUVEC cells in combination with the indicated drugs for 24 h. The expression of IL8 (E) and p21 (F) was measured by RT-qPCR in HUVEC cells and expressed as fold versus CM CTRL, normalized to the GAPDH housekeeping gene (mean ± SD; n = 3–4 independent experiments; Kruskal–Wallis test with Dunn’s multiple comparisons; *, P < 0.05; **, P < 0.01; ns = not significant). (G) Representative IF images were acquired using Olympus FluoVIEW 3000 RS confocal microscope, 60× with oil, on HUVEC cells 24 h after exposure to CM CTRL or CM from THP1 STING F269S and the indicated drugs, stained for γH2AX or cC3. Quantifications are shown in Fig. 6, N and O (scale bar, 50 μm).
Figure 7.
Figure 7.
SAVI patient cells are less susceptible to viral infection but hyporesponsive to exogenous immune priming. (A–C) THP1 (A), A549 (B), and HUVEC (C) were prestimulated or not with IFNα for 16 h and then inoculated with the indicated infectious viruses. Viral supernatant was collected at 3 days after infection and titered on Vero cells (for HSV-1 and ZIKV) or MDCK cells (for IAV) (mean ± SD; n = 3 independent experiments; Mann–Whitney test; **, P < 0.01; ns = non-significant). (D) MDM from the SAVI patient and HD controls were stimulated with poly(I:C) or 2′3′cGAMP, and ISG15 level was measured at 24 h by qRT-PCR and expressed as fold versus mock, normalized to the GAPDH housekeeping gene (mean ± SD; n = 2 independent experiments). (E–H) Cells were treated with dox and stimulated with cGAMP or poly(I:C) for 24 h. The IFN score was calculated 24 h after dox administration in THP1 (E), JTC (F), A549 (G), and HUVEC (H) from qRT-PCR quantification of the median FC of six ISGs. Each dot represents one ISG (n = 3 independent experiments; Mann–Whitney test; **, P < 0.01; ns = not significant) (violin plots showing IFN score without stimulation are reported also in Fig. 3, A and B; and Fig. 6, A and B). (I) Violin plot showing the normalized expression level of USP18 from scRNAseq data in SAVI and HD samples. (J and K) UMAP showing the expression level and distribution of USP18 gene in HD (J) and SAVI (K) samples from scRNAseq data. (L) A549 STING F269S were transfected with siRNA targeting USP18 or a non-silencing (ns) siRNA control. Knock-down (KD) efficiency of USP18 was verified after 48 h by western blot. β-ACTIN was used as loading control (n = 2 independent experiments; one representative blot is shown). (M) A549 STING F269S were treated with dox and stimulated or not with poly(I:C) for 24 h. ISG15 level was measured by RT-qPCR and expressed as fold versus KD ns −dox, normalized to the HPRT1 housekeeping gene (mean ± SD; n = 3 independent experiments). Source data are available for this figure: SourceData F7.
Figure S5.
Figure S5.
Negative regulators of type I IFN response in HD and SAVI cells from scRNAseq data. (A and B) Kinetics of HSV-1 replication in THP1 (A) and IAV replication in A549 (B) infected at the indicated MOI. Cells were pre-stimulated or not with IFNα for 16 h and then inoculated with the indicated infectious viruses. Supernatants were collected at 1, 2, 3, and 6 days after infection and titered on Vero cells (for HSV-1) or MDCK cells (for IAV) (mean ± SD; n = 3 independent experiments in technical triplicate for A; n = 2 independent experiments in technical triplicate for B; two-way ANOVA with Tukey’s multiple comparisons; * indicates statistical significance between WT and WT+IFNα; *, P < 0.05; **, P < 0.01; # indicates statistical significance between WT and F269S; #, P < 0.05; ##, P < 0.01; ns = not significant). (C) Violin plot panels showing the normalized expression level of indicated genes from scRNAseq data in SAVI and HD samples. Violin plot in the red square is also shown in Fig. 7 I.

Similar articles

Cited by

References

    1. Abe, T., and Barber G.N.. 2014. Cytosolic-DNA-mediated, STING-dependent proinflammatory gene induction necessitates canonical NF-κB activation through TBK1. J. Virol. 88:5328–5341. 10.1128/JVI.00037-14 - DOI - PMC - PubMed
    1. Abe, T., Harashima A., Xia T., Konno H., Konno K., Morales A., Ahn J., Gutman D., and Barber G.N.. 2013. STING recognition of cytoplasmic DNA instigates cellular defense. Mol. Cell. 50:5–15. 10.1016/j.molcel.2013.01.039 - DOI - PMC - PubMed
    1. Aran, D., Looney A.P., Liu L., Wu E., Fong V., Hsu A., Chak S., Naikawadi R.P., Wolters P.J., Abate A.R., et al. . 2019. Reference-based analysis of lung single-cell sequencing reveals a transitional profibrotic macrophage. Nat. Immunol. 20:163–172. 10.1038/s41590-018-0276-y - DOI - PMC - PubMed
    1. Arimoto, K.I., Miyauchi S., Stoner S.A., Fan J.B., and Zhang D.E.. 2018. Negative regulation of type I IFN signaling. J. Leukoc. Biol. 103:1099–1116. 10.1002/JLB.2MIR0817-342R - DOI - PubMed
    1. Balka, K.R., Venkatraman R., Saunders T.L., Shoppee A., Pang E.S., Magill Z., Homman-Ludiye J., Huang C., Lane R.M., York H.M., et al. . 2023. Termination of STING responses is mediated via ESCRT-dependent degradation. EMBO J. 42:e112712. 10.15252/embj.2022112712 - DOI - PMC - PubMed

Publication types

MeSH terms