. 2024 Jul 2;9(15):e167967.
doi: 10.1172/jci.insight.167967.

Iron capture through CD71 drives perinatal and tumor-associated Treg expansion

Affiliations

Iron capture through CD71 drives perinatal and tumor-associated Treg expansion

Ilenia Pacella et al. JCI Insight. .

Abstract

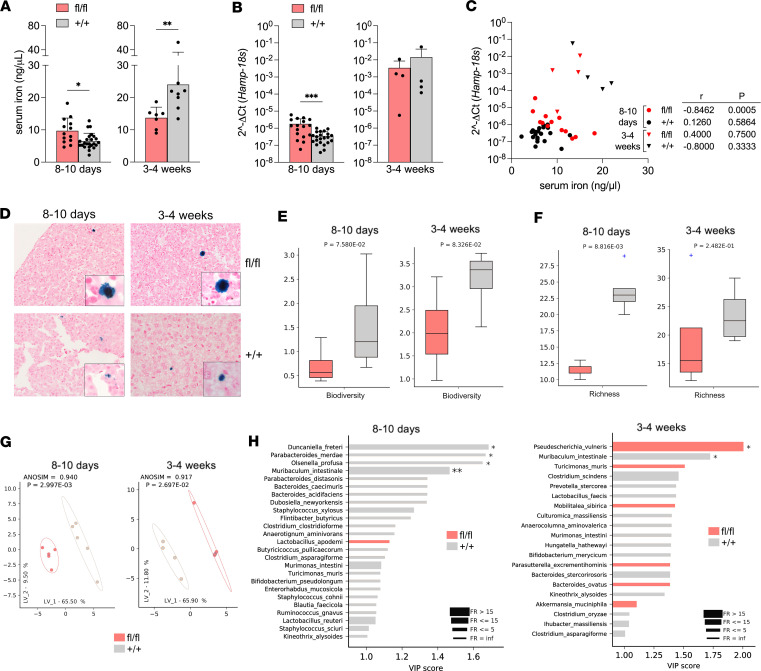
Besides suppressing immune responses, regulatory T cells (Tregs) maintain tissue homeostasis and control systemic metabolism. Whether iron is involved in Treg-mediated tolerance is completely unknown. Here, we showed that the transferrin receptor CD71 was upregulated on activated Tregs infiltrating human liver cancer. Mice with a Treg-restricted CD71 deficiency spontaneously developed a scurfy-like disease, caused by impaired perinatal Treg expansion. CD71-null Tregs displayed decreased proliferation and tissue-Treg signature loss. In perinatal life, CD71 deficiency in Tregs triggered hepatic iron overload response, characterized by increased hepcidin transcription and iron accumulation in macrophages. Lower bacterial diversity, and reduction of beneficial species, were detected in the fecal microbiota of CD71 conditional knockout neonates. Our findings indicate that CD71-mediated iron absorption is required for Treg perinatal expansion and is related to systemic iron homeostasis and bacterial gut colonization. Therefore, we hypothesize that Tregs establish nutritional tolerance through competition for iron during bacterial colonization after birth.

Keywords: Immunology; Metabolism; T cells; Tolerance.


Conflict of interest statement

Conflict of interest: The authors have declared that no conflict of interest exists.

Figures

Figure 1
Figure 1. Human Tregs express CD71 when activated in vitro or in vivo in tumor.
(A) OX40+/OX40 CD45RAlo Tregs and conventional T cells (Tconvs) were sorted from the peripheral blood (PB) or cirrhosis/tumor (CT) of 5 patients with HCC, and gene expression analysis was performed (12). The heatmap displays the fold-change over the respective control (OX40 Tconvs or Tregs in PB) in the genes accounting for the pathway of interest, showing statistically significant enrichment (Reactome, P < 0.05). (B and C) Representative plots (upper panel) and cumulative data (lower panel) showing CD71 expression (B) or CD71+Ki67+ percentage (C) in the indicated cell subsets (CD45RAlo) from matched samples of PB or tumor (TUM) from patients with HCC (n = 13). Numbers in the histogram plot indicate the geometric mean fluorescence intensity (gMFI) of CD71. *P < 0.05, ***P < 0.005, by Wilcoxon’s matched pairs signed rank test. (D) Spearman’s correlation between CD71 expression in the indicated cell subsets from TUM samples, and serum iron concentrations, in patients with HCC (n = 5). (E) Immunofluorescence of CD71 and FOXP3 in a representative HCC sample. Original magnification, 63×. (F) Fluorescent transferrin internalization in the indicated cell subsets from representative HCC sample. Numbers indicate the gMFI. (G) Expression of CD71 and OX40 on Tregs from PB of a representative healthy donor (HD), either freshly isolated (PRE) or after 2 weeks’ expansion in vitro (POST). (H) In vitro–expanded and CellTrace Violet–labeled (CTV-labeled) Tregs (shown in red) were tested in standard suppression assay at different ratios against autologous CFSE-labeled Tconvs (blue), plus anti-CD71 blocking mAb or isotype control. Representative profiles of dye dilution (left panel) and cumulative analysis of proliferating cell percentages (right panel) are shown. Ratios indicate the Treg/Tconv proportions. Data shown are from a representative HD out of 2. Each condition was tested in 2–4 replicates. Bars indicate means ± SD. *P < 0.05, ***P < 0.005, by Student’s t test, unpaired.
Figure 2
Figure 2. Treg-restricted CD71 deficiency induces a scurfy-like disease.
(A) Survival curve of Foxp3Cre Tfrcfl/fl mice (fl/fl, red), compared with Foxp3Cre Tfrc+/+ littermates (+/+, black). ***P < 0.005. (B and C) Pictures of representative mice (B) and spleen and inguinal lymph nodes (C) for each genotype, at 3–4 weeks of age. (D) Hematoxylin-eosin staining from 1 mouse out of 3 for each genotype. Original magnification, 20×. (E) CD44/CD62L expression in gated Tconvs (CD4+YFP) or CD8+ T cells in a representative spleen. (F) IFN-γ and IL-17 production by Tconvs (CD4+YFP) in a representative spleen. (G and H) Representative contour plots (G) and cumulative analysis (H) of CD71+ and CD71 YFP+ percentages in the spleen (n = 5/group). Bars indicate means ± SD. **P < 0.01, by Mann-Whitney U test.
Figure 3
Figure 3. CD71 is involved in Treg perinatal expansion in both mice and humans.
(A and B) Representative contour plots (A) and cumulative analysis (B) showing Treg (YFP+Foxp3+) percentages, and CD71+ percentages in gated Tregs, among TCRβ+CD3+CD4+CD8 single-positive (SP) cells from thymus (THY), or among TCRβ+CD3+CD4+ T cells from liver (LIV), of Foxp3Cre/Y Tfrcfl/fl male mice (fl/fl, red), compared with Foxp3Cre/Y Tfrc+/+ male littermates (+/+, gray), aged 8–10 days. Data are from 7–10 samples/group, pooled from 2 independent experiments. Bars indicate means ± SD. *P < 0.05, **P < 0.01, ****P < 0.0001, by ordinary 2-way ANOVA with Tukey’s multiple comparisons test. nd, not determined. (C and D) Representative plots (C) and cumulative analysis (D) of percentages of Tconvs (CD127hiCD25lo), Teffs (CD127hiCD25int), and Tregs (CD127loCD25hi) from PB of human preterm neonates (n = 53), collected at 0–3, 7–10, or 28–31 days after birth. (E and F) Representative plots (E) and cumulative analysis (F) of CD71+Ki67+ cell percentages in gated Tconvs (blue), Teffs (green), and Tregs (red), in a representative sample at day 10. Fluorescence minus one (FMO) control in each gate is shown. *P < 0.05, ***P < 0.005, by Wilcoxon’s matched pairs signed rank test. (G) Spearman’s correlation between CD71+Ki67+ frequency in Tregs, and serum iron concentrations in neonates, at 7–10 (n = 7) or 28–31 (n = 18) days after birth.
Figure 4
Figure 4. CD71 sustains Treg metabolic fitness in a cell-intrinsic fashion in healthy mosaic females.
(AC) Representative contour plots (A and B) and cumulative analysis (C) of YFP and YFP+ Foxp3+ percentages in gated CD4+ T cells (A), and CD71+ YFP and YFP+ percentages in gated Foxp3+ (B), from the spleens of Foxp3Cre/+ Tfrcfl/fl (fl/fl, red) and Foxp3Cre/+ Tfrc+/+ (+/+, gray) female littermates, aged 8–12 weeks. Data are from 7 samples/group, pooled from 2 independent experiments. Bars indicate means ± SD. *P < 0.05, ***P < 0.005, by Mann-Whitney test. (D and E) CTV dilution (D) and MDR staining (E) in gated YFP+ from CD4+ T cells isolated from the spleens of Foxp3Cre/+ Tfrcfl/fl or Tfrc+/+ females and polyclonally stimulated in vitro for 3–4 days. Numbers indicate the gMFI. Data shown are from 1 representative out of 2 independent experiments. Each condition was tested in triplicates. Bars indicate means ± SD. *P < 0.05, by Student’s t test, unpaired. (FH) CD4+YFP+ cells were sorted from spleens of Foxp3Cre/+ Tfrcfl/fl (fl/fl) or Foxp3Cre/+ Tfrc+/+ (+/+) female littermates of 8–12 weeks of age and cultured in vitro for 18 hours with coated anti-CD3 and IL-2. (F) TMRM staining, performed in quenching mode. The percentages of TMRM cells, corresponding to cells with hyperpolarized mitochondria, are shown. Insets display negative (FMO) and positive (FCCP-treated) controls. (G) MitoSOX staining, expressed as gMFI. (H) Frequency of pS6+ cells. Data are from 1 experiment representative of 2. Each condition was tested in 2–3 replicates. *P < 0.05, **P < 0.01, by unpaired Student’s t test.
Figure 5
Figure 5. CD71 deficiency compromises tissue Treg development.
(A) Volcano plot showing the fold-change in gene expression by RNA-Seq of CD4+YFP+ cells sorted from spleens (n = 3/group) of Foxp3Cre/+ Tfrcfl/fl (fl/fl) and Foxp3Cre/+ Tfrc+/+ (+/+) female littermates, aged 8–12 weeks. Genes with FDR < 0.05 and with fold-change > 2 (red) or <–2 (blue) in fl/fl versus +/+ are highlighted. (B) Gene set enrichment analysis of the transcriptome of Foxp3Cre/+ Tfrcfl/fl versus Tfrc+/+ Tregs. Gene sets were obtained from published signatures of perinatal Tregs (7), γREG+ (9), tissue Tregs (32), or tumor Tregs (33). Normalized enrichment scores (NES) and FDR q values are shown under each plot. (C) Representative plots of the analysis of the colonic LP of Foxp3Cre/+ Tfrcfl/fl and Tfrc+/+ female mice, showing YFP+ in gated CD4+ T cells (left panels) or KLRG1+ST2+ (middle panels) or CD44+CCR8+ (right panels) tissue Tregs in gated YFP+ cells. (DF) Percentages of YFP+ cells (D) or KLRG1+ST2+ (E) or CD44+CCR8+ (F) tissue Tregs in gated YFP+ cells, in spleen (SPL), inguinal lymph node (LN), VAT, liver (LIV), and colonic LP. Data are from 6 samples/group, pooled from 2 independent experiments. Bars indicate means ± SD. *P < 0.05, ***P < 0.005, by Mann-Whitney test. nd, not determined.
Figure 6
Figure 6. Treg-intrinsic CD71 deficiency affects systemic iron status and gut microbial colonization.
(A) Systemic iron concentration in the serum of Foxp3Cre/Y Tfrcfl/fl (fl/fl, red), and Foxp3Cre/Y Tfrc+/+ (+/+, gray) male littermates, at 8–10 days or 3–4 weeks of age. (B) Hamp gene expression by real-time reverse transcription PCR (RT-PCR) in whole liver extracts. Data are from 4–24 samples/group, pooled from 3 independent experiments. Bars indicate means ± SD. *P < 0.05, **P < 0.01, ***P < 0.005, by Mann-Whitney test. (C) Spearman’s correlation between serum iron and hepatic Hamp expression. (D) Perls Prussian blue staining in liver specimens of Foxp3Cre/Y Tfrcfl/fl or Tfrc+/+ males at 8–10 days or 3–4 weeks of age. Representative images of 2–4 mice/group are shown. Original magnification, 10×. Insets, 40×. (EG) α Diversity measurements of biodiversity (Shannon, E) and richness (observed operational taxonomic units, F) and partial least-squares discriminant analysis (PLS-DA) (G), of the microbial species identified through 16s rRNA gene sequencing of DNA extracted from stools of Foxp3Cre/Y Tfrcfl/fl (red) or Tfrc+/+ (gray) males at 8–10 days or 3–4 weeks of age (n = 4–5 mice/group). Box plots show the interquartile range, median (line), and minimum and maximum (whiskers). (H) Variable importance plot (VIP) describing the most discriminant species in descending order of importance. Each bar reports the following information: (i) length, VIP score; (ii) bar color, cohort in which the species has the highest average relative abundance (high); (iii) thickness, fold ratio (FR) among the 2 groups considered; (iv) significance of Mann-Whitney U test between high and low (*P < 0.05, **P < 0.01).

References

    1. Ramsdell F, Ziegler SF. FOXP3 and scurfy: how it all began. Nat Rev Immunol. 2014;14(5):343–349. doi: 10.1038/nri3650. - DOI - PubMed
    1. Munoz-Rojas AR, Mathis D. Tissue regulatory T cells: regulatory chameleons. Nat Rev Immunol. 2021;21(9):597–611. doi: 10.1038/s41577-021-00519-w. - DOI - PMC - PubMed
    1. Fontenot JD, et al. Developmental regulation of Foxp3 expression during ontogeny. J Exp Med. 2005;202(7):901–906. doi: 10.1084/jem.20050784. - DOI - PMC - PubMed
    1. Li M, et al. A wave of Foxp3+ regulatory T cell accumulation in the neonatal liver plays unique roles in maintaining self-tolerance. Cell Mol Immunol. 2020;17(5):507–518. doi: 10.1038/s41423-019-0246-9. - DOI - PMC - PubMed
    1. Maria A, et al. Appropriate development of the liver Treg compartment is modulated by the microbiota and requires TGF-β and MyD88. J Immunol Res. 2014;2014:279736. doi: 10.1155/2014/279736. - DOI - PMC - PubMed