. 2024 Sep 3;134(17):e180117.
doi: 10.1172/JCI180117.

Inflammation primes the murine kidney for recovery by activating AZIN1 adenosine-to-inosine editing

Affiliations

Inflammation primes the murine kidney for recovery by activating AZIN1 adenosine-to-inosine editing

Segewkal Hawaze Heruye et al. J Clin Invest. .

Abstract

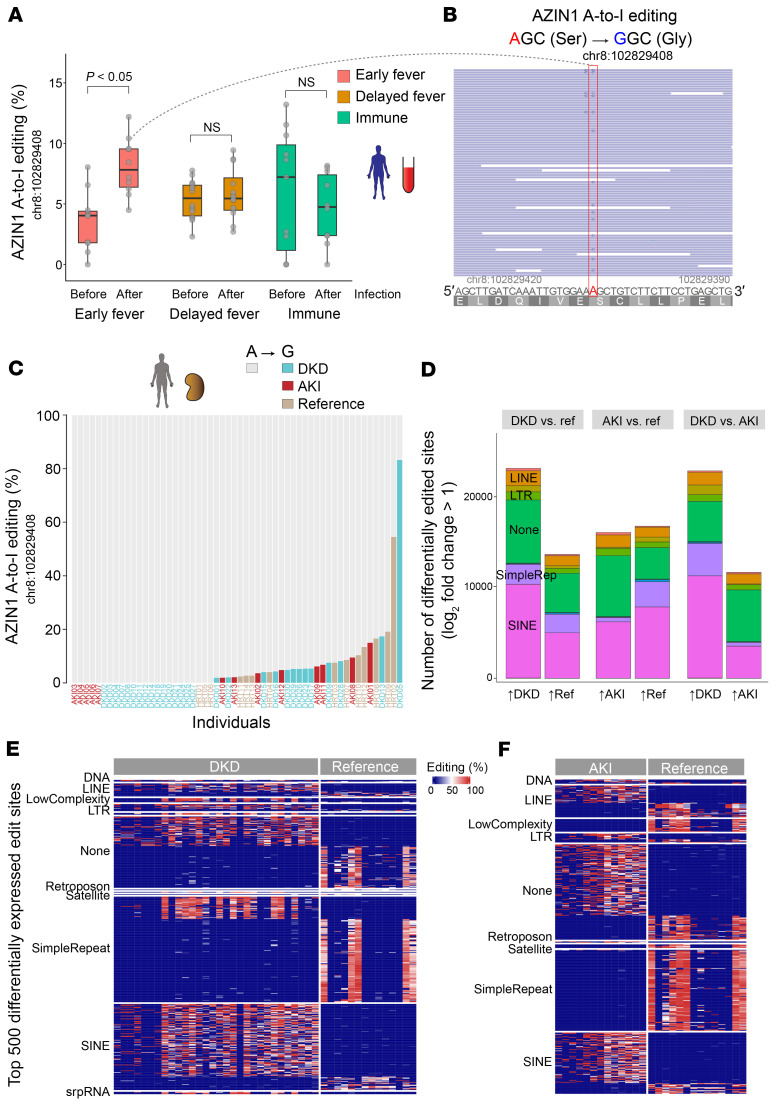
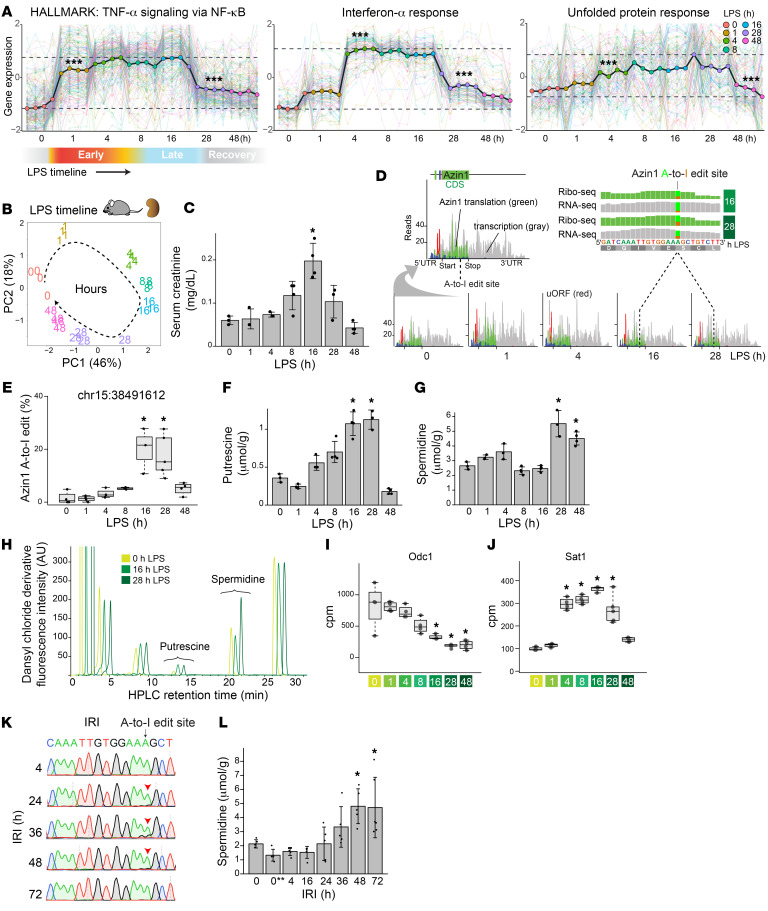
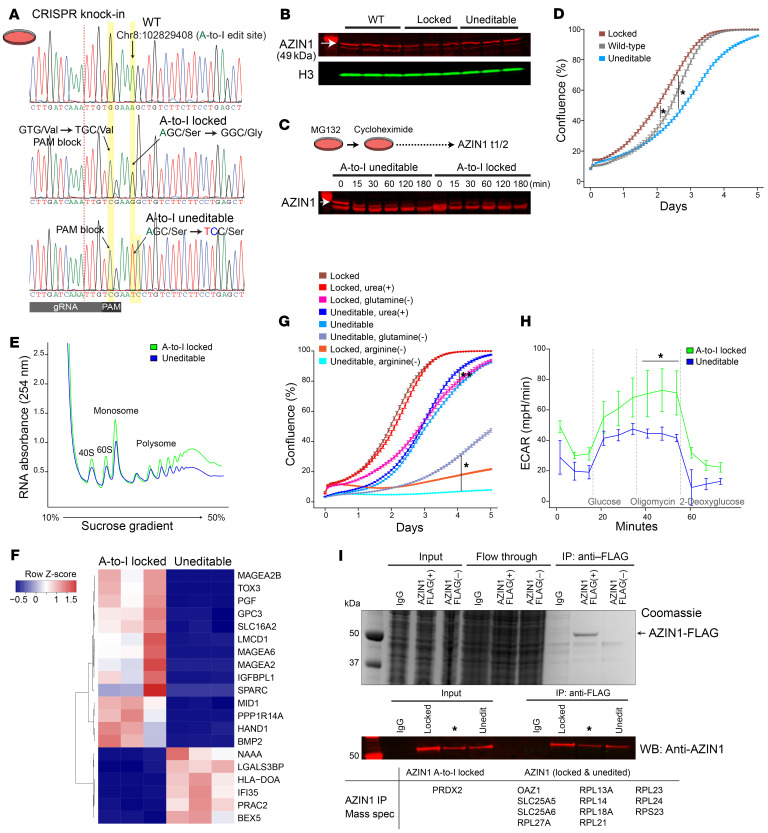
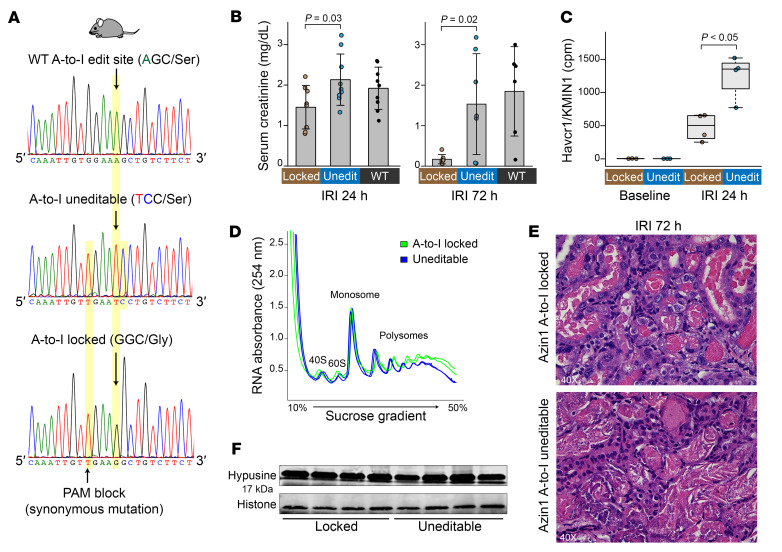
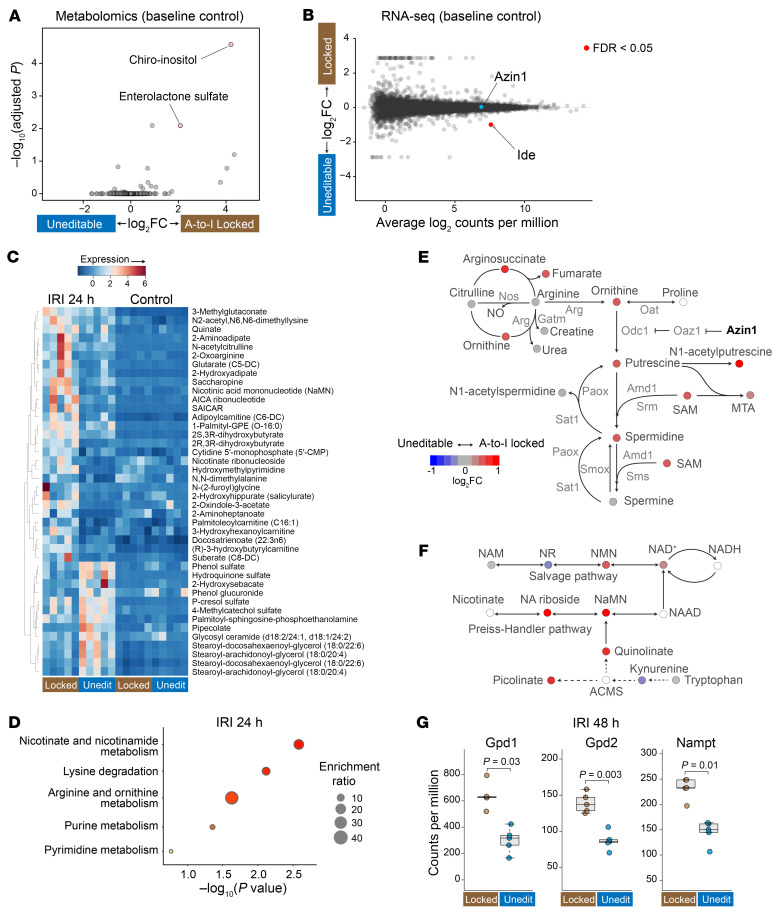
The progression of kidney disease varies among individuals, but a general methodology to quantify disease timelines is lacking. Particularly challenging is the task of determining the potential for recovery from acute kidney injury following various insults. Here, we report that quantitation of post-transcriptional adenosine-to-inosine (A-to-I) RNA editing offers a distinct genome-wide signature, enabling the delineation of disease trajectories in the kidney. A well-defined murine model of endotoxemia permitted the identification of the origin and extent of A-to-I editing, along with temporally discrete signatures of double-stranded RNA stress and adenosine deaminase isoform switching. We found that A-to-I editing of antizyme inhibitor 1 (AZIN1), a positive regulator of polyamine biosynthesis, serves as a particularly useful temporal landmark during endotoxemia. Our data indicate that AZIN1 A-to-I editing, triggered by preceding inflammation, primes the kidney and activates endogenous recovery mechanisms. By comparing genetically modified human cell lines and mice locked in either A-to-I-edited or uneditable states, we uncovered that AZIN1 A-to-I editing not only enhances polyamine biosynthesis but also engages glycolysis and nicotinamide biosynthesis to drive the recovery phenotype. Our findings implicate that quantifying AZIN1 A-to-I editing could potentially identify individuals who have transitioned to an endogenous recovery phase. This phase would reflect their past inflammation and indicate their potential for future recovery.

Keywords: Bioinformatics; Cell stress; Nephrology; Polyamines.


Conflict of interest statement

Conflict of interest: The authors have declared that no conflict of interest exists.

Figures

Figure 1
Figure 1. AZIN1 A-to-I editing status in non-cancerous diseases in humans.
(A) Distribution of AZIN1 A-to-I editing rates (percent of edited reads over total reads) in prospectively collected blood from male children aged 6–11 years, before and after Plasmodium falciparum malaria infection. Individuals were classified as early fever (symptomatic and first-time infection), delayed fever (asymptomatic and first-time infection, subsequently developing malarial symptoms), and immune (infected but never developing symptoms). (B) Representative read coverage near the AZIN1 editing site for one sample. Note that inosine is sequenced as guanosine. The human AZIN1 gene is encoded on the minus strand, hence the T-to-C mutation, not A-to-G, in the coverage track. Light-blue-colored reads (F2R1 paired-end orientation) indicate the proper directionality of reads mapped to the minus strand. (C) Distribution of AZIN1 A-to-I editing rates in kidney biopsies with a pathology diagnosis of diabetic kidney disease (DKD), acute kidney injury (AKI), or reference nephrectomy samples. Each column represents one sample. (D) Stacked bar chart summarizing total numbers of differentially expressed A-to-I editing sites genome-wide under the indicated conditions. For each comparison, editing sites are divided on the x axis based on the direction of fold change. For example, in the DKD versus reference comparison, approximately 20,000 sites are more edited in DKD, whereas approximately 10,000 sites are more edited in reference nephrectomy samples. (E) Heatmap displaying the top 500 differentially expressed A-to-I editing sites between diabetic nephropathy and reference nephrectomy samples. The differentially expressed sites are categorized based on repeat classes. (F) Comparison between AKI biopsies and reference nephrectomy samples.
Figure 2
Figure 2. Azin1 A-to-I editing status in murine models of AKI.
(A) Bulk RNA-Seq analysis on a murine model of endotoxemia (LPS). Gene set coregulation analysis showing sequential upregulation of pathways involved in NF-κB–mediated acute inflammation and in antiviral/interferon responses, followed by the integrated stress response, as indicated by enrichment of the Molecular Signatures Database Hallmark Gene Sets. Each dot corresponds to each animal. The colored lines in the background depict scaled expression of individual genes. ***Pairwise t test adjusted P < 0.05 compared with the preceding time point. (B) Principal component analysis showing overall gene expression changes over the course of endotoxemia in the kidney. (C) Serum creatinine levels at indicated time points after administration of LPS (4 mg/kg in C57BL/6J male mice). (D) Combined Ribo-Seq and RNA-Seq read coverage graphs for Azin1 after LPS challenge in the kidney. Reads are mapped to Ensembl transcript Azin1-201. Gray-colored reads represent RNA-Seq, whereas red/green/blue-colored reads represent codon frames for ribosome-protected fragments in Ribo-Seq. The top right panel confirms the translation of A-to-I–edited Azin1 (reanalysis of GEO GSE120877). (E) Percentage of Azin1 A-to-I editing under indicated conditions (based on stranded total RNA-Seq data). (FH) Measurements of kidney tissue putrescine and spermidine levels by HPLC under indicated conditions. Representative HPLC chromatograms are also shown. For clarity, the traces are slightly shifted from each other on the x axis elution time. (I and J) Quantitation of RNA-Seq read counts (in counts per million) at the indicated time points. (K) Sanger sequencing showing timeline-specific Azin1 A-to-I editing observed in wild-type mouse kidneys after ischemia/reperfusion injury (IRI; arrowheads). (L) Measurements of kidney tissue spermidine levels by HPLC after IRI. *P < 0.05 vs. 0-hour control samples, 1-way ANOVA followed by Dunnett’s test for multiple treatment comparisons. 0** indicates kidney tissues harvested 20 minutes after ischemia without reperfusion.
Figure 3
Figure 3. Azin1 A-to-I–uneditable state hinders cell growth and limits glycolytic capacity.
(A) Sanger sequencing chromatograms for wild-type (HEK293T; top), AZIN1 A-to-I–locked (middle), and AZIN1 A-to-I–uneditable homozygous cell lines (bottom). Homology-directed repair donor oligonucleotides used for CRISPR knockin are shown in Supplemental Figure 5A. (B) Western blotting for AZIN1 under indicated conditions (~70% confluence). (C) Determination of AZIN1 protein turnover under indicated conditions. Nascent protein synthesis was inhibited with 250 μg/mL cycloheximide. Arrow points to AZIN1. Bands below AZIN1 result from inhibition of proteasomal degradation with MG132. n = 2 biological replicates. (D) Real-time monitoring of cell growth for AZIN1 A-to-I–locked, uneditable, and wild-type cells. n = 3 independent experiments with n = 6 technical replicates for each experiment. *P < 0.05 at all time points for indicated conditions, except the stationary phase between AZIN1 A-to-I–locked and wild-type cells. Representative images are shown in Supplemental Figure 5C. (E) Polyribosome profiling of AZIN1 A-to-I–locked and uneditable cell lines. n = 3 independent experiments. Mean polysome/monosome ratios for A-to-I–locked and uneditable genotypes are 4.1 and 3.6, respectively. (F) Heatmap of the top 20 differentially expressed genes between AZIN1 A-to-I–locked and uneditable cell lines as determined by RNA-Seq (https://connect.posit.iu.edu/azin1/). (G) Cell growth under indicated conditions. Representative images are shown in Supplemental Figure 5D. *P < 0.05, **P < 0.05 after day 1 and day 2.5 for indicated conditions, respectively. (H) Extracellular acidification rates under indicated conditions (Seahorse glycolysis stress test). n = 3 independent experiments with n = 3 technical replicates for each experiment. *P < 0.05 vs. AZIN1-uneditable cells at indicated time points. (I) Identification of AZIN1-interacting molecules by mass spectrometry. Top: Coomassie staining for input, flow-through, and immunoprecipitated unfractionated lysates from IgG control and transfection of FLAG-tagged AZIN1 or AZIN1 without FLAG plasmids. Middle: Western blotting for AZIN1. Cells overexpressing FLAG-tagged A-to-I–locked AZIN1 or uneditable plasmids were fractionated into cytoplasmic and nuclear compartments and immunoprecipitated using anti-FLAG antibody (cytoplasmic fraction is shown). See also Supplemental Figure 5H. Summary of coprecipitated proteins with AZIN1 is presented in the bottom table. n = 3 independent experiments. *Plasmid construct not used in this article.
Figure 4
Figure 4. Azin1 A-to-I–locked mice exhibit faster tissue recovery following ischemic injury compared with uneditable mice.
(A) Sanger sequencing chromatograms for wild-type (top), Azin1 A-to-I–uneditable (middle), and Azin1 A-to-I–locked homozygous mice (bottom). The CRISPR knockin strategy is depicted in Supplemental Figure 6A. (B) Serum creatinine levels 24 and 72 hours after a 20-minute bilateral IRI. (C) Kidney tissue Havcr1/kidney injury marker-1 (KIM1) levels as determined by RNA-Seq (counts per million). (D) Polyribosome profiling of kidneys from Azin1 A-to-I–locked and uneditable mice 24 hours after IRI. Two representative biological replicates are shown for each genotype. Mean polysome/monosome ratios for A-to-I–locked and uneditable genotypes are 3.3 and 2.8, respectively. (E) Hematoxylin and eosin staining 72 hours after IRI. Original magnification, ×40. (F) Western blotting for hypusine in the kidney after IRI.
Figure 5
Figure 5. Azin1 A-to-I–locked state limits kidney injury by upregulating polyamines and other protective pathways.
(A) Volcano plot showing the top 2 differentially expressed metabolites. The x axis depicts the log2 fold change of A-to-I locked/uneditable ratio, and the y axis depicts –log10 adjusted P values. Global untargeted metabolomics, n = 5 for each condition. (B) RNA-Seq gene expression analysis (smear plot) comparing homozygous A-to-I–locked and uneditable mouse kidneys under basal conditions. Only Ide (insulin-degrading enzyme) met the criteria of FDR < 0.05 (https://connect.posit.iu.edu/azin1_mouse_kidney/). (C) Heatmap displaying the top differentially expressed metabolites between Azin1-locked and uneditable mice after IRI (adjusted P < 0.05 for all listed metabolites). (D) Pathway enrichment analysis of differentially expressed metabolites between Azin1 A-to-I–locked and uneditable mouse kidneys after IRI. (E) Metabolite ratios (log2 fold change of A-to-I locked/uneditable) mapped to the polyamine pathway and pseudocolored according to the indicated scale. Metabolites with blank circles were not resolved by the metabolomics. (F) Metabolite ratios mapped to the NAD+ biosynthesis pathway. (G) RNA-Seq read counts for glycerol-3-phosphate dehydrogenase 1, cytoplasmic (Gpd1), glycerol-3-phosphate dehydrogenase 2, mitochondrial (Gpd2), and nicotinamide phosphoribosyltransferase (Nampt), 48 hours after IRI.
Figure 6
Figure 6. Genome-wide characterization of A-to-I editing in mouse kidneys.
(A) Immunoblotting of dsRNA under indicated conditions. RNase A incubation was done with high salt to specifically digest single-stranded RNA. The negative control consisted of RNase III digestion, which digests dsRNA. The positive control consisted of poly(I:C) without RNase digestion. (B) Schematic representation of dsRNA immunoprecipitation and sequencing. (C) Overlay of density plots displaying A-to-I edit percentages under indicated conditions. (D) Left: Total counts and distribution of A-to-I editing sites per sample (nuclear fraction; editing rate > 10% and reads count > 5 in at least 3 samples; see Methods for further pre-processing criteria). Middle: Distribution of A-to-I editing sites, normalized to genomic region lengths. Right: Distribution of A-to-I editing sites per repeat class. CDS, coding sequence. (E) Summary of A-to-I editing sites that exhibit differential expression compared with the 0-hour baseline. The bottom track represents hyper-editing sites. (F) Single-cell uniform manifold approximation and projection (UMAP) displaying the distribution of Adar expression in the mouse kidney (reanalysis of published data GEO GSE151658). PT, proximal tubule; CD-PC, collecting duct principal cell; TAL, thick ascending loop of Henle. (GI) Quantitation of total RNA-Seq read counts (in counts per million) at the specified time points. (J) Scheme depicting the sequence of events observed in the kidney. (K) Read coverage comparison for March2 near the transcription termination site between dsRNA enrichment (top 6 tracks) and without dsRNA enrichment (bottom 2 tracks, 0 and 28 hours after LPS; regular total RNA sequencing).
Figure 7
Figure 7. Genome-wide characterization of A-to-I editing in mouse kidneys.
(A) Pathway enrichment analysis based on genes that exhibit differential editing rates between baseline and 28 hours (cytoplasmic compartment). isa, inferred from sequence alignment. (B) Heatmap displaying the top 500 differentially expressed A-to-I editing sites between 0-hour baseline and 28 hours after endotoxin in the kidney. The differentially expressed (DE) sites are categorized based on repeat classes. (C) List of genes exhibiting non-synonymous A-to-I coding sequence mutation in response to an endotoxin challenge in the kidney. (D) Cdk13 reads distribution and A-to-I editing under indicated conditions. (E) Comparison of motif enrichment between non-hyper-editing (top) and hyper-editing sites (bottom) within ±50 nucleotides centered around A-to-I editing sites. Predicted RNA secondary structure around the 3′-UTR hyper-editing site is shown at the bottom (arrow). Positional entropy is color-coded. (F) Ribo-Seq and nanopore read coverage graphs for Adar, clarifying Adar transcript isoform switches during endotoxemia.

Update of

References

    1. Miller-Fleming L, et al. Remaining mysteries of molecular biology: the role of polyamines in the cell. J Mol Biol. 2015;427(21):3389–3406. doi: 10.1016/j.jmb.2015.06.020. - DOI - PubMed
    1. Madeo F, et al. Spermidine in health and disease. Science. 2018;359(6374):eaan2788. doi: 10.1126/science.aan2788. - DOI - PubMed
    1. Pegg AE. Functions of polyamines in mammals. J Biol Chem. 2016;291(29):14904–14912. doi: 10.1074/jbc.R116.731661. - DOI - PMC - PubMed
    1. Igarashi K, Kashiwagi K. Modulation of cellular function by polyamines. Int J Biochem Cell Biol. 2010;42(1):39–51. doi: 10.1016/j.biocel.2009.07.009. - DOI - PubMed
    1. Lightfoot HL, Hall J. Endogenous polyamine function—the RNA perspective. Nucleic Acids Res. 2014;42(18):11275–11290. doi: 10.1093/nar/gku837. - DOI - PMC - PubMed

MeSH terms