. 2024 Jul 2;134(17):e179561.
doi: 10.1172/JCI179561.

Inhibiting the NADase CD38 improves cytomegalovirus-specific CD8+ T cell functionality and metabolism

Affiliations

Inhibiting the NADase CD38 improves cytomegalovirus-specific CD8+ T cell functionality and metabolism

Nils Mülling et al. J Clin Invest. .

Abstract

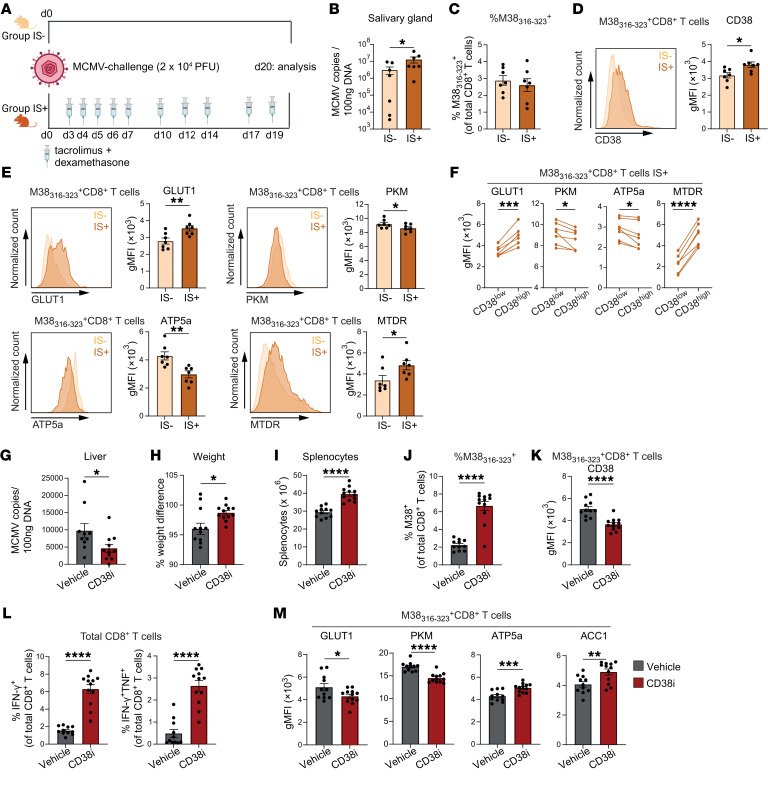
Cytomegalovirus (CMV) is one of the most common and relevant opportunistic pathogens in people who are immunocompromised, such as kidney transplant recipients (KTRs). The exact mechanisms underlying the disability of cytotoxic T cells to provide sufficient protection against CMV in people who are immunosuppressed have not been identified yet. Here, we performed in-depth metabolic profiling of CMV-specific CD8+ T cells in patients who are immunocompromised and show the development of metabolic dysregulation at the transcriptional, protein, and functional level of CMV-specific CD8+ T cells in KTRs with noncontrolled CMV infection. These dysregulations comprise impaired glycolysis and increased mitochondrial stress, which is associated with an intensified expression of the nicotinamide adenine dinucleotide nucleotidase (NADase) CD38. Inhibiting NADase activity of CD38 reinvigorated the metabolism and improved cytokine production of CMV-specific CD8+ T cells. These findings were corroborated in a mouse model of CMV infection under conditions of immunosuppression. Thus, dysregulated metabolic states of CD8+ T cells could be targeted by inhibiting CD38 to reverse hyporesponsiveness in individuals who fail to control chronic viral infection.

Keywords: Glucose metabolism; Immunology; T cells; Transplantation.


Conflict of interest statement

Conflict of interest: OW has received research grants for clinical studies, speaker’s fees, honoraria, and travel expenses from Amgen, Alexion, Astellas, Astra Zeneca, Basilea, Biotest, Bristol-Myers Squibb, Correvio, Chiesi, Gilead, GSK, Hexal, Janssen, Dr. F. Köhler Chemie, Moderna, MSD, Novartis, Roche, Pfizer, Sanofi, Shionogi, Takeda, TEVA, Tillotts, and UCB. OW is supported by an unrestricted grant of the Rudolf-Ackermann-Stiftung (Stiftung für Klinische Infektiologie). AK received lecture fees, consulting fees, and travel fees from Alexion, Astellas, Astra Zeneca, Bayer Vital, GlaxoSmithKline, Janssen Cilag, Kyowa Kirin, Neovii, Novartis, Rhythm Pharmaceuticals, and Vifor Pharma. AK received research grants from BMBF, Cendres + Metaux SA, Charité, Exthera, Mirobio, MorphoSys, Numares, Quintiles, and Reata Pharmaceuticals. BW received lecture fees, consulting fees, and travel fees from Alexion, Chiesi, Glaxo-Smith-Kline, Hexal, Otsuka, Novartis, TEVA, Mirobio, Neovii Biotech, Sanofi, Vifor, and Wyeth. APJDV received grant and consulting fees from Astellas, Astra Zeneca, Aurinia, Chiesi, CSL Behring, Hansa, Neovii, Novartis, Sandoz, Sanofi, and Takeda, all of which went to his employer and none to personal bank accounts. BW received research grants provided by the Dr. Werner Jackstädt-Foundation. All other authors have declared that no conflict of interest exists.

Figures

Figure 1
Figure 1. Frequency and phenotype of CMV-specific CD8+ T cells are unaffected by loss of viral control while cytokine production is decreased.
(A) Graphical overview of main study groups. Created with biorender.com. (BG) PBMCs of HCs (n = 13), controllers (n = 22), and noncontrollers (n = 14) were analyzed ex vivo. (B) Representative plots of pp65495–503 and spike269–277–specific CD8+ T cells in the same host. (C) Frequencies of pp65495–503 and spike269–277–specific CD8+ T cells of total CD8+ T cells. (D) UMAP analysis (left) and FlowSOM consensus metaclustering with 5 clusters (right) was performed on pp65495–503–specific CD8+ T cells (downsampled to equal numbers between groups). (E) Expression intensity of cell surface markers. (F) Hierarchically clustered heatmap of phenotypes of the 5 clusters shown in D. Marker expression per cluster as z score of median signal intensity per channel. (G) Cluster frequencies of pp65495–503–specific CD8+ T cells. (H) Percentage IFN-γ+CD137+ (left) and IFN-γ+TNF+IL-2+CD137+ cells (right) of pp65495–503–specific CD8+ T cells stimulated for 20 hours with peptide (n = 4–7/group). Data are presented as mean ± SEM or as boxplot. Bounds of the boxes indicate upper and lower quartile, lines indicate median, whiskers indicate min and max. Each dot represents an individual. Statistical analysis by 1-way ANOVA with Tukey’s test for multiple comparisons or 2-way ANOVA with Šidák’s test for multiple comparisons. *P < 0.05; **P < 0.01; ***P < 0.001; ****P < 0.0001.
Figure 2
Figure 2. Transcriptional analysis of metabolic pathways reveals downregulation of genes related to glycolysis and mitochondrial respiration in CMV-specific CD8+ T cells of noncontrollers.
pp65495–503–specific CD8+ T cells (n = 3 independent donors/group) were sorted from PBMCs, and gene expression was profiled using the Nanostring nCounter Metabolic Pathways Panel. (A) Principal component analysis (PCA) of all 768 analyzed genes. Each dot represents an individual.(B) Volcano plot showing differentially expressed genes between controllers and noncontrollers. Genes with significant differential expression (P < 0.05) are highlighted in red and of those, genes with an at least log2(1)-fold differential expression are indicated. (C) Bar plot of differentially expressed genes between controllers and noncontrollers. Upregulated genes in noncontrollers (compared with controllers) are colored red, downregulated genes in noncontrollers are colored blue. (D) STRING interaction network of proteins encoded by genes downregulated in noncontrollers compared with controllers (P < 0.05). Proteins with a strong confidence interaction score (> 0.7) are shown. (E) Heatmap of metabolic pathways. Scores are displayed as z score. Further analyzed pathways are highlighted in red. (F) Bar graphs of pathway scores. Scores are presented as relative expression. Each dot represents an individual. (G) Heatmap showing the expression of single genes related to glycolysis and pyruvate metabolism, mitochondrial respiration, ROS defense, and fatty acid oxidation in controllers and noncontrollers. Scores are displayed as z score. Data are presented as mean ± SEM. Statistical analysis by 1-way ANOVA with Tukey’s test for multiple comparisons. *P < 0.05; **P < 0.01; ***P < 0.001; ****P < 0.0001.
Figure 3
Figure 3. CMV-specific CD8+ T cells of noncontrollers exhibit restrained glycolytic capacity and mitochondrial respiration while fatty acid metabolism is increased.
(A) Overview of metabolic targets (red) and metabolic probes (blue) for analysis by spectral flow cytometry. Created with biorender.com. (BI) Ex vivo analysis of metabolic characteristics of CD8+ T cell subsets. (B) Geometric mean fluorescence intensity (gMFI) of 2-NBDG (13–22/group). (C) GLUT1, PKM, and G6PD expression of pp65495–503–specific CD8+ T cells (n = 10–20/group). (D) CD98 expression of pp65495–503–specific CD8+ T cells (n = 10–20/group). (E) ATP5a (n = 10–20/group) and PGC1α (n = 4/group) expression of pp65495–503–specific CD8+ T cells. (F) MitoSOX gMFI (n=6/group) of pp65495–503–specific CD8+ T cells. (G) MTDR gMFI (n = 13–22/group). (H) CPT1a (n = 10–20/group), MCAD, and FASN (n = 4–7/group) expression of pp65495–503–specific CD8+ T cells (I) Expression of ALDOA in pp65495–503 and IE-1316–324–specific CD8+ T cells within the same individuals (IE-1316–324–specific cells could not be detected in 1 individual) (n = 5/group). (J) SCENITH of pp65495–503–specific CD8+ T cells (n = 4/group). Data are presented as mean ± SEM or as boxplot (bounds of the boxes indicate upper and lower quartile, line indicates median, whiskers indicate min and max). Each dot represents an individual. Statistical analysis by 1-way ANOVA with Tukey’s test for multiple comparisons, 2-way ANOVA with Šidák’s test for multiple comparisons or 2-sided student’s t test. *P <0.05; **P < 0.01; ***P < 0.001; ****P < 0.0001.
Figure 4
Figure 4. Impaired glycolytic responsiveness and increased FAO dependency of antigen-stimulated CMV-specific CD8+ T cells in noncontrollers.
(AI) PBMCs were stimulated with pp65495–503 peptide for either 20 hours (short stimulation) or 6 days (long stimulation). (A) Relative change in gMFI to unstimulated condition of GLUT1 and PKM expression of pp65495–503–specific CD8+ T cells after long stimulation (n = 4–7/group). (B) After short stimulation, supernatant was collected for the analysis of cytokine and granzyme production. Cells were either cultured in presence of 2-DG or not. The percentage decrease in cytokine concentration (pg/mL) after 2-DG treatment is shown (n = 5/group). (C and D) Relative change (to unstimulated condition) of G6PD and CD98 expression (C), ATP5a, cytochrome c, and SDHA expression (D) of pp65495–503–specific CD8+ T cells after long stimulation (n = 4–7/group). (E) Relative change (to unstimulated condition) of MitoSOX, MTDR, and TMRM of pp65495–503–specific CD8+ T cells after short stimulation (n = 4–7/group). (F) Cells were long stimulated and cultured either in the presence or absence of 2-DG. The percentage decrease of TMRM in CD137+CD8+ T cells by 2-DG treatment is shown. (G) Cells were long stimulated in presence or absence of oligomycin. Relative change (stimulated/stimulated + oligomycin) of TMRM uptake in CD137+CD8+ T cells (n = 4–7/group). (H) Relative change (to unstimulated condition) of CPT1a and MCAD expression of pp65495–503–specific CD8+ T cells after long stimulation (n = 4–7/group). (I) After short stimulation, cytokine production was measured by intracellular cytokine staining. Percentage decrease of CD137+IFN-γ+ cells (of total CD8+ T cells) in the presence of etomoxir (n = 4–5/group). (J) SCENITH of CD137+CD69+CD8+ T cells after 4 hours of stimulation with pp65495–503 peptide (n = 4/group). Data are presented as mean ± SEM. Each symbol represents an individual. Statistical analysis by 2-sided student’s t test or 1-way ANOVA with Tukey’s test for multiple comparisons. *P < 0.05; **P < 0.01; ***P < 0.001; ****P < 0.0001.
Figure 5
Figure 5. CD38 expression is particularly elevated on active circulating CMV-specific CD8+ T cells and associates with metabolic dysfunction.
(A) Expression of PD-1, CD39 (n = 6–12/group), and CD38 (n = 10–13/group) on pp65495–503–specific CD8+ T cells. (B) Percentage of CD38hi pp65495–503–specific CD8+ T cells (n = 10–13/group). (C) Correlation between CD38 expression of pp65495–503–specific CD8+ T cells with the highest detected CMV load in blood and MTDR uptake (n = 10–13/group). (D and E) PBMCs were stimulated for 6 days with pp65495–503 peptide. (D) CD38 expression of pp65495–503–specific CD8+ T cells. (E) Expression of GLUT1 versus CD38 and ATP5a versus CD38 (n = 4–7/group). (F) Expression of PKM versus GLUT1. (G) GLUT1, PKM, and ATP5a expression of CD38lo and CD38hi pp65495–503–specific CD8+ T cells. (HJ) MTDR (H), MitoSOX (I), and TMRM (J) staining of CD38lo and CD38hi pp65495–503–specific CD8+ T cells. (K) CPT1a, MCAD, and ACC1 expression of CD38lo and CD38hi pp65495–503–specific CD8+ T cells. (L) Histogram and left bar graph show H3K27me3 levels in pp65495–503–specific CD8+ T cells (n = 4/group). Right bar graph shows H3K27me3 levels in pp65495–503–specific CD8+ T cells of noncontrollers (n = 7) after treatment with NMN, SRT1720, or Ex527. (M) Left: PGC-1α expression in CD38lo and CD38hi pp65495–503–specific CD8+ T cells (n = 4). Right: PGC-1α levels in pp65495–503–specific CD8+ T cells of noncontrollers after treatment with NMN, SRT1720, or Ex527 (n = 7). (N) ATGL expression of CD38lo and CD38hi pp65495–503–specific CD8+ T cells. Data are presented as mean ± SEM. Each dot represents an individual. Statistical analysis by 1-way ANOVA with Tukey’s test for multiple comparisons, repeated-measures ANOVA with Geisser-Greenhouse correction, paired, 2-tailed t test, or Pearson correlation. *P < 0.05; **P < 0.01; ***P < 0.001; ****P < 0.0001.
Figure 6
Figure 6. Elevated expression of CD38 on CMV-specific CD8+ T cells during viral persistence gradually rewires cellular metabolism.
An independent cohort of 16 patients was longitudinally analyzed after kidney transplantation. Blood samples for analysis of pp65495–503–specific CD8+ T cells were taken at 6 weeks (sampling 1), 3 months (sampling 2), 6 months (sampling 3), and 12 months (sampling 4) after transplantation. CMV replication in blood was continuously assessed for 18 months. (A) Representative graph shows the CMV load in blood (left, y axis) and the expression of CD38 (right, y axis) over time. (B and C) Longitudinal expression of GLUT1 and CD38 (B) and TMRM and MTDR levels (C) of pp65495–503–specific CD8+ T cells from controllers (blue, n = 6) and noncontrollers (red, n = 10). (DG) Expression of the transcription factors T-BET, EOMES, BLIMP-1, and IRF-4 (D), CD38 (E), GLUT1 and PKM (F), ATP5a, MitoSOX, MTDR, and TMRM (G), and CPT1a (H) of pp65495–503–specific CD8+ T cells from controllers and noncontrollers (subdivided according to onset of viral replication detection: early, long lasting, and after). (IL) High-dimensional phenotypical analysis pp65495–503–specific CD8+ T cells from controllers and noncontrollers (early, long lasting, and after viral replication). (I) UMAP plots showing the density of metabolic protein and CD38 expression. (J) Stacked bar graph of 9 FlowSOM clusters per group. (K) FlowSOM consensus meta-clustering with 9 clusters. (L) Hierarchically clustered heatmap of the metabolic phenotypes of the clusters shown in J and K. Marker expression is shown per cluster as z score of median signal intensity per channel. Data are presented as mean ± SEM. Each symbol in DH represents an individual. Statistical analysis by 1-way ANOVA with Tukey’s test for multiple comparisons. *P < 0.05; **P < 0.01; ***P < 0.001; ****P < 0.0001.
Figure 7
Figure 7. CD38 inhibition restores metabolic dysregulation and improves functionality of CMV-specific CD8+ T cells in noncontrollers.
(AH) PBMCs were stimulated with pp65495–503 peptide for either 20 hours (short stimulation) or 6 days (long stimulation). (A) H3K27me3 levels in long-stimulated pp65495–503–specific CD8+ T cells from noncontrollers (n = 7) in presence of vehicle, CD38i, or CD38i + Ex527. (B and C) Representative contour plot (B) and quantitative graphs (C) show MTDR and TMRM staining of pp65495–503–specific CD8+ T cells after short stimulation in the presence or absence of CD38i (n = 7/group). (D and E) Representative histogram (D) and quantitative graphs (E) show PKM expression of pp65495–503–specific CD8+ T cells after long stimulation in presence or absence of CD38i (n = 5–6/group). (F) Expression of PGC-1α in long-stimulated pp65495–503–specific CD8+ T cells from noncontrollers (n = 7) in presence of vehicle, CD38i, or CD38i + Ex527. (G and H) ATP5a and cytochrome c expression (G) and cumulative ETC protein expression (cytochrome c/SDHA/ATP5a) (H) after long stimulation in presence or absence of CD38i (n = 5–6/group). (I and J) After short stimulation, cytokine production was measured by intracellular cytokine staining in presence or absence of CD38i. Representative CD137 versus IFN-γ staining (I), percentage IFN-γ+CD137+ of pp65495–503–specific CD8+ T cells (n = 7/group) (J). (K) Percentage IFN-γ+CD137+ cells of pp65495–503–specific CD8+ T cells from noncontrollers after long stimulation with peptide in presence of vehicle, etomoxir, or etomoxir plus CD38i (n = 5). (L) PBMCs were cultured in presence of CD38i or vehicle for 16 hours, followed by stimulation with pp65495–503 peptide for 4 hours. Subsequently, SCENITH was performed on CD137+CD69+CD8+ T cells (n = 4 noncontrollers). Data are presented as mean ± SEM. Each symbol represents an individual. Statistical analysis by paired t test or repeated-measures ANOVA with Geisser-Greenhouse correction. *P < 0.05; **P < 0.01; ***P < 0.001.
Figure 8
Figure 8. Mouse model of CMV infection confirms an increased CD38 expression on CMV-specific CD8+ T cells and association with metabolic alterations.
(AF) C57BL/6 mice were infected with MCMV-Smith (2 × 10⁴ PFU). Mice received immunosuppression (IS) medication (tacrolimus + dexamethasone) starting on day 3 after MCMV challenge (IS+, n = 7) or were untreated (IS, n = 7). On day 20 salivary glands and spleens were isolated for determination of viral load and metabolic state of MCMV-specific CD8+ T cells, respectively. (A) Experimental setup. Created with biorender.com. (B) MCMV load in salivary glands. (C) Frequency of M38316–323–specific CD8+ T cells. (D) CD38 expression on M38316–323–specific CD8+ T cells. (E) GLUT1, PKM, ATP5a, and MTDR levels of M38316–323–specific CD8+ T cells from IS and IS+ mice. (F) GLUT1, PKM, ATP5a, and MTDR levels in CD38lo and CD38hi M38316–323–specific CD8+ T cells from IS+ mice. (GM) C57BL/6 mice were infected with MCMV-Smith and received immunosuppression as above. On day 20, 1 group received CD38i twice daily for 7 consecutive days (n = 12) while the another (control) group received vehicle (n = 11). On day 27 livers and spleens were isolated for determination of viral load and metabolic state of MCMV-specific CD8+ T cells, respectively. (G) MCMV load in livers. (H) Weight difference before and after CD38i treatment. (I) Total splenocyte count. (J) Frequency of M38316–323–specific cells. (K) CD38 expression on M38316–323–specific CD8+ T cells. (L) Percentage IFN-γ+ and IFN-γ+TNF+ cells of total CD8+ T cells after stimulation for 5 hours with peptide. (M) Metabolic protein expression of M38316–323–specific CD8+ T cells. Data are presented as mean ± SEM. Each symbol represents an individual. Statistical analysis by 2-sided t test, paired t test, or Mann-Whitney U test (viral load). *P < 0.05; **P < 0.01; ***P < 0.001; ****P < 0.0001.

References

    1. De Keyzer K, et al. Human cytomegalovirus and kidney transplantation: a clinician’s update. Am J Kidney Dis. 2011;58(1):118–126. doi: 10.1053/j.ajkd.2011.04.010. - DOI - PubMed
    1. Sagedal S, et al. Impact of early cytomegalovirus infection and disease on long-term recipient and kidney graft survival. Kidney Int. 2004;66(1):329–337. doi: 10.1111/j.1523-1755.2004.00735.x. - DOI - PubMed
    1. Reinke P, et al. Late-acute renal allograft rejection and symptomless cytomegalovirus infection. Lancet. 1994;344(8939-8940):1737–1738. doi: 10.1016/S0140-6736(94)92887-8. - DOI - PubMed
    1. Lowance D, et al. Valacyclovir for the prevention of cytomegalovirus disease after renal transplantation. International Valacyclovir Cytomegalovirus Prophylaxis Transplantation Study Group. N Engl J Med. 1999;340(19):1462–1470. doi: 10.1056/NEJM199905133401903. - DOI - PubMed
    1. Luan FL, et al. Six-month prophylaxis is cost effective in transplant patients at high risk for cytomegalovirus infection. J Am Soc Nephrol. 2009;20(11):2449–2458. doi: 10.1681/ASN.2008111166. - DOI - PMC - PubMed