. 2024 Sep:47:102040.
doi: 10.1016/j.tranon.2024.102040. Epub 2024 Jul 1.

CuET overcomes regorafenib resistance by inhibiting epithelial-mesenchymal transition through suppression of the ERK pathway in hepatocellular carcinoma

Affiliations

CuET overcomes regorafenib resistance by inhibiting epithelial-mesenchymal transition through suppression of the ERK pathway in hepatocellular carcinoma

Ding Ma et al. Transl Oncol. 2024 Sep.

Abstract

Background and purpose: Regorafenib was approved by the US Food and Drug Administration (FDA) for hepatocellular carcinoma (HCC) patients showing progress on sorafenib treatment. However, there is an inevitably high rate of drug resistance associated with regorafenib, which reduces its effectiveness in clinical treatment. Thus, there is an urgent need to find a potential way to solve the problem of regorafenib resistance. The metabolite of disulfiram complexed with copper, the Diethyldithiocarbamate-copper complex (CuET), has been found to be an effective anticancer drug candidate. In the present study, we aimed to evaluate the effect of CuET on regorafenib resistance in HCC and uncover the associated mechanism.

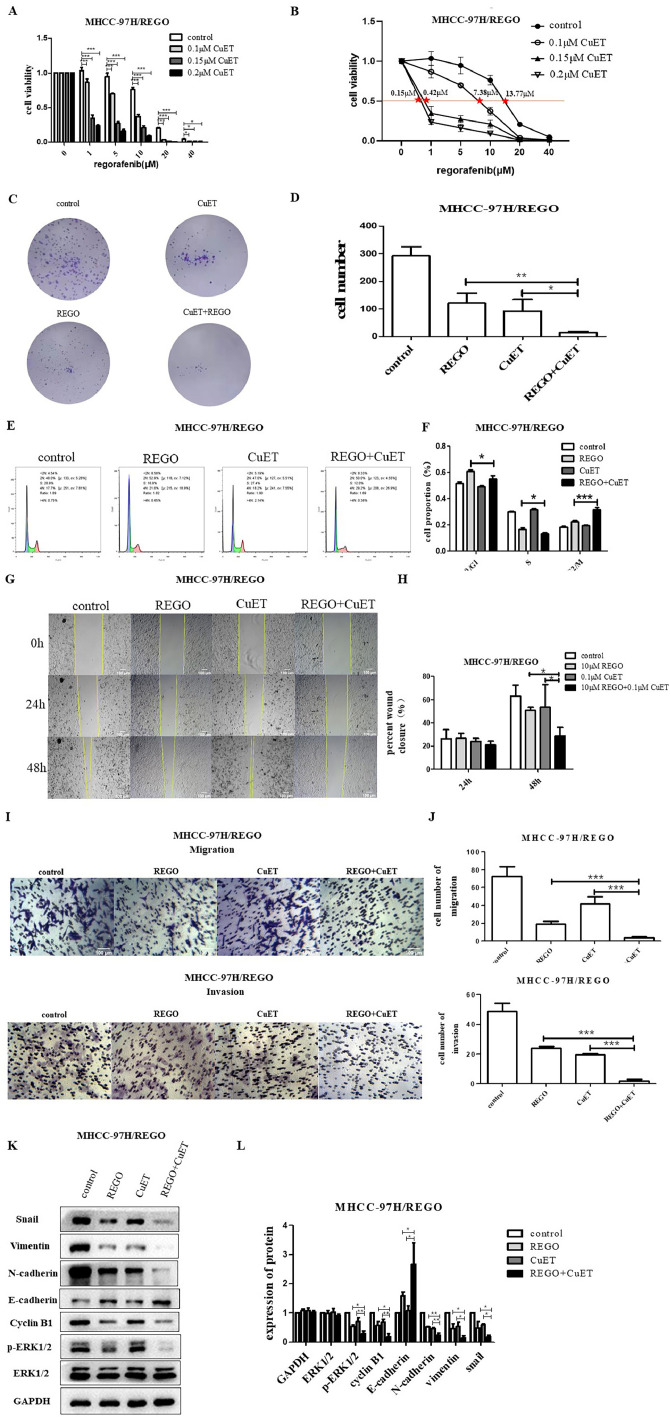
Experimental approach: Regorafenib-resistant HCC strains were constructed by applying an increasing concentration gradient. This study employed a comprehensive range of methodologies, including the cell counting kit-8 (CCK-8) assay, colony formation assay, cell cycle analysis, wound healing assay, Transwell assay, tumor xenograft model, and immunohistochemical analysis. These methods were utilized to investigate the antitumor activity of CuET, assess the combined effect of regorafenib and CuET, and elucidate the molecular mechanism underlying CuET-mediated regorafenib resistance.

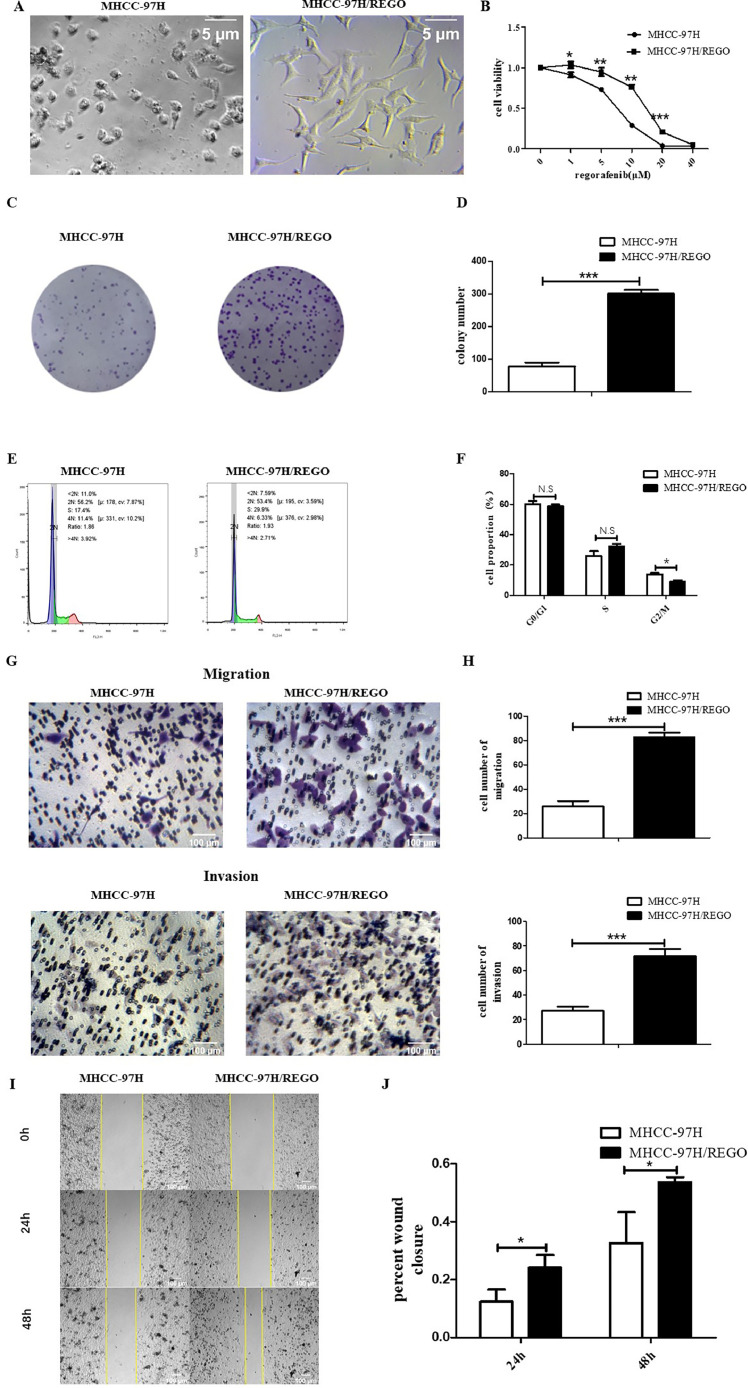
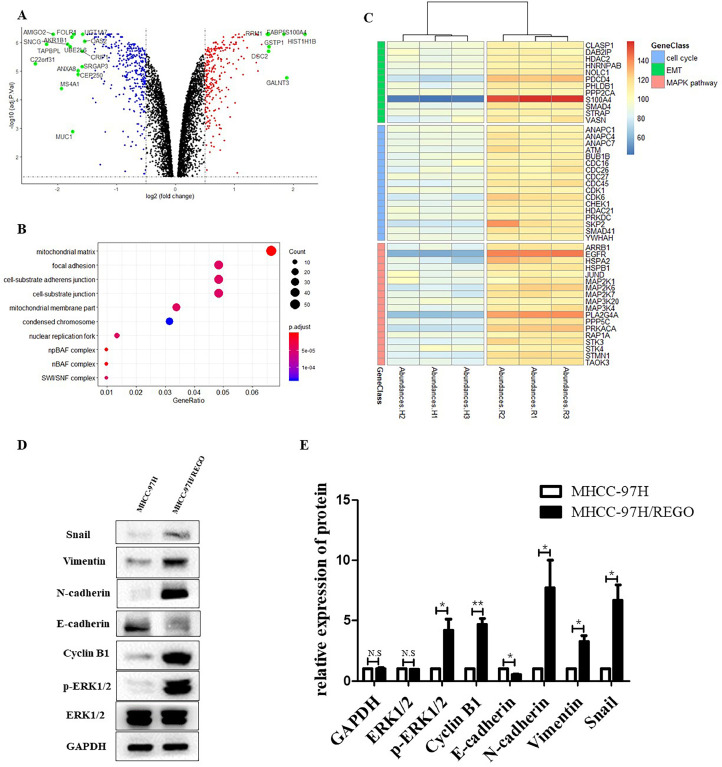
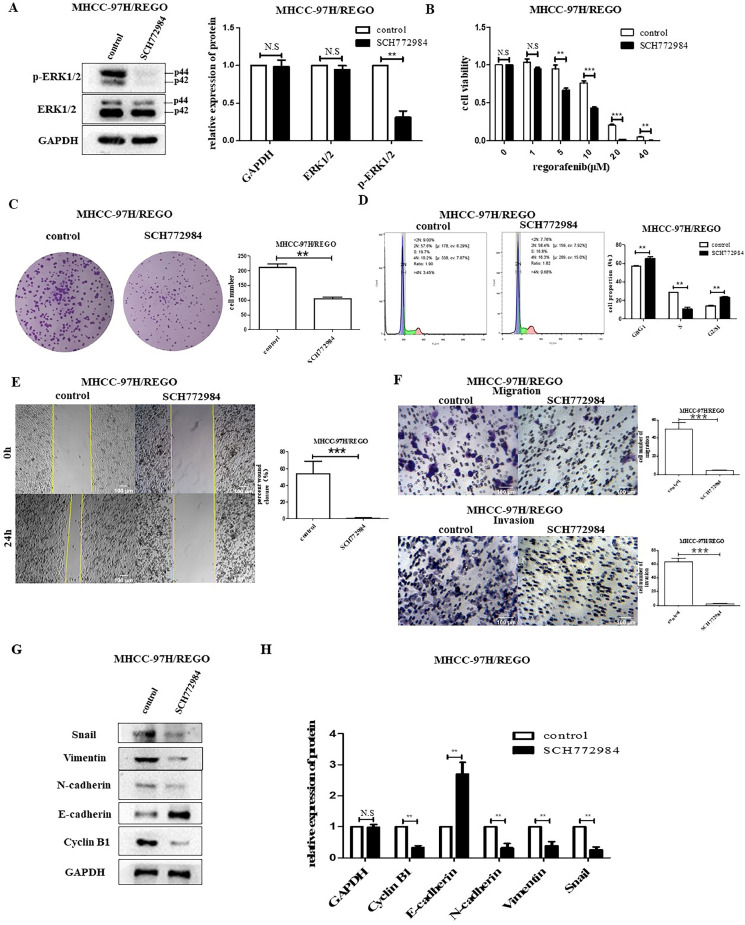
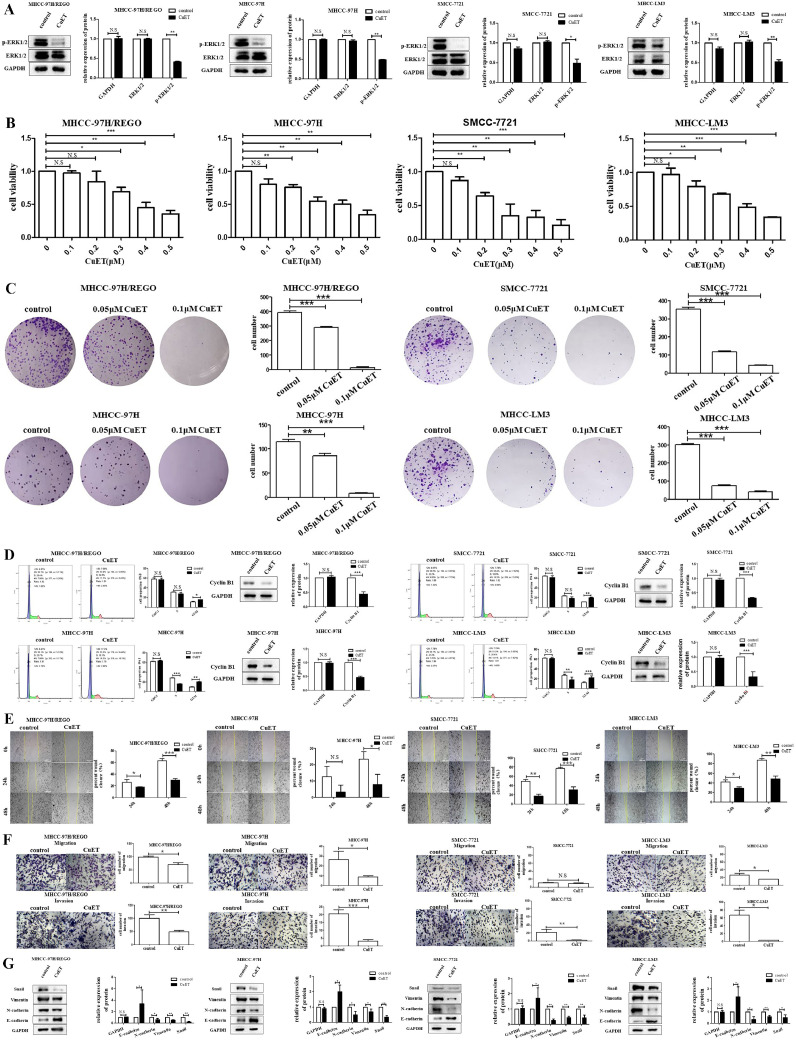
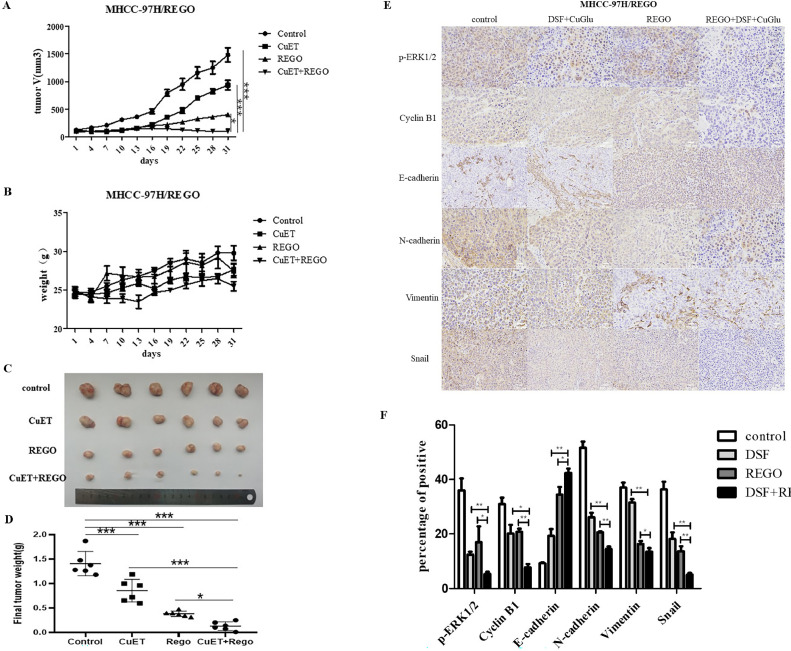
Key results: The inhibitory effect of regorafenib on cell survival, proliferation and migration was decreased in regorafenib-resistant MHCC-97H (MHCC-97H/REGO) cells compared with parental cells. CuET demonstrated significant inhibitory effects on cell survival, proliferation, and migration of various HCC cell lines. CuET restored the sensitivity of MHCC-97H/REGO HCC cells to regorafenib in vitro and in vivo. Mechanistically, CuET reverses regorafenib resistance in HCC by suppressing epithelial-mesenchymal transition (EMT) through inhibition of the ERK signaling pathway.

Conclusion and implications: Taken together, the results of this study demonstrated that CuET inhibited the activation of the ERK signaling pathway, leading to the suppression of the epithelial-mesenchymal transition (EMT) and subsequently reversing regorafenib resistance in HCC both in vivo and in vitro. This study provides a new idea and potential strategy to improve the treatment of regorafenib-resistant HCC.

Keywords: CuET; HCC; Regorafenib; Regorafenib-resistant MHCC-97H; Reversal of regorafenib resistance.


Conflict of interest statement

Declaration of competing interest The authors disclose no potential conflicts of interest.

Figures

Fig. 1
Fig. 1
In vitro characterization of regorafenib-resistant cells. A. MHCC-97H/REGO cells showed a fibroblast-like and mesenchymal morphology. MHCC-97H and MHCC-97H/REGO cells were photographed with a microscope at 100× magnification. B. MHCC-97H and MHCC-97H/REGO cells were treated with different concentrations of regorafenib for 72 h. Cell viability was determined by the CCK-8 assay. The IC50 values for MHCC-97H and MHCC-97H/REGO were 7.16 ± 0.46 μM and 13.78 ± 1.02 μM, respectively. C-D. Colony formation experiments with MHCC-97H and MHCC-97H/REGO cells after cell culture for 7 days. Cells were plated at a density of 103 cells per well. E-F. Flow cytometry analysis was conducted to examine the cell cycle distribution of MHCC-97H/REGO and MHCC-97H cells. G-H. The migration and invasion abilities of MHCC-97H and MHCC-97H/REGO cells were determined by Transwell experiments. In each group, 8 × 10⁴ cells were plated, and the number of cells passing through the Transwell chamber was recorded 24 h later. I-J. Migration ability of MHCC-97H and MHCC-97H/REGO cells was determined by wound-healing migration assays. Photos were taken after 0 h, 24 h and 48 h of culture, after which the healing rate was calculated. *p < 0.05, **p < 0.01, ***p < 0.001 (one-way ANOVA).
Fig. 2
Fig. 2
Changes in protein abundance in regorafenib-resistant cells compared to parental cells. A. Volcano plot for differential gene expression. B. GO analysis of the DEGs in the MHCC-97H/REGO cohort. C. Heatmap of protein microarray data for cell cycle, EMT and MAPK pathway genes in the MHCC-97H and MHCC-97H/REGO cell lines. d-E. Qualitative and quantitative analysis of the protein expression levels of E-cadherin, N-cadherin, vimentin, snail, cyclin B1, p-ERK and t-ERK in MHCC-97H and MHCC-97H/REGO cells.
Fig. 3
Fig. 3
Effect of p-ERK on regorafenib resistance in the MHCC-97H/REGO cell line. A. The expression of t-ERK and p-ERK in MHCC-97H/REGO cells treated with SCH772984. B. Cell viability was determined by the CCK-8 assay. The IC50 values for MHCC-97H/REGO- and SCH772984-treated MHCC-97H/REGO cells were 13.78 ± 1.02 μM and 7.501 ± 0.77 μM, respectively. C. Colony formation ability of MHCC-97H/REGO cells treated with or without the p-ERK inhibitor SCH772984 (5 μM). Cells were plated at a density of 103 per well and then treated with vehicle or SCH772984 for 24 h. D. Cell cycle distributions of SCH772984 treated MHCC-97H/REGO cells. E. Wound healing experiments in MHCC-97H/REGO cells treated with (right) or without (left) SCH772984 (5 µM). F. The migration and invasion ability of MHCC-97H/REGO cells were determined by Transwell experiments. A total of 8 × 10⁴ cells were implanted into the Transwell chamber and treated with vehicle or SCH772984 (5 μM) for 24 h. G-H. Qualitative and quantitative analyses of the protein levels of E-cadherin, N-cadherin, vimentin, snail, cyclin B1, p-ERK and t-ERK in MHCC-97H/REGO cells were performed via western blotting. Cells were treated with (right) or without (left) SCH772984 (5 μM) for 24 h. *p < 0.05, **p < 0.01, ***p < 0.001 (one-way ANOVA).
Fig. 4
Fig. 4
Effect of CuET on the ERK pathway, and the proliferation, migration and invasion properties of different HCC cells. A. Qualitative and quantitative analyses of p-ERK levels in MHCC-97H/REGO, MHCC-97H, SMCC-7721, and MHCC-LM3 cells by western blot. Total protein was extracted after the cells were treated with or without CuET (0.1 μM) for 24 h. B. The viability of MHCC-97H/REGO, MHCC-97H, SMCC-7721 and MHCC-LM3 cells exposed to the indicated concentrations of CuET for 24 h was determined by the CCK-8 assay. Cells were plated in 96-well plates at a density of 103 cells per well. C. Colony formation assay of MHCC-97H/REGO, MHCC-97H, SMCC-7721 and MHCC-LM3 cells. Cells were plated at a density of 103 cells per well and treated with vehicle or CuET at the indicated concentration for 24 h. The treatment-containing medium was then replaced with medium alone for 6 days. D. Cell cycle distributions of different CuET-treated HCC cell lines. Qualitative and quantitative analyses of the expression of cyclin B1 in different HCC cell lines treated with or without CuET (0.1 μM) for 24 h by western blotting. E. Wound healing experiments were performed on different HCC cell lines for 0 h, 24 h and 48 h. Cells were treated with or without CuET (0.1 μM). F. Transwell assays of different HCC cell lines for 24 h. Cells were treated with or without CuET (0.1 μM). G. Qualitative and quantitative analyses of different HCC cell lines treated with or without CuET (0.1 μM) were performed via western blotting to detect changes in the protein levels of EMT-related molecules. n.s: no significant difference, *p < 0.05, **p < 0.01, ***p < 0.001 (one-way ANOVA).
Fig. 5
Fig. 5
Effect of CuET on the regorafenib sensitivity of regorafenib-resistant HCC cells in vitro. A. Viability of MHCC-97H/REGO cells cocultured with the indicated concentrations of CuET (0 μM, 0.1 μM, 0.15 μM, 0.2 μM), the indicated concentrations of regorafenib (0 μM, 1 μM, 5 μM, 10 μM, 20 μM, 40 μM) or a combination of the two for 24 h, as determined by the CCK-8 assay. B. The IC50 values of MHCC-97H/REGO cells presented in A are marked (control-13.77 μM, 0.1 μM CuET-7.38 μM, 0.15 μM CuET-0.42 μM, 0.2 μM CuET-0.15 μM). C-D. Colony formation assay on MHCC-97H/REGO cells. Cells were plated at a density of 500 cells per well and then treated with 0.1 μM CuET, 10 μM regorafenib, or a combination of 0.1 μM CuET and 10 μM regorafenib for 24 h. Quantitative analysis was performed. E-F. Cell cycle distributions of control, regorafenib, CuET, or the combination (same drug concentrations as in Figure C) -treated MHCC-97H/REGO cells. Quantitative analysis was subsequently performed. G-H. Wound healing assay of MHCC-97H/REGO cells after treatment with the control, regorafenib, CuET, or the combination (same drug concentrations as in Figure C) for 0 h, 24 h and 48 h. Quantitative analysis of the cell healing rate was performed. I-J. Transwell assay of MHCC-97H/REGO cells at 8 × 10⁴ cells per well. Cells were treated as presented in Figure C before being plated in the Transwell chamber. Quantitative analysis was subsequently performed. K-L. Qualitative and quantitative analyses of the expression levels of proliferation markers and the EMT markers ERK and p-ERK by western blotting. *p < 0.05, **p < 0.01, ***p < 0.001 (one-way ANOVA).
Fig. 6
Fig. 6
Effect of CuET on regorafenib sensitivity in MHCC-97H/REGO xenograft models in vivo. A. Tumor volume was determined every other day. B. Mouse weight was determined every other day. C. Images of tumors harvested from nude mice after sacrifice. D. Final weights of tumors harvested from nude mice. E-F. p-ERK, vimentin, snail, E-cadherin, N-cadherin and cyclin B1 levels were visualized by immunohistochemistry. Quantitative analysis was subsequently performed. *p < 0.05, **p < 0.01, ***p < 0.001 (one-way ANOVA).

References

    1. Siegel R.L., Miller K.D., Fuchs H.E., Jemal A. Cancer Statistics, 2021. CA Cancer J. Clin. 2021;71(1):7–33. doi: 10.3322/caac.21654. - DOI - PubMed
    1. Maki H., Hasegawa K. Advances in the surgical treatment of liver cancer. Biosci. Trends. 2022;16(3):178–188. doi: 10.5582/bst.2022.01245. - DOI - PubMed
    1. Zhu S., Wu Y., Zhang X., Peng S., Xiao H., Chen S., et al. Targeting N(7)-methylguanosine tRNA modification blocks hepatocellular carcinoma metastasis after insufficient radiofrequency ablation. Mol. Ther. 2023;31(6):1596–1614. doi: 10.1016/j.ymthe.2022.08.004. - DOI - PMC - PubMed
    1. Anwanwan D., Singh S.K., Singh S., Saikam V., Singh R. Challenges in liver cancer and possible treatment approaches. Biochim. Biophys. Acta Rev. Cancer. 2020;1873(1) doi: 10.1016/j.bbcan.2019.188314. - DOI - PMC - PubMed
    1. Finn R.S., Merle P., Granito A., Huang Y.H., Bodoky G., Pracht M., et al. Outcomes of sequential treatment with sorafenib followed by regorafenib for HCC: additional analyses from the phase III RESORCE trial. J. Hepatol. 2018;69(2):353–358. doi: 10.1016/j.jhep.2018.04.010. - DOI - PubMed

LinkOut - more resources