

The method in the madness: Transcriptional control from stochastic action at the single-molecule scale
- PMID: 38954990
- PMCID: PMC11373363
- DOI: 10.1016/j.sbi.2024.102873
The method in the madness: Transcriptional control from stochastic action at the single-molecule scale
Abstract
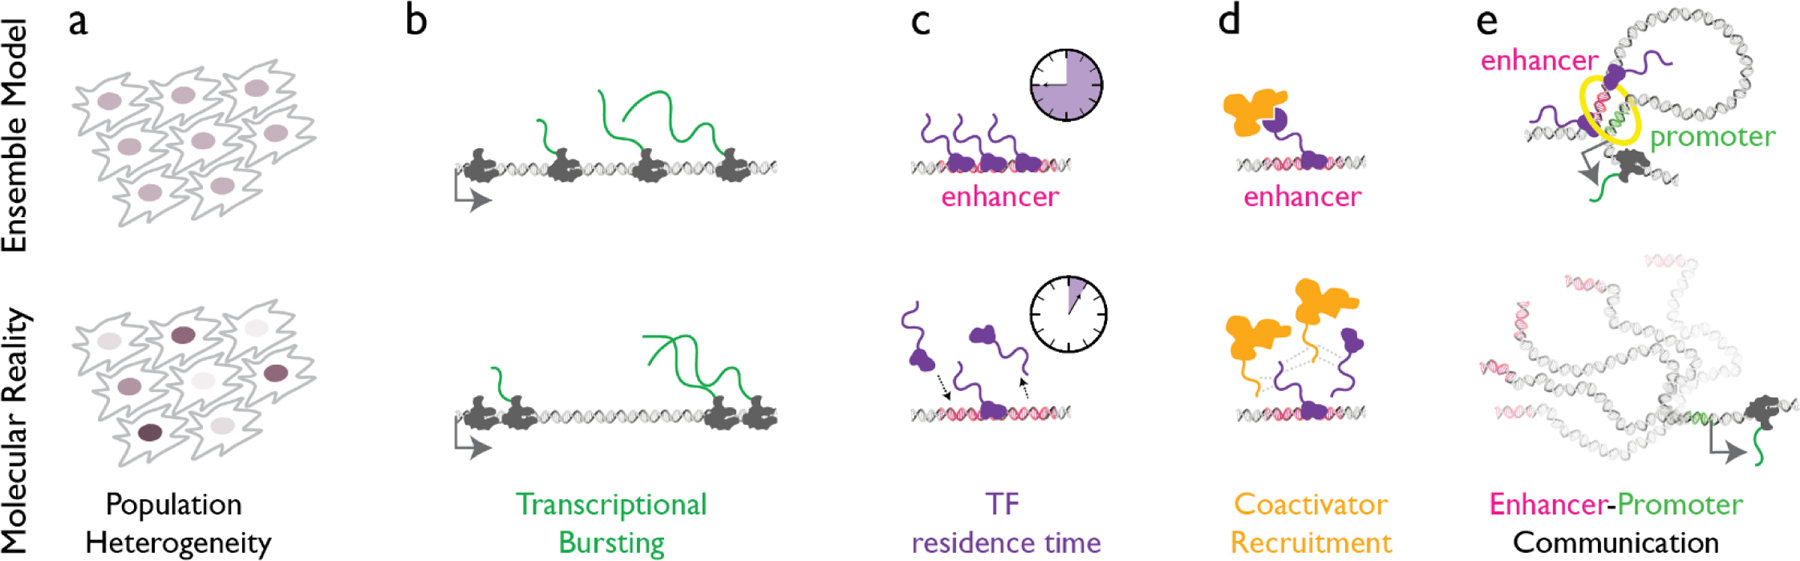
Cell states result from the ordered activation of gene expression by transcription factors. Transcription factors face opposing design constraints: they need to be dynamic to trigger rapid cell state transitions, but also stable enough to maintain terminal cell identities indefinitely. Recent progress in live-cell single-molecule microscopy has helped define the biophysical principles underlying this paradox. Beyond transcription factor activity, single-molecule experiments have revealed that at nearly every level of transcription regulation, control emerges from multiple short-lived stochastic interactions, rather than deterministic, stable interactions typical of other biochemical pathways. This architecture generates consistent outcomes that can be rapidly choreographed. Here, we highlight recent results that demonstrate how order in transcription regulation emerges from the apparent molecular-scale chaos and discuss remaining conceptual challenges.
Copyright © 2024 The Authors. Published by Elsevier Ltd.. All rights reserved.
Conflict of interest statement
Declaration of competing interest The authors declare the following financial interests/personal relationships which may be considered as potential competing interests: Timothee Lionnet reports financial support was provided by National Institutes of Health. Peter H Whitney reports financial support was provided by National Institutes of Health. Timothee Lionnet has patent related to Janelia Fluor Dyes with royalties paid to Tocris, Hello Bio and Eikon Therapeutics.
Figures

Similar articles
-
How lived experiences of illness trajectories, burdens of treatment, and social inequalities shape service user and caregiver participation in health and social care: a theory-informed qualitative evidence synthesis.Health Soc Care Deliv Res. 2025 Jun;13(24):1-120. doi: 10.3310/HGTQ8159. Health Soc Care Deliv Res. 2025. PMID: 40548558
-
Short-Term Memory Impairment.2024 Jun 8. In: StatPearls [Internet]. Treasure Island (FL): StatPearls Publishing; 2025 Jan–. 2024 Jun 8. In: StatPearls [Internet]. Treasure Island (FL): StatPearls Publishing; 2025 Jan–. PMID: 31424720 Free Books & Documents.
-
A rapid and systematic review of the clinical effectiveness and cost-effectiveness of paclitaxel, docetaxel, gemcitabine and vinorelbine in non-small-cell lung cancer.Health Technol Assess. 2001;5(32):1-195. doi: 10.3310/hta5320. Health Technol Assess. 2001. PMID: 12065068
-
"I Don't Understand Their Sense of Belonging": Exploring How Nonbinary Autistic Adults Experience Gender.Autism Adulthood. 2024 Dec 2;6(4):462-473. doi: 10.1089/aut.2023.0071. eCollection 2024 Dec. Autism Adulthood. 2024. PMID: 40018066
-
The Black Book of Psychotropic Dosing and Monitoring.Psychopharmacol Bull. 2024 Jul 8;54(3):8-59. Psychopharmacol Bull. 2024. PMID: 38993656 Free PMC article. Review.
Cited by
-
Pervasive and programmed nucleosome distortion patterns on single mammalian chromatin fibers.bioRxiv [Preprint]. 2025 Jan 22:2025.01.17.633622. doi: 10.1101/2025.01.17.633622. bioRxiv. 2025. PMID: 39896524 Free PMC article. Preprint.
-
Liquid condensates: a new barrier to loop extrusion?Cell Mol Life Sci. 2025 Feb 20;82(1):80. doi: 10.1007/s00018-024-05559-8. Cell Mol Life Sci. 2025. PMID: 39976773 Free PMC article. Review.
References
-
- Chen L-F, Lee J, Boettiger A. Recent progress and challenges in single-cell imaging of enhancer-promoter interaction. Curr Opin Genet Dev 2023;79: 102023. - PubMed
Publication types
MeSH terms
Substances
Grants and funding
LinkOut - more resources
Full Text Sources
