. 2024 Jul;291(2026):20240868.
doi: 10.1098/rspb.2024.0868. Epub 2024 Jul 3.

Biogeographic and seasonal differences in consumer pressure underlie strong predation in the tropics

Affiliations

Biogeographic and seasonal differences in consumer pressure underlie strong predation in the tropics

Michele F Repetto et al. Proc Biol Sci. 2024 Jul.

Abstract

Biotic interactions play a critical role in shaping patterns of global biodiversity. While several macroecological studies provide evidence for stronger predation in tropical regions compared with higher latitudes, results are variable even within the tropics, and the drivers of this variability are not well understood. We conducted two complementary standardized experiments on communities of sessile marine invertebrate prey and their associated predators to test for spatial and seasonal differences in predation across the tropical Atlantic and Pacific coastlines of Panama. We further tested the prediction that higher predator diversity contributes to stronger impacts of predation, using both direct observations of predators and data from extensive reef surveys. Our results revealed substantially higher predation rates and stronger effects of predators on prey in the Pacific than in the Atlantic, demonstrating striking variation within tropical regions. While regional predator diversity was high in the Atlantic, functional diversity at local scales was markedly low. Peak predation strength in the Pacific occurred during the wet, non-upwelling season when ocean temperatures were warmer and predator communities were more functionally diverse. Our results highlight the importance of regional biotic and abiotic drivers that shape interaction strength and the maintenance of tropical communities, which are experiencing rapid environmental change.

Keywords: biotic interactions; predation; temperature; top-down control; tropical; upwelling.


Conflict of interest statement

We declare we have no competing interests.

Figures

Map of study locations for exclusion and exposure experiments on the Atlantic and Pacific coasts of Panama
Figure 1.
Map of study locations for exclusion and exposure experiments on the Atlantic and Pacific coasts of Panama (see electronic supplementary material, table S1, for further information).
Prey community biomass from (a) predator exclusion and (b) short-term predator exposure experiments by coast and season
Figure 2.
Prey community biomass from (a) predator exclusion and (b) short-term predator exposure experiments by coast and season. Biomass (LN biomass, g) is reported as estimated marginal means. Symbols indicate treatments. Asterisks indicate significant treatment contrasts (α = 0.05; electronic supplementary material, table S3).
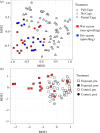
Non-metric multidimensional scaling (nMDS) plots for Pacific prey communities from (a) predator exclusion and (b) short-term predator exposure experiments
Figure 3.
Non-metric multidimensional scaling (nMDS) plots for Pacific prey communities from (a) predator exclusion and (b) short-term predator exposure experiments. For (a), impacts of predation were observed in both wet and dry seasons in the Pacific. For (b), only observations from Pacific wet season (non-upwelling) communities are included; observations from the Pacific dry season (upwelling) are omitted because no effects on prey composition were detected. Symbols indicate treatments. Each point represents a single prey community, with greater distance between points indicating greater dissimilarity. Focal contrast shown in colour, with wet season in red and dry season in blue.
Comparison of total strikes by predator species from short-term exposure experiments by coast and season
Figure 4.
Comparison of total strikes by predator species from short-term exposure experiments by coast and season. Bars are coloured by unique fish species and show the total number of strikes on panel communities pooled across sites. Higher predator diversity and total strikes were observed during the Pacific wet season (non-upwelling) compared with the dry season, and Pacific communities were consistently more diverse than Atlantic communities.
Comparison of seasonal differences in (a) taxonomic diversity (Shannon diversity index, H′), and (b) functional diversity (PSV) of observed fish predators from short-term exposure experiments in the Pacific
Figure 5.
Comparison of seasonal differences in (a) taxonomic diversity (Shannon diversity index, H´), and (b) functional diversity (PSV) of observed fish predators from short-term exposure experiments in the Pacific. Diversity metrics were computed using predator strikes on individual prey communities (panels) and are pooled across sites for visual comparison. Data are shown as mean values ± s.e. Data from Atlantic communities are not shown because observations never included more than one predator species per sample, thus all diversity metrics were zero and there was no difference across seasons. *** indicates significant difference, p < 0.001.
Coastal differences in species diversity (Shannon diversity index) of fish communities from the REEF dataset
Figure 6.
Coastal differences in species diversity (Shannon diversity index, H') of fish communities from the REEF dataset (ATL = tropical western Atlantic, TWA; PAC = tropical eastern Pacific, TEP). Each point represents a surveyed dive site. Outliers are indicated with individual data points. Different letters above each box plot indicate significant differences in diversity between coasts at α = 0.05.
Abundances by coast for a subset of fish families from the REEF dataset that include consumer species commonly observed from exposure videos
Figure 7.
Abundances by coast for a subset of fish families from the REEF dataset that include consumer species commonly observed from exposure videos. Species from the order perciformes (top) and tetraodontiformes (bottom) are included. Each panel represents a fish family, with multiple species per family represented. Violin plots represent distributions of fish abundance scores by coast (Atlantic = light blue, Pacific = dark blue), with y-axis values representing abundance scores calculated as a function of sighting frequency and density, ranging from 0 to 4 (REEF). Each point represents a species recorded at a distinct dive site. Fish silhouettes were added using the R package fishualize and are not to scale [62].

Similar articles

References

    1. Holt RD. 1977. Predation, apparent competition, and the structure of prey communities. Theor. Popul. Biol. 12 , 197–229. ( 10.1016/0040-5809(77)90042-9) - DOI - PubMed
    1. Shurin JB, Allen EG. 2001. Effects of competition, predation, and dispersal on species richness at local and regional scales. Am. Nat. 158 , 624–637. ( 10.1086/323589) - DOI - PubMed
    1. Menge BA, Sutherland JP. 1976. Species diversity gradients: synthesis of the roles of predation, competition, and temporal heterogeneity. Am. Nat. 110 , 351–369. ( 10.1086/283073) - DOI
    1. Vermeij GJ. 1987. The dispersal barrier in the tropical Pacific: implications for molluscan speciation and extinction. Evolution 41 , 1046–1058. ( 10.1111/j.1558-5646.1987.tb05875.x) - DOI - PubMed
    1. Schemske DW. 2009. Biotic interactions and Speciation in the tropics. In Speciation and patterns of diversity (eds Butlin R, Bridle J, Schluter D), pp. 219–239. Cambridge, UK: Cambridge University Press.

LinkOut - more resources