. 2024 Oct 7;73(11):1831-1843.
doi: 10.1136/gutjnl-2024-332225.

Pancreatic STAT5 activation promotes KrasG12D-induced and inflammation-induced acinar-to-ductal metaplasia and pancreatic cancer

Affiliations

Pancreatic STAT5 activation promotes KrasG12D-induced and inflammation-induced acinar-to-ductal metaplasia and pancreatic cancer

Yuli Lin et al. Gut. .

Erratum in

Abstract

Objective: Pancreatic ductal adenocarcinoma (PDAC) is a highly lethal malignancy because it is often diagnosed at a late-stage. Signal transducer and activator of transcription 5 (STAT5) is a transcription factor implicated in the progression of various cancer types. However, its role in KRAS-driven pancreatic tumourigenesis remains unclear.

Design: We performed studies with LSL-Kras G12D; Ptf1a-Cre ERT (KCERT) mice or LSL-KrasG12D; LSL-Trp53R172H ; Pdx1-Cre (KPC) mice crossed with conditional disruption of STAT5 or completed deficiency interleukin (IL)-22. Pancreatitis was induced in mice by administration of cerulein. Pharmacological inhibition of STAT5 on PDAC prevention was studied in the orthotopic transplantation and patient-derived xenografts PDAC model, and KPC mice.

Results: The expression and phosphorylation of STAT5 were higher in human PDAC samples than control samples and high levels of STAT5 in tumour cells were associated with a poorer prognosis. The loss of STAT5 in pancreatic cells substantially reduces the KRAS mutation and pancreatitis-derived acinar-to-ductal metaplasia (ADM) and PDAC lesions. Mechanistically, we discovered that STAT5 binds directly to the promoters of ADM mediators, hepatocyte nuclear factor (HNF) 1β and HNF4α. Furthermore, STAT5 plays a crucial role in maintaining energy metabolism in tumour cells during PDAC progression. IL-22 signalling induced by chronic inflammation enhances KRAS-mutant-mediated STAT5 phosphorylation. Deficiency of IL-22 signalling slowed the progression of PDAC and ablated STAT5 activation.

Conclusion: Collectively, our findings identified pancreatic STAT5 activation as a key downstream effector of oncogenic KRAS signalling that is critical for ADM initiation and PDAC progression, highlighting its potential therapeutic vulnerability.

Keywords: ENERGY METABOLISM; INFLAMMATION; PANCREATIC CANCER.


Conflict of interest statement

Competing interests: None declared.

Figures
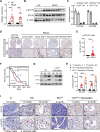
Figure 1
Figure 1. Activated pancreatic signal transducer and activator of transcription 5 (STAT5) in pancreatic cancer and correlates with adverse patient outcomes. (A) STAT5A/STAT5B mRNA in matched non-cancer and cancer tissues of patients with pancreatic ductal adenocarcinoma (PDAC) (N=16). (B) Western blot showing STAT5 and STAT5 phosphorylation (p-STAT5) protein levels in non-cancer and cancer tissues of patients with PDAC (NP=normal pancreas). (C) STAT5A/STAT5B mRNA in isolated tumour cells, fibroblasts, immune cells and endothelial cells in the PDAC cancer tissues (N=3). (D and E) Representative immunohistochemistry (IHC) p-STAT5-positive staining images (D) and the numbers of p-STAT5+ cells in three randomly chosen 400× HPFs of normal pancreases (N=21) or PDAC cancer tissues (N=120) (E). Scale bar: up 1 mm, 2×; down 50 µm, 400× magnification. (F) Kaplan-Meier survival analysis of human PDAC tissue microarray based on p-STAT5+ level on tumour cells (N=145). (G–I) Representative western blot (G) cell numbers per HPF (H) and IHC staining (I) of STAT5 and p-STAT5 protein levels in Pdx1-Cre mice (C) KrasG12D/+; Pdx1-Cre mice (KC), or Ptf1a-CreERT mice (CERT), KrasG12D/+; Ptf1a -CreERT mice (KCERT) with tamoxifen induction. For H and I, C, KC mice were used at 6, and 10 months after birth. CERT and KCER were used at 1, and 2 months after tamoxifen induction. N=10, Scale bar 50 µm, 400× magnification. Results are representatives of at least three independent experiments, data shown as mean±SEM, ***p<0.001, **p<0.01, *p<0.1, ns, no significance. HPF, high-power field; mRNA, messenger RNA; TC, tumour cell.
Figure 2
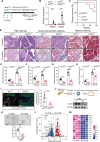
Figure 2. Genetic ablation of pancreatic STAT5 reduces oncogenic KRAS-induced pancreatic ductal adenocarcinoma progression and acinar-to-ductal metaplasia (ADM) formation. (A) Schematic diagram of the study design/strategy. (B) STAT5A/STAT5B messenger RNA in KCERT, CERT, Stat5FL/FL; Ptf1a-CreERT mice (CSERT), Stat5FL/FL; KrasG12D/+; Ptf1a-CreERT mice (KCSERT) with tamoxifen induction (N=7 per group). (C) Kaplan-Meier curves of overall survival of KCERT and KCSERT mice. (D–H) Representative images of H&E staining, Alcian blue-positive staining and Masson staining (D) Percentages of the area of ADM and pancreatic intraepithelial neoplasia (PanIN) (E) Alcian blue positive area (F) Masson positive area (G) area of fibrosis lesions (H) in KCERT and KCSERT mice post-tamoxifen induction (scale bar: 200 µm, 100× magnification). (I) Representative images and quantity of amylase (green), CK-19 (red) and DAPI (blue) staining in pancreatic sections of KCERT and KCSERT mice post-tamoxifen induction. (Scale bar: 50 µm, 400× magnification) (N=7 per group). (J–M) Schematic diagram of the study design and representative western blotting of STAT5 protein levels (J) brightfield images and quantification of tubular ductal structures (K) volcano plot of RNA sequencing data. (L) Heatmap feature of ADM associated genes (M) of explanted acinar cells collected after 5 days from 5-week-old KrasG12D/+ or KrasG12D/+; Stat5FL/FL(KS) mice infected with adenoviruses encoding with or without Cre (−Cre or +Cre). Scale bar, 100 µm, 200× magnification. N=7 for J, N=3 for J–M. Results are representatives of at least three independent experiments, data shown as mean±SEM, ***p<0.001, **p<0.01, *p<0.1, ns, no significance. STAT5, signal transducer and activator of transcription 5.
Figure 3
Figure 3. Pancreatic STAT5 deficiency reduces inflammation-mediated ADM formation. (A) Schematic diagram of the study design/strategy. (B) Stat5a/5b messenger RNA in the pancreata of CERT, KCERT, CSERT and KCSERT mice with or without cerulein-treated (N=8 per group). (C–F) Representative images of H&E staining, Alcian blue-positive staining. (C) Percentages of the area of the ADM and pancreatic intraepithelial neoplasia, Alcian blue-positive area. (D) Representative images (E) and quantity (F) of amylase (green), CK-19 (red) and DAPI (blue) staining of the pancreas from CERT, CSERT, KCERT, KCSERT at 3 and 21 days after cerulein treatment (scale bar: 50 µm, 400× magnification for H&E staining) and (E). Scale bar: 100 µm, 200× magnification for Alcian blue staining. N=7 per group. Results are representatives of at least three independent experiments, data shown as mean±SEM, ***p<0.001, **p<0.01, *p<0.1, ns, no significance. ADM, acinar-to-ductal metaplasia; STAT5, signal transducer and activator of transcription 5.
Figure 4
Figure 4. STAT5 deficiency delays KPC mice and orthotopic pancreatic tumour growth. (A–C) Representative images of H&E and Masson staining (A) percentages of the area of PanIN/PDAC (B) and fibrosis lesions (C) of KPC and KPCS mice at 3 and 5 months. Scale bar: 100 µm, 200× magnification. (D and E) Representative images of pancreas and tumour weight from orthotopic PDAC model constructed by KPC119 and Stat5KD KPC119 (D) or by Panc02 and Stat5KD Panc02 cells (E). (F and G) Representative images of pancreas and tumour weight from an orthotopic PDAC model constructed by KPC119 (F) or Panc02 (G) cell lines with or without STAT5 inhibitor administration. (H–J) Tumour growth curves (H) tumour weight (I) and survival curve (J) of patient-derived xenografts from patients with PDAC. N=7 for H and I, N=9 for J. (K and L) Representative images of H&E staining and Masson staining (K) percentages of the area of PanIN/PDAC and fibrosis lesions (L) of 3 months KPC mice treated with or without STAT5-IN for 1 months. (N=7) Results are representatives of at least two independent experiments, data shown as mean±SEM, ***p<0.001, **p<0.01, *p<0.1, ns, no significance. PanIN, pancreatic intraepithelial neoplasia; PDAC, pancreatic ductal adenocarcinoma; STAT5, signal transducer and activator of transcription 5.
Figure 5
Figure 5. STAT5 deficiency impairs pancreatic tumour energy metabolism. (A) Bubble diagram of GO pathways (A) heatmap feature of lipid-metabolic process-associated genes (B) of explanted acinar cells collected from 3-week-old K or KS mice infected with Cre. (C and D) Cell viability of KRAS-mutant mouse tumour cell lines KPC119, Panc02 and human tumour cell lines Capan-2, PANC-1, CFPAC-1, HPAC, Capan-1, AsPC1 treated with different concentrations of etomoxir (C) or oligomycin A (D). (E and F) Oxygen consumption rate (OCR) of pancreatic explants from KC and KCS mice at 6 months (E) or KPC and KPCS mice at 3 months (F). (G and H) OCR (G) and ECR (H) of explanted acinar cells collected from 5-week-old C, CS, K, or KS mice affected with Cre. (I and J) OCR of KPC119 and Stat5KD KPC119 cells (I) or Capan-2 and Stat5KD Capan-2, PANC-1 and Stat5KD PANC-1, CFPAC-1 and Stat5KD CFPAC-1 cells (J). (K and L) OCR of KPC119 cells (K) or Capan-2, PANC-1, CFPAC-1 and (L) cells treated with or without STAT5-IN. Oligomycin (Oligo), FCCP, rotenone and antimycin A were injected as indicated. N=3 per group, results are representatives of at least three independent experiments, data shown as mean±SEM, ***p<0.001, **p<0.01, *p<0.1, ns, no significance. ECR, extracellular acidification rate; GO, gene ontology; STAT5, signal transducer and activator of transcription 5.
Figure 6
Figure 6. STAT5-mediated ADM formation through direct transcriptional programming. (A and B) Heatmap feature of ADM-related transcription factors (A) and GSVA analysis (B) in pancreata of K and KS mice post Cre induction. (C) Real-time quantitative PCR analysis of ADM formation-associated genes of explanted acinar cells collected from 5-week-old K or KS mice infected with Cre. (D and E) Chromatin immunoprecipitation assay showing STAT5 binding to the Hnf4a promoter regions in primary acinar cells collected from 16-week-old KC mice or Kras-mutant tumour cell lines KPC119 (D) AsPC1, PANC1 and Capan-2 (E). (F and G) mRNA expression of Hnf4a in primary acinar cells (F) and different tumour cell lines (G) infected with Stat5 siRNA. (H and I) mRNA expression of Hnf4a in primary acinar cells (H) and different tumour cell lines (I) treated with STAT5 inhibitor. (J) Representative IHC images of HNF4α (right) and quantification of HNF4α-positive ADM cells (left) in pancreata of KCERT and KCSERT mice (scale bar: 50 µm, 400× magnification). (K and L) Brightfield images (K) and relative expression of duct cell markers (L) of explanted acinar cells collected from KC mice infected with Hnf4a siRNA (scale bar: 100 µm, 200× magnification). (M) OCR and ECAR of KPC119, Hnf4aKD KPC119 cells and Hnf1bKD KPC119 cells. (N) OCR and ECAR of KPC119, Stat5KD KPC119 cells with or without overexpression HNF4α. N=3 per group. Results are representatives of at least three independent experiments, data shown as mean±SEM, ***p<0.001, **p<0.01, *p<0.1, ns, no significance. ADM, acinar-to-ductal metaplasia; ECAR, extracellular acidification rate; GSVA, gene set variation analysis; HNF, hepatocyte nuclear factor; HPF, high-power field; mRNA, messenger RNA; OCR, oxygen consumption rate; STAT5, signal transducer and activator of transcription 5.
Figure 7
Figure 7. KrasG12D mutation and IL-22 promoted pancreatic STAT5 activation. (A and B) Representative western blot showing STAT5 and p-STAT5 protein levels in pancreata of WT and KC mice (A) KPC119 and Panc-02 cell lines (B) treated with or without various inhibitors. (C) Representative western blot showing STAT5, p-STAT5, STAT3, p-STAT3, janus kinase (JAK) 1, p-JAK1, JAK2 and p-JAK2 protein levels in different inflammatory factors-treated acinar cells from KC mice. (D) Representative western blot showing STAT5 and p-STAT5 protein levels in JAKs inhibitor pretreated pancreata of WT and KC mice stimulated without or with IL-22. (E) Brightfield images of explanted acinar cells and quantification of tubular ductal structures collected from KC mice treated without or with IL-22 and/or STAT5 inhibitor (scale bar: 50 µm, 400× magnification) (n=6 per group). (F) IL-22 protein levels were measured by ELISA pancreata of WT and KC mice treated without or with cerulein (n=6 per group). (G) IL22 messenger RNA in isolated tumour cells, fibroblasts, immune cells and endothelial cells from the PDAC cancer tissues (n=3). (H) Representative flow cytometric figures and percentages of IL-22+CD4+ cells in the pancreata of WT and KC mice treated without or with cerulein (n=3 per group). (I–O) Representative immunohistochemical images (I) quantitation of ADM structures (J) and numbers of p-STAT5 and HNF4α cells counted per HPF (K) immunofluorescence staining of amylase (green), CK19 (red) and DAPI (blue) (L) and quantitation of CK19-positive cells (M) representative images of H&E staining (N) and percentages of the area of ADM lesions (O) in pancreata of KC, KC; Il22–/– and KC; Il22raFL/FL mice after cerulein treatment. Scale bar, 50 µm, 400× magnification for I and L, scale bar, 100 µm, 200× magnification for N. (P and Q) Representative images of H&E and Masson staining (P) and percentages of the area of pancreatic intraepithelial neoplasia/PDAC (Q) of KPC and KPC; Il22−/− mice at 3 months. Scale bar: 100 µm, 200× magnification. N=7 per group for I–Q. Results are representatives of at least three independent experiments, data shown as mean±SEM, ***p<0.001, **p<0.01, *p<0.1, ns, no significance. ADM, acinar-to-ductal metaplasia; Areg, amphiregulin; EGF, epidermal growth factor ; GM-CSF, granulocyte-macrophage colony stimulating factor; HNF, hepatocyte nuclear factor; HPF, high-power field; IL, interleukin; M-CSF, macrophage colony stimulating factor; PBS, phosphate-buffered saline; PDAC, pancreatic ductal adenocarcinoma; p-STAT, phosphorylated STAT; STAT, signal transducer and activator of transcription; TGF, transforming growth factor; TSLP, thymic stromal lymphopoietin.

References

    1. Halbrook CJ, Lyssiotis CA, Pasca di Magliano M, et al. Pancreatic cancer: advances and challenges. Cell. 2023;186:1729–54. doi: 10.1016/j.cell.2023.02.014. - DOI - PMC - PubMed
    1. Siegel RL, Wagle NS, Cercek A, et al. Colorectal cancer statistics, 2023. CA Cancer J Clin. 2023;73:233–54. doi: 10.3322/caac.21772. - DOI - PubMed
    1. Navas C, Hernández-Porras I, Schuhmacher AJ, et al. EGF receptor signaling is essential for K-Ras Oncogene-driven pancreatic ductal adenocarcinoma. Cancer Cell. 2012;22:318–30. doi: 10.1016/j.ccr.2012.08.001. - DOI - PMC - PubMed
    1. Habbe N, Shi G, Meguid RA, et al. Spontaneous induction of murine pancreatic intraepithelial neoplasia (mPanIN) by Acinar cell targeting of Oncogenic Kras in adult mice. Proc Natl Acad Sci U S A. 2008;105:18913–8. doi: 10.1073/pnas.0810097105. - DOI - PMC - PubMed
    1. De La O J-P, Emerson LL, Goodman JL, et al. Notch and Kras reprogram pancreatic acinar cells to ductal intraepithelial neoplasia. Proc Natl Acad Sci USA. 2008;105:18907–12. doi: 10.1073/pnas.0810111105. - DOI - PMC - PubMed

MeSH terms

Substances