. 2024 Jul 2;7(9):e202302396.
doi: 10.26508/lsa.202302396. Print 2024 Sep.

Trafficking of mitochondrial double-stranded RNA from mitochondria to the cytosol

Affiliations

Trafficking of mitochondrial double-stranded RNA from mitochondria to the cytosol

Matthew R Krieger et al. Life Sci Alliance. .

Abstract

In addition to mitochondrial DNA, mitochondrial double-stranded RNA (mtdsRNA) is exported from mitochondria. However, specific channels for RNA transport have not been demonstrated. Here, we begin to characterize channel candidates for mtdsRNA export from the mitochondrial matrix to the cytosol. Down-regulation of SUV3 resulted in the accumulation of mtdsRNAs in the matrix, whereas down-regulation of PNPase resulted in the export of mtdsRNAs to the cytosol. Targeting experiments show that PNPase functions in both the intermembrane space and matrix. Strand-specific sequencing of the double-stranded RNA confirms the mitochondrial origin. Inhibiting or down-regulating outer membrane proteins VDAC1/2 and BAK/BAX or inner membrane proteins PHB1/2 strongly attenuated the export of mtdsRNAs to the cytosol. The cytosolic mtdsRNAs subsequently localized to large granules containing the stress protein TIA-1 and activated the type 1 interferon stress response pathway. Abundant mtdsRNAs were detected in a subset of non-small-cell lung cancer cell lines that were glycolytic, indicating relevance in cancer biology. Thus, we propose that mtdsRNA is a new damage-associated molecular pattern that is exported from mitochondria in a regulated manner.


Conflict of interest statement

The authors declare that they have no conflict of interest.

Figures
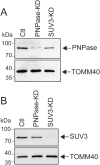
Figure S1.
Figure S1.. Control experiments to validate RNAi of SUV3 and PNPase.
(A) Cells were treated with RNAi constructs to knock down PNPase or SUV3. A negative control (Ctl) that consisted of a non-targeting RNAi construct was included. After 72 h, PNPase KD was confirmed by immunoblot analysis. TOMM40 was included as a loading control. (A, B) As in “(A),” SUV3 levels were assessed by immunoblotting.
Figure 1.
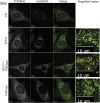
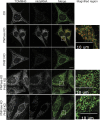
Figure 1.. mtdsRNAs accumulate in mitochondria with SUV3 KD, whereas mtdsRNAs localize to the cytosol with PNPase KD.
SUV3 (PCC = 0.73), PNPase (PCC = 0.55), and the combination (PCC = 0.69) were knocked down (KD) in HeLa cells with the respective RNAi construct followed by fixing on coverslips and imaging after 72 h. The mtdsRNA (red) was investigated by immunofluorescence with the monoclonal J2 antibody. TOMM40 was detected with a polyclonal antibody to mark mitochondria (green), and the images were merged. The right panel contains a magnified portion from the merged image (marked with a white box). As a control (Ctl), the cells were treated with a non-targeting RNAi construct. The bar indicates 10 μm (n = 8).
Figure S2.
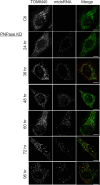
Figure S2.. Time-course study of mtdsRNA accumulation and localization in PNPase KD cells.
PNPase was knocked down by RNAi as in Fig 1, and cells were fixed at the indicated time points post-transfection and then imaged for mitochondria (TOMM40, green) and mtdsRNA (red). As a control (Ctl), a non-targeting RNAi construct was included. PCC values for 48 h (0.59), 72 h (0.56), and 96 h (0.41) were calculated. The bar indicates 10 μm (n = 3).
Figure S3.
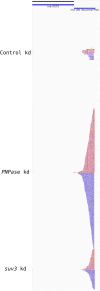
Figure S3.. mtdsRNA-sequencing reads are particularly abundant for the ribosomal RNAs and a portion of the D-loop when PNPase is knocked down.
The dsRNA was immunoprecipitated with the J2 antibody in cells that were treated with RNAi for PNPase, SUV3, or the control, and then, strand-specific sequencing was performed with the Oxford Nanopore system. The H-strand is shown in red, the L-strand is shown in blue, and they are aligned to the mitochondrial genome.
Figure S4.
Figure S4.. Subset of the dsRNA-sequencing reads aligned with the 18S ribosomal RNA.
As in Fig S3, the dsRNA reads were also aligned to the nuclear genome. The only region in which dsRNA was detected was for the 18S ribosomal RNA. The coding strand is shown with red bars and the non-coding strand with the blue bars.
Figure 2.
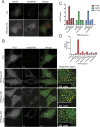
Figure 2.. Cytosolic mtdsRNA co-localizes with TIA-1 but not MDA5, and the type 1 IFN pathway is induced.
(A) PNPase was knocked down by RNAi in HeLa cells, and cells were fixed for immunofluorescence studies at 72 h. MDA5 (green) and mtdsRNA (red) were localized, and the individual images were merged. As a control (Ctl), the cells were treated with a non-targeted RNAi construct. The bar indicates 10 μm (n = 3). (A, B) As in “(A)” except that TIA-1 (green) and mtdsRNA (red) at 48 (PCC = 0.58), 72 (PCC = 0.66), and 96 (PCC = 0.40) hrs were localized. As a control (Ctl), the cells were treated with a non-targeted RNAi construct. The right panel contains a magnified region from the merged image (marked with a white box). The bar indicates 10 μm (n = 3). (C) As in Fig 1, SUV3 and PNPase RNAi constructs were applied to HeLa cells, and 72 h post-transfection, qRT-PCR analysis of IFNB1 and ISG15 and IFI44 was performed. Three technical and biological replicates were analyzed. (C, D) As in “(C)”, qRT-PCR analysis of IFIH1 (MDA5 protein) transcript levels was performed 72 h after the indicated RNAi treatments. Three technical and biological replicates were analyzed.
Figure S5.
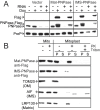
Figure S5.. Characterization of Mat-PNPase and IMS-PNPase constructs confirms correct targeting.
(A) As a control for Fig 3, the expression and localization of Mat-PNPase and IMS-PNPase constructs were confirmed by Western analysis. The constructs contained a C-terminal FLAG tag that was detected with an anti-FLAG antibody. Mitochondria were purified from HeLa cells, and half was subjected to proteinase K (PK) treatment followed by immunoblotting with antibodies against FLAG, TOMM20 (outer membrane), AIF (intermembrane space), and LRP130 (matrix). An aliquot of mitochondria was further treated to osmotic shock by dilution to 0.25 mM sucrose followed by PK treatment in the absence or presence of Triton X-100. (B). HeLa cell lines were transformed with the empty vector, Mat-PNPase, or IMS-PNPase, and expression was induced with 500 ng/ml doxycycline. Simultaneously, endogenous PNPase was knocked down with RNAi. Antibodies against FLAG, PNPase, and PREP (loading control) were used to assess expression.
Figure 3.
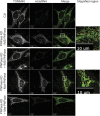
Figure 3.. PNPase targeted to the IMS or matrix rescues PNPase KD.
PNPase constructs were generated in which the native MTS was replaced with an IMS (IMS-PNPase) or matrix (Mat-PNPase) targeting sequence, and the constructs were integrated into a HeLa T-Rex Flp-In cell line; expression was induced with doxycycline. In a series of experiments, the expression of IMS-PNPase or Mat-PNPase was induced (+) with 500 ng/ml doxycycline or not induced (−) followed by PNPase KD. After 60 h, cells were fixed for imaging. The mtdsRNA (red) and mitochondria (green) were detected as in Fig 1. As a control (Ctl), the cells were treated with a scrambled RNAi construct. The bar indicates 10 μm. The right panel contains a magnified region from the merged image (marked with a white box) for conditions in which mtdsRNA was detected (n = 5).
Figure 4.
Figure 4.. BAK and BAX are required for mtdsRNA release to the cytosol.
(A) BAK/BAX double-knockout MEF cell line was used for PNPase KD as in Fig 1. Mitochondria (green) were marked with anti-TOMM40, mtdsRNA (red) was marked with anti-J2 antibody, and the images were merged. The right panel contains a magnified region from the merged image (marked with a white box) for conditions in which mtdsRNA was detected (n = 4). (B) HeLa cells were treated with 100 μM BAX inhibitor peptide V5, and PNPase was knocked down as in Fig 1. Mitochondria (green) were marked with anti-TOMM40, and mtdsRNA (red) was marked with anti-J2. The images were merged. As a control (Ctl), the cells were treated with a scrambled RNAi construct. The bar indicates 10 μm (n = 4).
Figure 5.
Figure 5.. Knockdown or inhibition of VDAC1 or VDAC2 prevents mtdsRNA release to the cytosol.
The indicated knockdown combinations for PNPase, VDAC1, and VDAC2 were generated in HeLa cells as in Fig 1. The mtdsRNAs (green) and mitochondria (red) were detected by immunofluorescence with the J2 antibody and anti-TOMM40, respectively. The merged images are presented in the right column. The control (Ctl) is a scrambled RNAi construct. The bar indicates 10 μm (n = 6).
Figure S6.
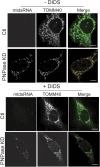
Figure S6.. VDAC inhibitor DIDS prevents mtdsRNA export to the cytosol.
As in Fig 5, HeLa cells were knocked down for PNPase, simultaneously treated with 50 μM DIDS, and then imaged at 60 h. Mitochondria (green) were marked with anti-TOMM40, and mtdsRNA (red) was marked with anti-J2. The images were merged. As a control (Ctl), the cells were treated with a scrambled RNAi construct for PNPase.
Figure S7.
Figure S7.. Knockdown of inner membrane proteins CLIC5 or GHITM does not block export of mtdsRNA to the cytosol.
(A) As in Fig 5, the inner membrane protein CLIC5 and PNPase were knocked down by RNAi and in HeLa cells. The mtdsRNAs (red) and mitochondria (green) were detected by immunofluorescence with the J2 antibody and anti-TOMM40, respectively. The merged images are presented in the right column. The control (Ctl) is a scrambled RNAi construct for PNPase. The bar indicates 10 μm (n = 3). (A, B) As in “(A)” with GHITM.
Figure 6.
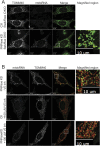
Figure 6.. Knockdown or inhibition of PHB1 or PHB2 prevents mtdsRNA release to the cytosol.
The indicated knockdown combinations for PNPase, PHB1, and PHB2 were generated in HeLa cells as in Fig 1. The mtdsRNAs (red) and mitochondria (green) were detected by immunofluorescence with the J2 antibody and anti-TOMM40, respectively. The merged images are presented in the right column. The control (Ctl) is a scrambled RNAi construct for PNPase. The bar indicates 10 μm (n = 5).
Figure S8.
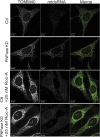
Figure S8.. Treatment with the PHB inhibitor, rocaglamide, prevents mtdsRNA release to the cytosol.
As in Fig 6, HeLa cells were knocked down for PNPase and simultaneously treated with 25 nM rocaglamide (Roc-A) followed by imaging at 60 h. Mitochondria (green) were marked with anti-TOMM40, and mtdsRNA (red) was marked with anti-J2. The images were merged. As a control (Ctl), the cells were treated with a scrambled RNAi construct. The bar indicates 10 μm (n = 5).
Figure S9.
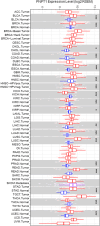
Figure S9.. Analysis of PNPT1 expression in various tumors indicates PNPase may be up-regulated.
The expression level of PNPT1 was analyzed from data in The Cancer Genome Atlas project using Tumor Immune Estimation Resource (TIMER; https://cistrome.shinyapps.io/timer/) (PMID: 29092952) in a variety of tumors (shown in red), including lung adenocarcinoma (LUAD) and lung squamous cell carcinoma (LUSC), and normal controls (shown in blue), when available. Statistical significance was calculated by the Wilcoxon test. Additional abbreviations include ACC, adrenocortical carcinoma; BLCA, bladder urothelial carcinoma; BRCA, breast invasive carcinoma; CESC, cervical and endocervical carcinoma; CHOL, cholangiocarcinoma; COAD, colon adenocarcinoma; DLBC, diffuse large B-cell carcinoma; ESCA, esophageal carcinoma; GBM, glioblastoma multiforme; HNSCC, head and neck squamous cell carcinoma; KICH, kidney chromophobe; KIRC, kidney renal clear cell carcinoma; KIRP, kidney renal papillary cell carcinoma; LAML, acute myeloid leukemia; LGG, brain lower grade glioma; LIHC, liver hepatocellular carcinoma; MESO, mesothelioma; OV, ovarian serous cystadenocarcinoma; PAAD, pancreatic adenocarcinoma; PCPG, pheochromocytoma and paraganglioma; PRAD, prostate adenocarcinoma; READ, rectum adenocarcinoma; SARC, sarcoma; SKMC, skin cutaneous melanoma; STAD, stomach adenocarcinoma; TGCT, testicular germ cell tumors; THCA, thyroid carcinoma; THYM, thymoma; UCEC, uterine corpus endometrial carcinoma; UCS, uterine carcinosarcoma; UVM, uveal melanoma. One asterisk represents P < 0.05, two asterisks represent P < 0.01, and three asterisks represent P < 0.001.
Figure 7.
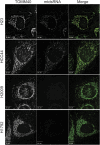
Figure 7.. Subset of NSCLC cell lines have mtdsRNA localized to the cytosol.
The NSCLC cell lines, H23, HCC44, H2009, and H1792, were grown on coverslips and fixed for immunofluorescence. Mitochondria (green) and mtdsRNA (red) were detected as in Fig 1. The bar indicates 10 μm (n = 3).
Figure 8.
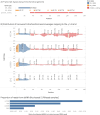
Figure 8.. Sequencing of the dsRNA in H23 and HCC44 cell lines confirms that the dsRNA is from mitochondria.
RNA was purified from the H23, HCC44, and H2009 cell lines, and a negative control cell (1B-S) line, and dsRNA was prepared for sequencing. The total content and fraction of mitochondrial double-stranded reads were determined by sliding a window across the aligned read files and returning the coverage of reads mapping to the ± strand for each window. (A) Schematic of the mitochondrial genome, including coding regions, ribosomal RNAs, and tRNAs. (B) Distribution of aligned reads to the mitochondrial genome. The x-axis represents mitochondrial DNA coordinates (3k to 16k). The y-axis indicates the number of reads that overlap each sliding window for each of the four samples (HCC44, H23, H2009, and 1B-S). Positive and negative reads are represented, respectively, by regions above and below the baseline. The lower panel displays the estimated proportion of dsRNA reads per sample.

References

    1. Antonicka H, Sasarman F, Nishimura T, Paupe V, Shoubridge EA (2013) The mitochondrial rna-binding protein grsf1 localizes to rna granules and is required for posttranscriptional mitochondrial gene expression. Cell Metab 17: 386–398. 10.1016/j.cmet.2013.02.006 - DOI - PubMed
    1. Asadi MR, Sadat Moslehian M, Sabaie H, Jalaiei A, Ghafouri-Fard S, Taheri M, Rezazadeh M (2021) Stress granules and neurodegenerative disorders: A scoping review. Front Aging Neurosci 13: 650740. 10.3389/fnagi.2021.650740 - DOI - PMC - PubMed
    1. Bandiera S, Mategot R, Girard M, Demongeot J, Henrion-Caude A (2013) Mitomirs delineating the intracellular localization of micrornas at mitochondria. Free Radic Biol Med 64: 12–19. 10.1016/j.freeradbiomed.2013.06.013 - DOI - PubMed
    1. Becker T, Song J, Pfanner N (2019) Versatility of preprotein transfer from the cytosol to mitochondria. Trends Cell Biol 29: 534–548. 10.1016/j.tcb.2019.03.007 - DOI - PubMed
    1. Ben-Hail D, Shoshan-Barmatz V (2016) Vdac1-interacting anion transport inhibitors inhibit vdac1 oligomerization and apoptosis. Biochim Biophys Acta 1863: 1612–1623. 10.1016/j.bbamcr.2016.04.002 - DOI - PubMed

MeSH terms