. 2024 Oct;52(10):2854-2871.
doi: 10.1007/s10439-024-03550-9. Epub 2024 Jul 2.

Instrumented Mouthguard Decoupling Affects Measured Head Kinematic Accuracy

Affiliations

Instrumented Mouthguard Decoupling Affects Measured Head Kinematic Accuracy

Ryan A Gellner et al. Ann Biomed Eng. 2024 Oct.

Abstract

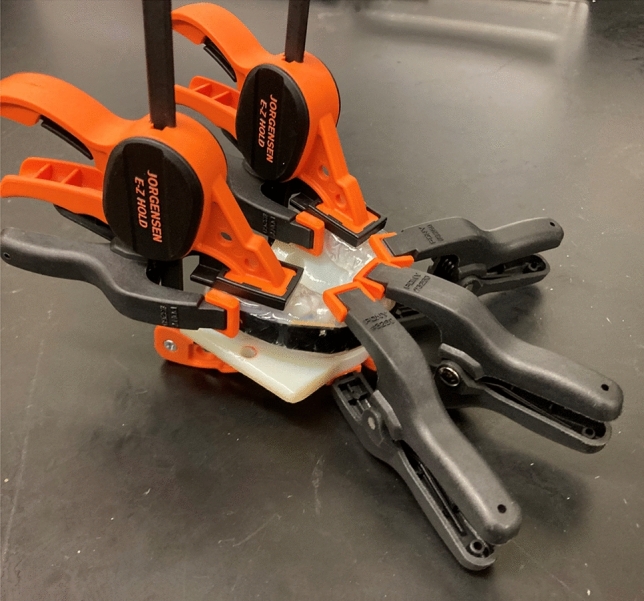
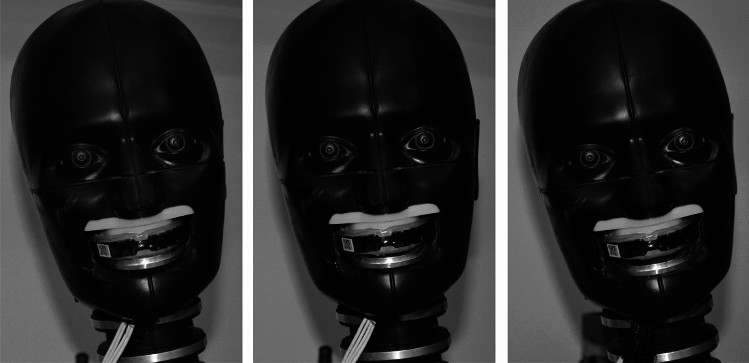
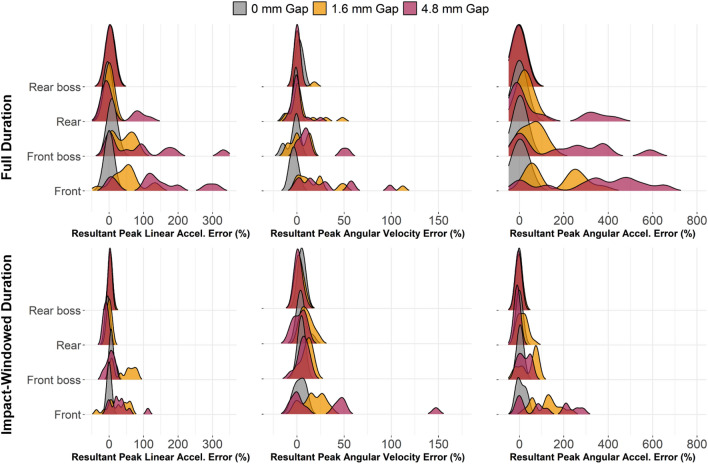
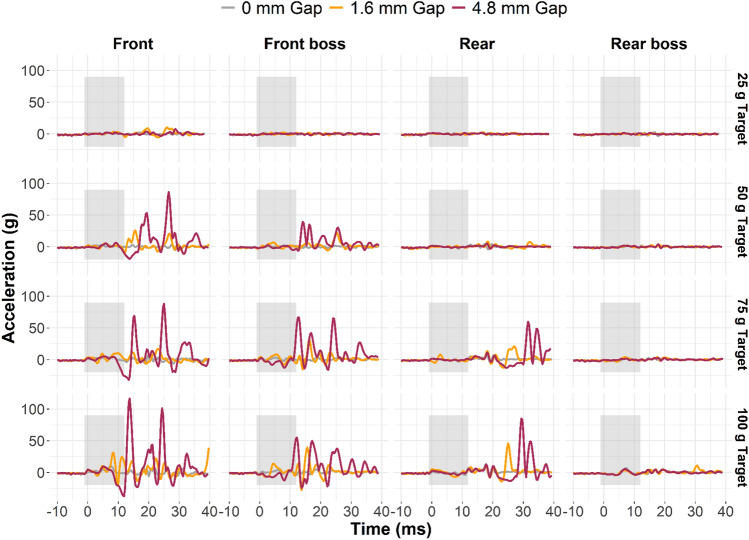
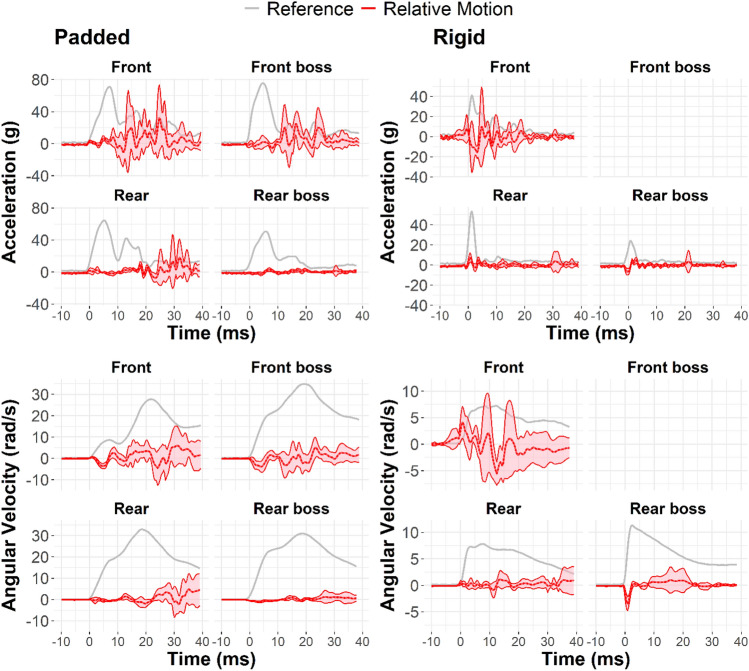
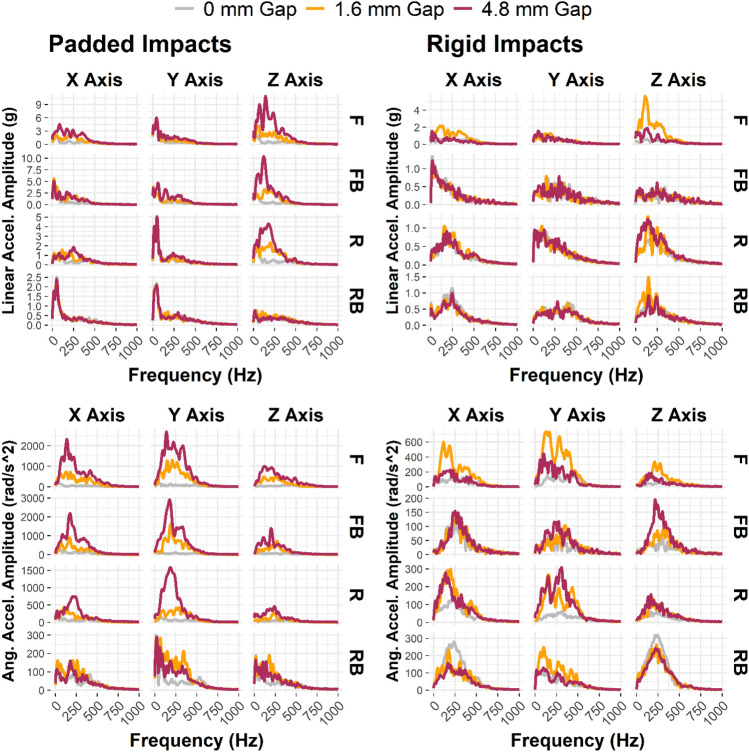
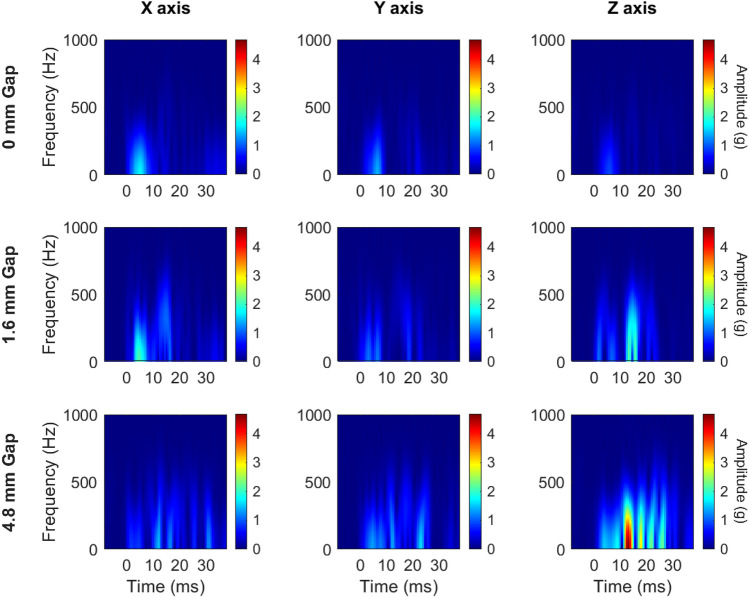
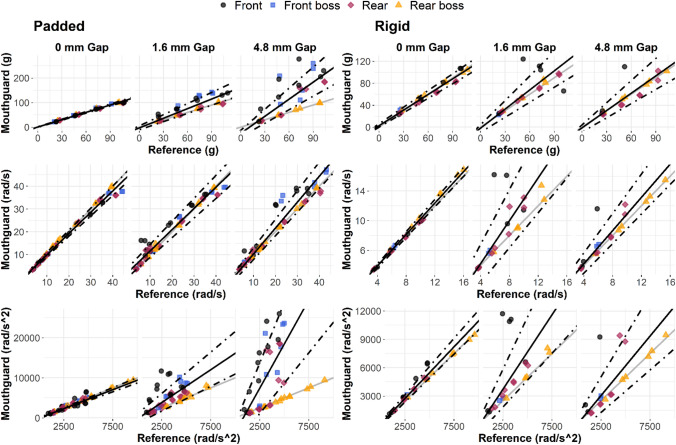
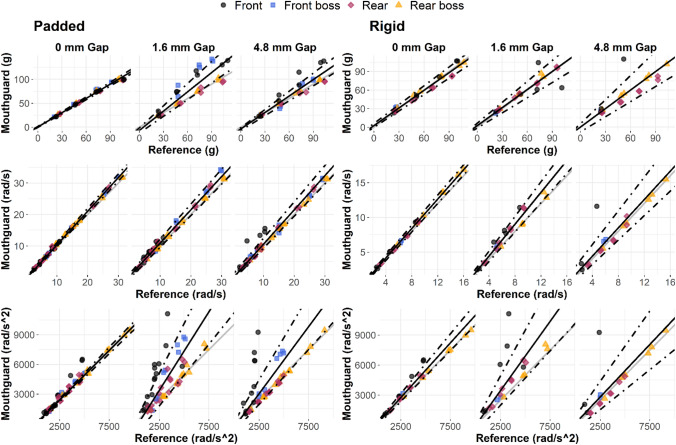
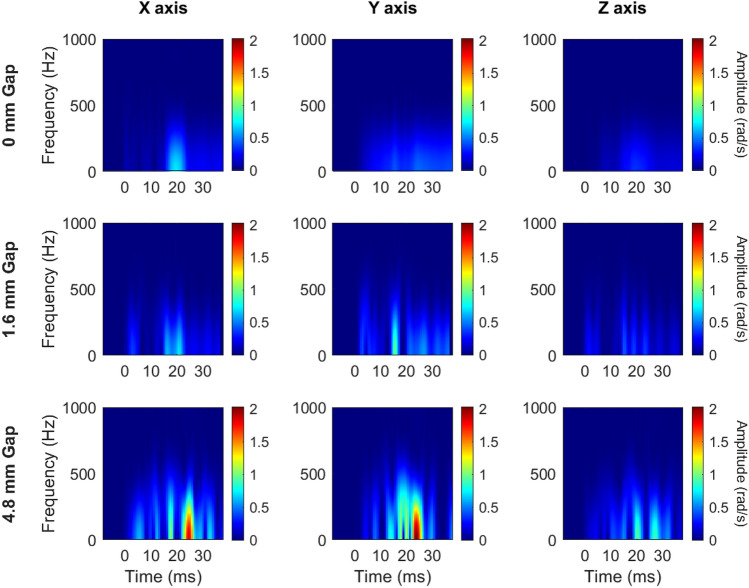
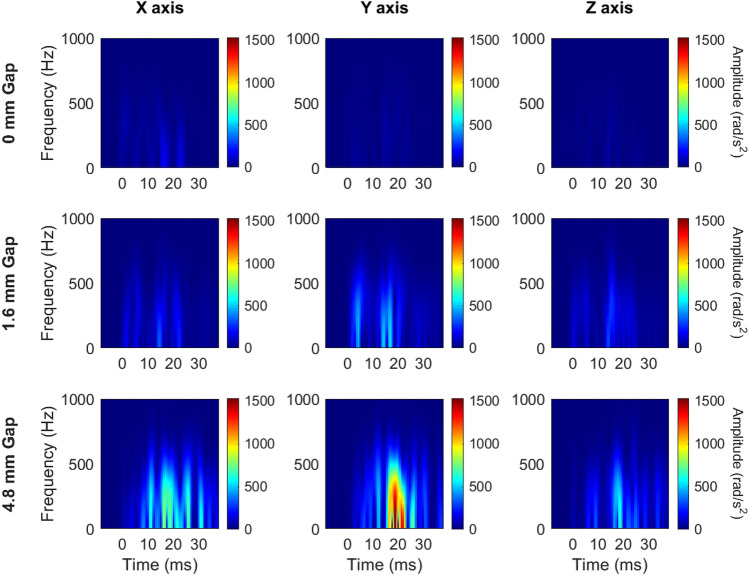
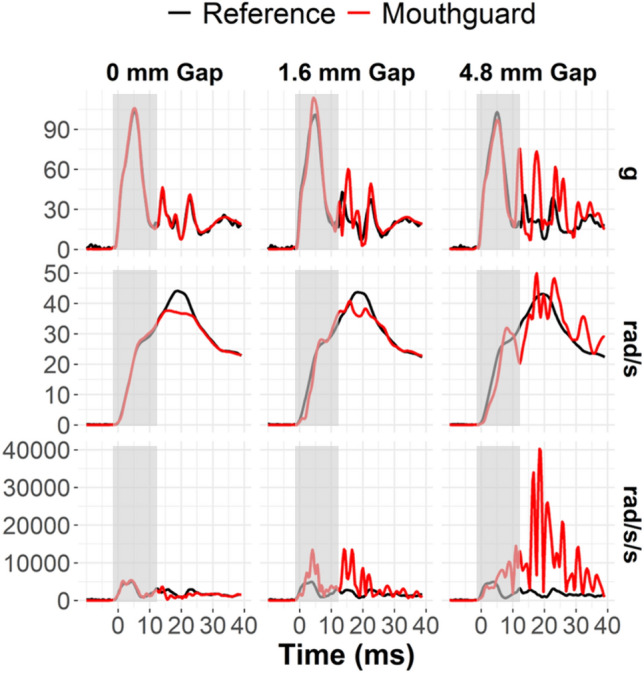
Many recent studies have used boil-and-bite style instrumented mouthguards to measure head kinematics during impact in sports. Instrumented mouthguards promise greater accuracy than their predecessors because of their superior ability to couple directly to the skull. These mouthguards have been validated in the lab and on the field, but little is known about the effects of decoupling during impact. Decoupling can occur for various reasons, such as poor initial fit, wear-and-tear, or excessive impact forces. To understand how decoupling influences measured kinematic error, we fit a boil-and-bite instrumented mouthguard to a 3D-printed dentition mounted to a National Operating Committee on Standards for Athletic Equipment (NOCSAE) headform. We also instrumented the headform with linear accelerometers and angular rate sensors at its center of gravity (CG). We performed a series of pendulum impact tests, varying impactor face and impact direction. We measured linear acceleration and angular velocity, and we calculated angular acceleration from the mouthguard and the headform CG. We created decoupling conditions by varying the gap between the lower jaw and the bottom face of the mouthguard. We tested three gap conditions: 0 mm (control), 1.6 mm, and 4.8 mm. Mouthguard measurements were transformed to the CG and compared to the reference measurements. We found that gap condition, impact duration, and impact direction significantly influenced mouthguard measurement error. Error was higher for larger gaps and in frontal (front and front boss) conditions. Higher errors were also found in padded conditions, but the mouthguards did not collect all rigid impacts due to inherent limitations. We present characteristic decoupling time history curves for each kinematic measurement. Exemplary frequency spectra indicating characteristic decoupling frequencies are also described. Researchers using boil-and-bite instrumented mouthguards should be aware of their limitations when interpreting results and should seek to address decoupling through advanced post-processing techniques when possible.

Keywords: Boil-and-bite; Decoupling; Head; Impact; Instrumented mouthguard; Kinematics; Measurement error.


Conflict of interest statement

The authors report no conflicts of interest.

Figures

Fig. 1
Fig. 1
a Gravity-driven pendulum impactor used to accelerate headform. b NOCSAE headform with 3D-printed dentition and boil and bite mouthguard in place (lower dentition plate not shown)
Fig. 2
Fig. 2
Spring clamps provided “bite” force for fitting the boil-and-bite mouthguard to the 3D-printed dentition
Fig. 3
Fig. 3
Lower dentition to mouthguard gap conditions from left to right: 0 mm, 1.6 mm, and 4.8 mm
Fig. 4
Fig. 4
Probability distributions of percent error for each kinematic by impact location and duration. Differences in error by impact location were observed regardless of gap size, with differences becoming more pronounced with increases in gap size. Front and front boss impacts tended to exhibit wider error distributions than rear and rear boss impacts. Windowing the signals to the impact duration resulted in tighter error distributions
Fig. 5
Fig. 5
Weighted least product slope and intercept estimates and bootstrapped confidence intervals. Gap conditions generally had slope values further from one and intercept values further from zero. Limiting the analysis window to the impact duration (orange dots) generally produced slopes closer to one and intercepts closer to zero, especially in the 1.6 mm and 4.8 mm gap conditions. Filled points indicate statistically significant proportional (slope) or fixed (intercept) bias
Fig. 6
Fig. 6
Exemplar average relative linear acceleration time traces at the teeth for each gap condition in padded impacts. Most of the relative motion occurred after the impact event was over (indicated by the gray box). Front and front boss impacts had considerably more relative motion, on average, than rear and rear boss impacts
Fig. 7
Fig. 7
Relative linear acceleration (top row) and angular velocity (bottom row) corridors at the teeth for padded (left column) and rigid (right column) impacts, averaged across both gap conditions and all severities ≥ 50 g resultant linear acceleration (non-trivial motion). Each padded corridor includes data from 12 impacts. The rigid front corridor includes 5 impacts, rigid rear includes 12 impacts, and rigid rear boss includes 9 impacts. The mouthguard did not collect any front boss impacts at ≥ 50 g target severity
Fig. 8
Fig. 8
Frequency spectra of padded (left column) and rigid (right column) relative motion impact kinematics. Linear acceleration (top row) showed the highest frequency content along the Z-axis in decoupling relative to the no-gap condition. Angular acceleration (bottom row) X- and Y-axes had the highest frequency content in decoupling, compared to the 0 mm gap condition. F front, FB front boss, R rear, RB rear boss
Fig. 9
Fig. 9
Short-time Fourier Transform of the relative linear acceleration signals (mouthguard minus CG transformed to teeth) along each axis from the 100 g padded front boss impact. The post-impact frequency content was progressively more noticeable with increasing gap size, especially along the z-axis for linear acceleration
Fig. 10
Fig. 10
Mouthguard vs headform measurements for padded (left column) and rigid (right column) peak linear acceleration (top row), peak angular velocity (center row), and peak angular acceleration (bottom row), reported for the full measurement window. Solid lines are WLP estimates for slope. Dash-dotted lines are WLP 95% confidence intervals using a bootstrapping method. Gray solid lines represent a one-to-one relationship
Fig. 11
Fig. 11
Mouthguard vs headform measurements for padded (left column) and rigid (right column) peak linear acceleration (top row), peak angular velocity (center row), and peak angular acceleration (bottom row), reported for the impact duration window. Impact durations: − 1 to 5 ms for rigid, − 1 to 12 ms for padded impacts. Solid lines are WLP estimates for slope. Dash-dotted lines are WLP 95% confidence intervals using a bootstrapping method. Gray solid lines represent a one-to-one relationship
Fig. 12
Fig. 12
Short-time Fourier Transform of the relative angular velocity signals (mouthguard minus CG transformed to teeth) along each axis from the 100 g padded front boss impact. The post-impact frequency content in the x- and y-axes was progressively of higher amplitude with increasing gap size
Fig. 13
Fig. 13
Short-time Fourier Transform of the relative angular acceleration signals (mouthguard minus CG transformed to teeth) along each axis from the 100 g padded front boss impact. Like angular velocity, the post-impact frequency content in the x- and y-axes was progressively of higher amplitude with increasing gap size
Fig. 14
Fig. 14
Exemplar time history plots of the kinematics from the 100 g padded front boss impacts. Reference curves were recorded at the CG and transformed to the teeth. Mouthguard curves were recorded at the teeth. We observed increasing oscillatory artifacts with greater gap conditions, but most of these artifacts occurred after the impact (gray boxes)
Fig. 15
Fig. 15
Exemplar time history plots of the kinematics from the 100 g rigid rear impacts. Reference curves were recorded at the CG and transformed to the teeth. Mouthguard curves were recorded at the teeth. We observed increasing oscillatory artifacts with greater gap conditions, but most of these artifacts occurred after the impact (gray boxes)

References

    1. Crisco, J. J., B. J. Wilcox, et al. Magnitude of head impact exposures in individual collegiate football players. J. Appl. Biomech. 28(2):174–183, 2012. 10.1123/jab.28.2.174 - DOI - PMC - PubMed
    1. Mihalik, J. P., K. M. Guskiewicz, et al. Head impact biomechanics in youth hockey: comparisons across playing position, event types, and impact locations. Ann. Biomed. Eng. 40(1):141–149, 2012. 10.1007/s10439-011-0405-3 - DOI - PubMed
    1. Crisco, J. J., B. J. Wilcox, et al. Head impact exposure in collegiate football players. J. Biomech. 44(15):2673–2678, 2011. 10.1016/j.jbiomech.2011.08.003 - DOI - PMC - PubMed
    1. Rowson, S., M. L. Bland, et al. Biomechanical perspectives on concussion in sport. Sports Med. Arthrosc. Rev. 24(3):100–107, 2016. 10.1097/JSA.0000000000000121 - DOI - PMC - PubMed
    1. Campolettano, E. T., R. A. Gellner, and S. Rowson. High-magnitude head impact exposure in youth football. J. Neurosurg. 20(6):604–612, 2017. - PMC - PubMed

LinkOut - more resources