. 2024 Jul 2;15(1):5545.
doi: 10.1038/s41467-024-49347-1.

Epithelial cells maintain memory of prior infection with Streptococcus pneumoniae through di-methylation of histone H3

Affiliations

Epithelial cells maintain memory of prior infection with Streptococcus pneumoniae through di-methylation of histone H3

Christine Chevalier et al. Nat Commun. .

Abstract

Epithelial cells are the first point of contact for bacteria entering the respiratory tract. Streptococcus pneumoniae is an obligate human pathobiont of the nasal mucosa, carried asymptomatically but also the cause of severe pneumoniae. The role of the epithelium in maintaining homeostatic interactions or mounting an inflammatory response to invasive S. pneumoniae is currently poorly understood. However, studies have shown that chromatin modifications, at the histone level, induced by bacterial pathogens interfere with the host transcriptional program and promote infection. Here, we uncover a histone modification induced by S. pneumoniae infection maintained for at least 9 days upon clearance of bacteria with antibiotics. Di-methylation of histone H3 on lysine 4 (H3K4me2) is induced in an active manner by bacterial attachment to host cells. We show that infection establishes a unique epigenetic program affecting the transcriptional response of epithelial cells, rendering them more permissive upon secondary infection. Our results establish H3K4me2 as a unique modification induced by infection, distinct from H3K4me3 or me1, which localizes to enhancer regions genome-wide. Therefore, this study reveals evidence that bacterial infection leaves a memory in epithelial cells after bacterial clearance, in an epigenomic mark, thereby altering cellular responses to subsequent infections and promoting infection.


Conflict of interest statement

The authors declare no competing interests.

Figures

Fig. 1
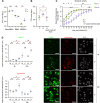
Fig. 1. Differential infection efficiency and host cell transcriptome between primary and secondary infections.
A Experimental scheme, showing A549 or RPMI cells infected with S. pneumoniae, pink for uninfected cells (UI), green for primary infection (1°), blue for cells maintained post first infection (PI), purple for secondary infection (2°). Addition of an antibiotics cocktail (Ab) 1 or 3 hours after infection is indicated below the scheme and correlates with the rapid decrease in colony forming units (CFUs) after infection. Sample collection times are indicated by: α = 1 h or 3 h (for 1° and 2°) and 7d for (PI), β = 24 h (for 1° and 2°) and 8d (for PI), γ = 48 h (for 1° and 2°) and 9d (for PI). B Principal component analysis of gene expression A549 cells of the UI, PI, 1° and 2° infection at time α (3 h). Principal components calculated on count data after removal of replicate batch effect with ComBat. Samples are colored according to the time point, all replicates (Rep) are shown. C Differential expression analysis. Number of genes significantly (adjusted p value < 0.05) up or downregulated in the 1° or 2° infection in comparison, respectively, to UI and PI cells. Column height indicates the number of genes defined as differentially expressed (DEG) in one or more of the above comparisons. Column color specifies whether the subset of genes is differentially expressed only in the 1° (green) or 2° (purple) infection or in both (green/purple gradient). D Functional scoring analysis. Reactome categories, selected among those significantly enriched (False discovery rate, FDR < 0.05) in the 1° and/or 2° infection in comparison to, respectively, UI and PI cells are indicated by star. Heatmaps represent the intensity of the Normalized Enrichment Score (NES) obtained by the Gene Set Enrichment Analysis (GSEA) for each pathway. Pathways are separated depending on whether they are enriched specifically in the 1° or 2° infection, or in both. Categories of genes with differential gene expression between 1° and 2° infection are in bold. Complete list of pathways corresponding to each category in supplementary table S1. Source Data were deposited into the Gene Expression Omnibus (GEO) repository of the National Center for Biotechnology Information under accession number GSE230142.
Fig. 2
Fig. 2. S. pneumoniae actively modifies cells following primary infection.
A Supernatant, wash, and A549 cells were collected at time α (1 h) post 1° and 2° infection with MOI 35 for CFU counts, n = 5 biological replicates, lines are the mean ± SEM and statistical significance was calculated by Mann-Whitney test, ns = not significant, two-tailed **p = 0.0079. B A549 cells were collected at time α (3 h) after 1° and 2° (MOI 20) for CFU counts, n = 5 biological replicates, lines are the mean ± SEM and statistical significance was calculated by two-tailed Mann-Whitney test, ns = not significant, *p = 0,0159 (1°/2°), *p = 0,0238 (2°/2°post inactived Spn). C A549 cell metabolic activity measured by alamarBlue assay. Cells treated at time α (3 h post infection, MOI 20), 1 measure of fluorescence/hour for 12 hours. Results are expressed as resorufin fluorescence intensity. Plot shows mean ± SEM from n = 4 biological replicates. Statistical significance was determined by two-way ANOVA with FDR Benjamini-Hochberg correction for multiple comparisons Q = 0.05 for 1° (green round) versus 2° infection (round purple) ns = not significant, *p = 0.0145, ***p = 0.0004, ****p = 0.0001 and 1° (green round) versus 2°§ infection (§Spn inactived at 1° infection then Spn live at 2°, triangle pink) ns = not significant, *p = 0.0311 and 0.0170, **p = 0.0021. D Quantification of LAMP1 and colocalization with lysotracker® at time α (3 h, round) and time β (24 h, triangle) for UI, 1°, PI and 2° conditions in the A549 cells. Plots show quantifications from 60 to 75 cells by conditions in the same experiment, mean fluorescence intensity of Regions of Interest (ROI) from n = between 6000 and 22,000 lysosomes total (Fig. S2.B) ± SEM, statistical significance was determined by two-tailed Mann–Whitney test, ns = not significant, *p = 0.0357. On the right, representative immunofluorescence images by confocal microscopy of A549 cells stained with LAMP1 (GFP; green), LysoTracker® (Deep Red; red), and DAPI (gray) at time α (3 h) and β (24 h) after 1° and 2° infection. Scale bar = 20 μm. Source data are provided as a Source Data file for AD.
Fig. 3
Fig. 3. Cells maintain an epigenetic mark after primary infection.
A Quantification of twenty-one modified histone H3 patterns by Multiplex ELISA assay in the A549 cells. Radar plots representing the relative change (%) of each histone H3 modification between 1° or PI and UI cells at time α (3 h). Values in Supplementary Fig. S3.A. B Immunoblot detection of H3K4me2 at 1°, PI and UI at time α (3 h). Mean ± SEM of values expressed as normalized band intensity relative to β-actin followed by fold change of infected cells at 1° or PI to UI, n = 13 biological replicates. Statistical significance was determined by one-way ANOVA method with Tukey’s multiple comparisons test (ns = not significant, *p = 0.0209, **p = 0.0011). Representative image of immunoblot in Supplementary Fig. S3.BC Immunoblot detection of H3K4me3 1°, PI and UI at time α (3 h). Data points represent mean ± SEM, n = 4 biological replicates. Histogram shows the values expressed as normalized band intensity relative to β-actin followed by fold change of infected cells at 1° or PI to UI. Statistical significance was determined by one-way ANOVA method with Tukey’s multiple comparisons test (ns = not significant). Representative image of immunoblot in Supplementary Fig. S3.C. D Immunoblot detection of H3S10ph at 1° or PI to UI at time α (3 h). Data points represent mean ± SEM, n = 5 biological replicates. Histogram shows values expressed as normalized band intensity relative to β-actin followed by fold change of infected cells at 1° or PI to UI. Statistical significance was determined by one-way ANOVA method with Tukey’s multiple comparisons test (ns = not significant, ***p = 0.0002, ****p < 0.0001). Representative image of immunoblot in Supplementary Fig. S3.D. E In vivo experimental set-up described in Methods section. Illustration of mouse created with BioRender.com. F Mean intensity levels of H3K4me2 of epithelial cells from mice treated with PBS (UI) or infected (1°) is represented by a symbol for each mouse, n = 3 biological replicates (stars, crosses, triangles) with 3 or 4 mice per condition, mean ± SEM for each biological replicate. Statistical significance was determined by ratio paired t test of mean (p = 0.0517). Source data are provided as a Source Data file for AF.
Fig. 4
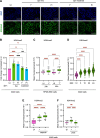
Fig. 4. The increase in H3K4me2 levels is actively induced by live bacteria.
A Representative images of immunofluorescence detection of nuclear H3K4me2 in A549 UI or infected with Spn live and Spn inactived (1° and PI, MOI 20) at time γ. Cells stained for H3K4me2 (GFP; green) and DAPI (blue). Microscopy images were taken at ×20 magnification, and the scale bar represents 100μm. B Quantification of H3K4me2 normalized to the segmented nuclei using DAPI signal. Data points expressed as fold change of mean fluorescence intensity of infected cells 1° and PI to UI (MOI 20) with sp live and sp inactived at time g. Graphs display quantification from n = 3 to 7 biological replicates with the mean values ±SD for each condition. Statistical significance was determined by one-way ANOVA with Fisher’s LSD test (ns = not significant, **p = 0.0012, ***p = 0.0001, ****p < 0.0001). C Quantification of H3K4me2 intensity normalized to the segmented nuclei using DAPI signal at time β and γ 1° (MOI 10) and UI. Box and whiskers plot with line denoting the median value from n = 754 to 1075 nucleus by conditions in the same experiment. Statistical significance was determined by one-way ANOVA comparing means with Tukey’s multiple comparison test (****p < 0.0001). D Quantification of H3K4me2 according to Multiplicities of infection (MOI) normalized to the segmented nuclei using DAPI signal at time γ. Histogram shows the mean fluorescence intensity ±SEM from n = 435 to 480 nuclei by conditions in the same experiment. Statistical significance was determined by one-way ANOVA with Fisher’s LSD test (****p < 0.0001). E, F Quantification of H3K4me2 intensity after infection with E Spn mutant without capsule (−) or F Spn mutant without pilus (−), compared to wildtype Spn (+). H3K4me2 intensity is normalized to the segmented nuclei using DAPI signal at time γ post 1° (MOI 20) and UI. Graphs display quantification n = 300 nuclei/condition/exp. Box and whiskers plot with line denoting the median value. Statistical significance was determined by one-way ANOVA comparing means with Tukey’s multiple comparison test (****p < 0.0001). Source data are provided as a Source Data file for AF.
Fig. 5
Fig. 5. H3K4me2 is a specific persistent mark induced by infection.
A Quantification of H3K4me3 normalized to the segmented nuclei using DAPI signal. Data points are expressed as fold change of mean fluorescence intensity of infected A549 cells (MOI 20) at time β post 1° and PI to UI. Graphs display mean ±SEM from n = 4 to 5 biological replicates. Statistical significance was determined by one-way ANOVA with Fisher’s LSD test (ns = not significant, *p = 0.0208). B Quantification of H3K4me1 normalized to the segmented nuclei using DAPI signal. Data points are expressed as fold change of mean fluorescence intensity of infected A549 cells (MOI 20) at time γ post 1° and PI to UI. Graphs display mean ±SD from n = 3 biological replicates. Statistical significance was determined by one-way ANOVA comparing means with Tukey’s multiple comparison test (ns = not significant, **p = 0.0041). C Experimental set-up with methyltransferase global inhibitor Sinefungin describes in Methods section (β = 24 h, γ = 48 h). DF Quantification of H3K4me2 at time γ (D), H3K4me1 at time γ (E), H3K4me3 at time β F normalized to the segmented nuclei using DAPI signal. Data points are expressed as fold change of mean fluorescence intensity of infected cells (MOI 20) at 1° to UI. Graphs display the mean values ±SEM from n = 3 biological replicates. Statistical significance was determined by one-way ANOVA comparing means with Tukey’s multiple comparison test (ns = not significant, *p = 0.0323). G Experimental set-up with Calyculin A, described in Methods section (α = 3 h, γ = 48 h). H Quantification of H3K4me2 at time γ, intensity normalized to the segmented nuclei using DAPI signal at time γ post 1° (MOI 20) and UI. Box and whiskers plot with a line denoting the median value from n = 3 biological replicates. Statistical significance was determined by one-way ANOVA comparing means with Tukey’s multiple comparison test (****p < 0.0001). Source data are provided as a Source Data file for AH.
Fig. 6
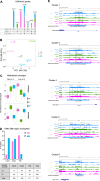
Fig. 6. Methylome dynamics during primary infection.
A Number of reproducible peaks between replicates per time point are compared among the three-time points by simple overlap of at least 50% of the peak length. B Principal component analysis of the H3K4me2 peaks by sample. Principal components are calculated on peak enrichment, i.e., read counts, after removal of the replicate batch effect. C Methylation changes for H3K4me2 and H3K4me3. Count distribution is plotted per time point for the most dynamic regions (DMRs), i.e., those showing the biggest changes in methylation. Read counts per peak are normalized by sequencing depth, peak length, and the replicate batch effect is corrected; they are subsequently centered and scaled by their standard deviation. Peaks are clustered and two global profiles are shown: gain and loss of methylation with respect to UI D H3K4me2 DMRs localization. Percentage and number of UI peaks (loss of methylation) and PI peaks (gain of methylation) according to the localization: Transcription start site (TSS) for peaks overlapping the 2 Kb interval centered around the transcription start site; Intra Genic (IntraG) for peaks located within the gene annotations and outside the TSS interval; Inter Genic (InterG) for all other peaks. E Genome browser snapshots of representative regions (windows of 2 Kbp), gaining H3K4me2 over the time course. Tracks show the normalized coverage, pooled over the two replicates for H3K4me2 ChIP and INPUT samples. Genes predicted to be linked to the peak (see methods) are represented within the window when possible, otherwise their name and distance to the peak are indicated. Clusters are defined with the Multiple Factor Analysis (see Fig. 7). Source Data AE were deposited into the Gene Expression Omnibus (GEO) repository of the National Center for Biotechnology Information under accession number GSE230142.
Fig. 7
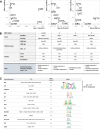
Fig. 7. Identification of the regulatory modes underlying the primary and secondary infections.
A Contribution of groups of variables to the definition of factors/dimensions. Groups of variables constitute the multiple factor analysis (MFA) input matrix and describe the genes (TOME = Transcriptome, DEG = Differentially expressed gene), the H3K4me2 peaks (Methylome = METH, DMR = Differentially methylated region, EPIG = Chromatin profile, CS = Chromatin state) and their association (DIST = distance, CORR = correlation). B Description of the four regulatory modes associated with an increase of H3K4me2. Clusters of gene-peak associations are characterized in terms of the categorical variables used in the MFA (DMR, DEG), the chromatin state of the peaks (EPIG, CS). Representation of enriched functional Reactome categories from GSEA for each MFA cluster: the observed number of genes belonging to a given Gene Set and the expected number per cluster (with ratio >1.5). C Transcription factors (TFs) associated with the regulatory modes. Table lists the TFs with binding motifs enriched in H3K4me2 peaks from the selected MFA clusters. Source Data A–C were deposited into the Gene Expression Omnibus (GEO) repository of the National Center for Biotechnology Information under accession number GSE230142.

References

    1. J. Günther, H.-M. Seyfert, The first line of defence: insights into mechanisms and relevance of phagocytosis in epithelial cells. Semin. Immunopathol. 40, 555–565 (2018). - PMC - PubMed
    1. Whitsett JA, Alenghat T. Respiratory epithelial cells orchestrate pulmonary innate immunity. Nature. 2015;16:27–35. - PMC - PubMed
    1. Bierne H, Pourpre R. Bacterial factors targeting the nucleus: the growing family of nucleomodulins. Toxins (Basel) 2020;12:220. doi: 10.3390/toxins12040220. - DOI - PMC - PubMed
    1. Bierne H, Hamon M, Cossart P. Epigenetics and bacterial infections. Cold Spring Harb. Perspect. Med. 2012;2:a010272. doi: 10.1101/cshperspect.a010272. - DOI - PMC - PubMed
    1. Denzer L, Schroten H, Schwerk C. From gene to protein-how bacterial virulence factors manipulate host gene expression during infection. Int. J. Mol. Sci. 2020;21:3730. doi: 10.3390/ijms21103730. - DOI - PMC - PubMed