. 2024 Jul 2;15(1):5570.
doi: 10.1038/s41467-024-49784-y.

Epigenetic-based differentiation therapy for Acute Myeloid Leukemia

Affiliations

Epigenetic-based differentiation therapy for Acute Myeloid Leukemia

Edurne San José-Enériz et al. Nat Commun. .

Abstract

Despite the development of novel therapies for acute myeloid leukemia, outcomes remain poor for most patients, and therapeutic improvements are an urgent unmet need. Although treatment regimens promoting differentiation have succeeded in the treatment of acute promyelocytic leukemia, their role in other acute myeloid leukemia subtypes needs to be explored. Here we identify and characterize two lysine deacetylase inhibitors, CM-444 and CM-1758, exhibiting the capacity to promote myeloid differentiation in all acute myeloid leukemia subtypes at low non-cytotoxic doses, unlike other commercial histone deacetylase inhibitors. Analyzing the acetylome after CM-444 and CM-1758 treatment reveals modulation of non-histone proteins involved in the enhancer-promoter chromatin regulatory complex, including bromodomain proteins. This acetylation is essential for enhancing the expression of key transcription factors directly involved in the differentiation therapy induced by CM-444/CM-1758 in acute myeloid leukemia. In summary, these compounds may represent effective differentiation-based therapeutic agents across acute myeloid leukemia subtypes with a potential mechanism for the treatment of acute myeloid leukemia.


Conflict of interest statement

The authors declare no competing interests.

Figures
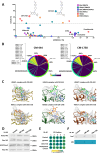
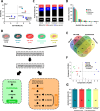
Fig. 1
Fig. 1. Identification and characterization of CM-444 and CM-1758, as a pan-HDACi, with high AML differentiation potencies at low non-cytotoxic doses.
A Epigenetic small-molecule screening was performed in HL-60 cell line treated daily with 25% GI50 of each compound for 48 h. CD11b and annexin-V were measured by flow cytometry. The data shown are the mean of three biologically independent experiments. B Percentage of inhibition of CM-444 and CM-1758 at 10 µM against a panel of 95 epigenetic targets. HDACs, DNMTs, and UTX IC50 values are indicated. C Predicted complex of CM-444 and CM-1758 with HDAC1, HDAC6, and HDAC7. D H3Ac and H3K27me3 levels were detected by western blot after daily treatment of an HL-60 cell line with 270 nM CM-444 or 300 nM CM-1758 for 48 h. H3 total was used as the loading control (representative experiment of 2 biologically independent studies). E DNA methylation of LINE-1 analyzed by pyrosequencing after daily treatment in HL-60 cell line with 270 nM CM-444 or 300 nM CM-1758 for 48 h. The DNA methylation percentage is indicated inside the circles. As a DNA methylated control, a universally methylated DNA was used. The data shown are the mean of two biologically independent experiments. F Dot blot was used to detect global 5-methylcytosine levels after CM-444 and CM-1758 daily treatment for 48 h in an HL-60 cell line (270 nM and 300 nM, respectively). Methylene blue staining was used as a loading control (representative experiment of 2 biologically independent studies). PDE5: phosphodiesterase-5; HDACs: histone deacetylases; DNMTs: DNA methyltransferases; SIRTs: sirtuins; HDMs: histone demethylases; HATs: histone acetyltransferases; HMTs: histone methyltransferases; 5mC: 5-methylcytosine; MB: methylene blue. Uncropped blots and source data are provided as a Source data file.
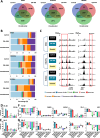
Fig. 2
Fig. 2. Induction of cell differentiation in all subtypes of AML cells by CM-444 and CM-1758.
A Cell differentiation assay measuring CD11b by flow cytometry in a panel of 15 AML cell lines belonging to different subtypes (M1 to M7, according to FAB classification). Cells were treated daily with 25% GI50 of each compound for 48 h. ATRA was used as the differentiation therapy reference. The data shown are the mean of three biologically independent experiments. B CD11b and annexin-V were measured by flow cytometry at 2, 4, 6, and 8 days after treating HL-60 and ML-2 cell lines daily with CM-444 or CM-1758. Data are presented as mean values +/- S.D. of three biologically replicates. C Cell differentiation assay measuring CD11b by flow cytometry in eight primary AML patient samples. Samples were treated daily with 500 nM and 2 µM of each compound for 48 h. D GSEA enrichment analysis showing negative regulation of a MYC related gene set and positive regulation of a GFI1, a GATA2, or a CEBPA-related gene set in ML-2 and HL-60 cells after treatment with CM-444 or CM-1758. HL-60 and ML-2 cell lines were treated with CM-444 or CM-1758 daily for 48 h. Then, E q-polymerase chain reaction (PCR) of MYC, CDKN2A (p16) and CDKN1A (p21); F Cell-cycle analysis; G q-PCR of GATA2, SPI1 (PU.1), TAL1 (SCL) and CEBPA and H May–Grünwald–Giemsa staining performed in HL-60 and ML-2 cell lines after CM-444 and CM-1758 treatment. Scale bar, 10 µm. Data are presented as mean values +/- S.D. of three biologically replicates. Source data are provided as a Source data file.
Fig. 3
Fig. 3. CM-444 and CM-1758 induction of differentiation and anti-leukemic activity in vivo.
A ML-2 cells were pretreated in vitro with 260 nM of CM-444 or 210 nM of CM-1758 for 96 h. After verifying CD11b induction by flow cytometry, equal amounts of cells were injected subcutaneously in Rag2−/− ɣc−/− mice, and tumor volume was measured (n = 8). Error bars indicate the S.D. Statistical significance was calculated by a two-tailed Student’s t-test. B Schematic diagram of the in vivo CM-444 and CM-1758 treatment procedure and tumor volume curve of the ML-2 subcutaneous xenograft model in Rag2−/− ɣc−/− mice (n = 8). Error bars indicate the S.D. Statistical significance was calculated by a two-tailed Student’s t-test. C CD11b from tumors in an ML-2 subcutaneous model was measured by q-PCR (n = 5). Error bars indicate the S.D. Statistical significance was calculated by a two-tailed Student’s t-test. D Schematic diagram of the in vivo CM-444 and CM-1758 treatment procedure and Kaplan–Meier survival curve for evaluating the survival time of Rag2−/− ɣc−/− mice engrafted with MV4-11 cells after intravenous administration (n = 10). P-values assessed by log-rank. E CD11b levels in blood samples from an intravenous MV4-11 mouse model measured by flow cytometry (n = 7 for Control and CM-1758 group and n = 10 for CM-444 group). Error bars indicate the S.D. Statistical significance was calculated by a two-tailed Student’s t-test. Control: treatment with CM-444 or CM-1758 vehicle (80% saline, 10% Tween 20, and 10% DMSO); s.c.: subcutaneous; i.v.: intravenous. Source data are provided as a Source data file.
Fig. 4
Fig. 4. Acetylome analysis revealed different acetylation profiles between CM-444/CM-1758 and the reference HDACi.
A Cell differentiation assay measuring CD11b and Sytox Green by flow cytometry in an ML-2 cell line treated with 25% GI50 of CM-444 (260 nM), CM-1758 (210 nM) and the commercial HDACi Panobinostat (12.9 nM), Vorinostat (1.1 µM), Entinostat (2.3 µM), Quisinostat (18 nM) and Tubastatin (2.5 µM) for 48 h. The data shown are the mean of three biologically independent experiments. B Proteome and acetylome experimental design: ML-2 cells were treated with 25% GI50 of CM-444 (260 nM) or CM-1758 (210 nM) and with reference HDACi Panobinostat (12.9 nM) or Vorinostat (1.1 µM) for 12 h. Then, cells were lysed and digested and the subsequent peptides were labeled and fractionated. 5 % of the fractions were kept for proteome analysis by LC-MS/MS. For the complete acetylome study, 95% of the obtained fractions were combined into five pools, and three consecutive IPs were performed for each pool, and the resulting samples were subsequently analyzed by LC-MS/MS. Figure 4/panel B, created with BioRender.com released under a Creative Commons Attribution-NonCommercial-NoDerivs 4.0 International license. C The total number of Acetyl-K sites quantified and the fraction of Acetyl-K sites regulated by each HDACi are shown. The bar chart shows the percentage of upregulated sites (log2 FC > 1, p < 0.05, shown in red) and downregulated sites (log2 FC < 1, p > 0.05, shown in blue). D Distribution of acetylated sites in the acetylated proteins. E Venn diagram of the total number of regulated Acetyl-K sites in ML-2 cells after treatment with CM-444, CM-1758, Panobinostat or Vorinostat compared with untreated cells. F PCA of acetylome data from ML-2 cells after treatment with CM-444, CM-1758, Panobinostat or Vorinostat compared with untreated cells. G Representation of Acetyl-K sites regulated after HDACi in histone and non-histone proteins. The data are shown as percentages, and the number of Acetyl-K sites regulated by each HDACi is indicated in the corresponding bar. Source data are provided as a Source data file.
Fig. 5
Fig. 5. Differential acetylation of non-histone proteins, a key factor in the molecular mechanism underlying the differentiation induction in AML with CM-444 and CM-1758.
A Acetyl-K sites specifically deregulated by CM-444 and CM-1758. B STRING protein–protein interaction analysis on the 104 Acetyl-K sites differentially regulated specifically by CM-444 and CM-1758. Three different functional clusters were detected. C Representation of the protein complexes highly acetylated by CM-444 and CM-1758 and other HDACi. The specific K-sites regulated in each protein are specified. Figure 5/panel C, created with BioRender.com released under a Creative Commons Attribution-NonCommercial-NoDerivs 4.0 International license.
Fig. 6
Fig. 6. Role of BRDs in the differentiation induction in AML with CM-444 and CM-1758.
A BRD4 (left), H3K27Ac (middle) and H3K9Ac (right) peak numbers in HL-60 cells treated with CM-444 or Panobinostat for 12 h. B) CUT&RUN peaks distribution of BRD4 (upper panel), H3K27Ac (middle panel) and H3K9Ac (lower panel) in HL-60 cells treated with CM-444 or Panobinostat for 12 h. C Examples of myeloid genes involved in differentiation of AML cells. Cell differentiation assay measuring CD11b by flow cytometry after treating D HL-60 and E ML-2 cells daily with 25% GI50 of CM-444, CM-1758, Molibresib, JQ1, and the combination of CM-444 or CM-1758 with Molibresib or JQ1 for 48 h. Data are presented as mean values +/- S.D. of three biological replicates. Statistical significance was calculated by a two-tailed Student’s t-test. n.s. = non-significant; *p ≤ 0.05. q-PCR of GATA2, PU.1, SCL and CEBPA after treating F HL-60 and G ML-2 cells daily with 25% GI50 of CM-444, CM-1758, Molibresib, JQ1, and the combination of CM-444 or CM-1758 with Molibresib or JQ1 for 48 h. Data are presented as mean values +/- S.D. of three biological replicates. Statistical significance was calculated by a two-tailed Student’s t-test. n.s. = non-significant; *p ≤ 0.05. Source data are provided as a Source data file.

References

    1. Döhner H, Weisdorf DJ, Bloomfield CD. Acute myeloid leukemia. N. Engl. J. Med. 2015;373:1136–1152. doi: 10.1056/NEJMra1406184. - DOI - PubMed
    1. Ossenkoppele G, Löwenberg B. How I treat the older patient with acute myeloid leukemia. Blood. 2015;125:767–774. doi: 10.1182/blood-2014-08-551499. - DOI - PubMed
    1. Döhner H, et al. Diagnosis and management of AML in adults: 2017 ELN recommendations from an international expert panel. Blood. 2017;129:424–447. doi: 10.1182/blood-2016-08-733196. - DOI - PMC - PubMed
    1. Perl AE. The role of targeted therapy in the management of patients with AML. Blood Adv. 2017;1:2281–2294. doi: 10.1182/bloodadvances.2017009829. - DOI - PMC - PubMed
    1. Cicconi L, Lo-Coco F. Current management of newly diagnosed acute promyelocytic leukemia. Ann. Oncol. 2016;27:1474–1481. doi: 10.1093/annonc/mdw171. - DOI - PubMed

MeSH terms

Substances