. 2024 Jul 2;15(1):5551.
doi: 10.1038/s41467-024-49442-3.

A chemogenetic approach for dopamine imaging with tunable sensitivity

Affiliations

A chemogenetic approach for dopamine imaging with tunable sensitivity

Marie A Labouesse et al. Nat Commun. .

Abstract

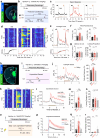
Genetically-encoded dopamine (DA) sensors enable high-resolution imaging of DA release, but their ability to detect a wide range of extracellular DA levels, especially tonic versus phasic DA release, is limited by their intrinsic affinity. Here we show that a human-selective dopamine receptor positive allosteric modulator (PAM) can be used to boost sensor affinity on-demand. The PAM enhances DA detection sensitivity across experimental preparations (in vitro, ex vivo and in vivo) via one-photon or two-photon imaging. In vivo photometry-based detection of optogenetically-evoked DA release revealed that DETQ administration produces a stable 31 minutes window of potentiation without effects on animal behavior. The use of the PAM revealed region-specific and metabolic state-dependent differences in tonic DA levels and enhanced single-trial detection of behavior-evoked phasic DA release in cortex and striatum. Our chemogenetic strategy can potently and flexibly tune DA imaging sensitivity and reveal multi-modal (tonic/phasic) DA signaling across preparations and imaging approaches.


Conflict of interest statement

T.P. is a co-inventor on a patent application (PCT/US17/62993) related to the genetically encoded sensor technology described in this article. Xin Zhou, J.K. and K.A.S. are employees of Eli Lilly and company. All other authors have no competing interests.

Figures
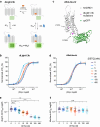
Fig. 1
Fig. 1. Characterization of the approach and engineering of AlloLite-ctr.
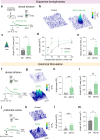
a Schematic illustration of the potentiation strategy. DETQ is the D1-PAM used in this approach, which is selective for human DRD1. Kb, affinity constant of the allosteric ligand. EC50, apparent affinity of the orthosteric ligand. EC50*, apparent affinity of the orthosteric ligand in the DETQ-bound state. b, Dose-response curves obtained from DA titrations on dLight1.3b-expressing cells in the presence of increasing concentrations of DETQ. Data are shown as normalized fluorescence fold-change over baseline (ΔF/F0 %). Datapoints were fitted using a log(agonist) vs. response nonlinear fit (four parameters) to determine EC50 values and using an allosteric EC50 shift for determining the alpha factor and the Kb. n = 20, 33, 26, 20, 20, 9, 16, 16 cells for 0, 1, 5, 10, 20, 50, 150, 450 nM DETQ, respectively. c, Structural model of AlloLite-ctr, generated using Alphafold2. Residues mutated from dLight1.3b are highlighted in magenta. d Same as in b for AlloLite-ctr. n = 16, 20, 10, 21, 21, 20, 19, 19 cells for 0, 1, 5, 10, 20, 50, 150, 450 nM DETQ, respectively. e, Plot showing dLight1.3b EC50 values measured from b. n.s., not significant. p = 0.641; **p = 0.0044; ****p = 2.31 × 10⁻⁶; ****p = 2.31 × 10⁻⁶; ***p = 3.01 × 10⁻⁴; ****p = 1.54 × 10⁻⁸;****p = 7.8 × 10⁻⁸ for 0 vs. 1, 5, 10, 20, 50, 150, 450 nM DETQ, respectively. f, Same as e for AlloLite-ctr (d). p = 0.971; p = 0957; p = 0985; p = 0.985; p = 0.3742; p = 0.0711; p = 0.2096 for 0 vs. 1, 5, 10, 20, 50, 150, 450 nM DETQ, respectively. Both e and f were analysed using parametric one-way ANOVA with Holm-Šídák’s multiple comparisons test. All data are shown as mean ± SEM. All experiments were repeated at least 3 independent times with similar results. See also Supplementary Figs. 1 and 2. Source data are provided as a Source Data file.
Fig. 2
Fig. 2. High-resolution imaging of DA release in vitro with tunable sensitivity.
a Representative image of dLight1.3b-expressing HEK293T cells (“sniffer cells”, green) cultured onto mouse primary DArgic tdTomato-expressing neurons (magenta). White boxes indicate regions-of-interest (ROIs) selected for analysis. Scale bar, 20 µm. b, 3D heatmaps representing dLight1.3b fluorescence reponse (∆F/F0) at the different timepoints indicated. Top, sensor responses to a phasic DA release event observed within ROI 10. Bottom, gradual responses showing an increase in tonic DA levels detected in ROI 5. Color map represents ∆F/F0. c, Left, representative traces of dLight responses (∆F/F0) from selected ROIs shown with corresponding numbers in a reporting tonic and phasic DA fluctuations (left panel). Right, a subset of ROIs from which tonic-only DA fluctuations can be seen. d, Comparison of tonic ∆F/F0 signal detection upon application of DETQ. Wilcoxon two-tailed matched pairs test, n = 10 experiments, P = 0.0020. e, Comparison of detected release events between baseline, application of 4-AP, and 4-AP + DETQ. Each data point represents the sum of events detected per experiment per condition. Data in d and e is shown as mean ± SEM. Multiple comparisons with Bonferroni correction (a = 0.01667 after correction), n = 10 independent experiments. p = 0.2998, 0.007289, 0.001697, for 4-AP vs. saline, 4-AP + DETQ vs. saline, and 4-AP + DETQ vs. 4-AP, respectively. See also Video S1. Source data are provided as a Source Data file.
Fig. 3
Fig. 3. Ex vivo two-photon characterization of the approach.
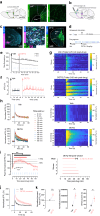
a Experimental schematic and example time-courses of dLight1.3b responses evoked by DA iontophoresis and potentiating effect of DETQ. b, Example frames showing the effect of DETQ on peak dLight ∆F/F0 evoked by DA iontophoresis (ejection current: 20 nA). c, Spatial analysis of ∆F/F0 area exceeding the threshold of >2 standard deviations (2σ) of baseline noise (ejection current: 20 nA). Control: n = 5 slices from 3 animals, DETQ: n = 7 slices from 3 animals, *p = 0.0436, t(10) = 2.31, independent samples t-test (two-sided). d Peak dLight ∆F/F0 evoked by DA iontophoresis with increasing ejection current amplitude. Control: n = 5 slices from 3 animals, DETQ: n = 8 slices from 3 animals, **p = 0.0015, t(7.32) = 4.92, *p = 0.0135, t(10.89) = 2.94, Two-way ANOVA followed by Fisher’s LSD test. e, Decay time (peak to 50%) of dLight signals following DA iontophoresis (ejection current: 50 nA). Control: n = 5 slices from 3 animals, DETQ: n = 7 slices from 3 animals, *p = 0.0131, t(11) = 2.96, independent samples t-test (two-sided). f, Example responses produced by single electrical stimulation (1 × 10 µA, 0.5 ms) of DA release in dorsal striatum slices. g, Example images of peak responses in the striatum. h, Peak dLight ∆F/F0 evoked by electrical stimulation in striatum. Control: n = 7 slices from 3 animals, DETQ: n = 9 slices from 3 animals, **p = 0.0026, t(14) = 3.66, independent samples t-test (two-sided). i, Area of dLight ∆F/F0 greater than 2σ baseline threshold, evoked by DA release in dorsal striatum. Control: n = 5 slices from 3 animals, DETQ: n = 7 slices from 3 animals, **p = 0.0033, t(10) = 3.83, independent samples t-test (two-sided). j, Example dLight ∆F/F0 traces produced by trains of electrical stimuli (5 × 20 µA, 0.5 ms at 25 Hz) in PFC. k, Example images at peak of DA release revealed by DETQ in cortical slices. l, Peak dLight ∆F/F0 evoked by electrical stimulation in PFC. Control: n = 7 slices from 3 animals, DETQ: n = 10 slices from 3 animals, ***p = 0.0007, U = 3, Mann-Whitney U-test (two-sided). m, Area of dLight ∆F/F0 greater than 2σ baseline threshold, evoked by DA release in PFC. Control: n = 6 slices from 3 animals, DETQ: n = 5 slices from 3 animals, *p = 0.0267, t(9) = 2.65, independent samples t-test (two-sided). All data shown as mean ± SEM. Source data are provided as a Source Data file.
Fig. 4
Fig. 4. In vivo optogenetic characterization of the approach.
a VTA projections to PFC. b Virus strategy for in vivo experiments. Graphics in a–b were created with BioRender.com. c Representative immunohistochemistry showing VTA ChrimsonR expression and colocalization with tyrosine hydroxylase (TH) and PFC dLight1.3b expression. d Experimental timeline of opto-stimulation (2 s, 20 Hz, 20-ms pulses; blue lines) and drug regimen. e Representative trace showing raw 465/405 nm-excited fluorescence data after Vehicle/DETQ injection; blue lines: opto-trials. f Average traces showing opto-evoked trials (blue lines) over time after Veh/DETQ. g Heatmaps aligned to opto-onset showing individual trials (ΔF/F0 normalized to the average Veh trial) at different timepoints post-drug for each mouse in Veh (top) and DETQ (bottom) conditions. h Left: average traces (all mice) for opto-evoked trials shown in g. Right: Same data as heatmaps. i. Left: Average peak normalized ΔF/F0 calculated from Veh and DETQ trials shown in h. plotted against time post-drug. Thick black dotted line: value at the plateau of DETQ maximal responses; thin black dotted lines: +/− 15% of the plateau. Thick black continuous line: ‘temporal window of superior sensitivity’, i.e. 5 to 45 min post-DETQ where peak normalized ΔF/F after opto-stim is significantly higher than at 0 min post-DETQ (all **p < 0.01: 1-way ANOVA: F (17, 68) = 11.56; post-hoc vs. 0 min: 5–35 min p < 0.0001, 40 min: p = 0.0056, 45 min: p = 0.0032). Thick red continuous line: ‘temporal window for stable imaging’, i.e. 5 to 36 min post-DETQ where DETQ trials have peak ΔF/F0 responses within +/− 15% of the plateau (maximal) response. Right: Individual values of ‘temporal window for stable imaging’ across mice. Average window: 5 to 36 min post-DETQ (31 min). j Average opto-evoked traces in Veh vs. DETQ (trials within ‘temporal window for stable imaging’). k, Quantification shows significant increase in peak ΔF/F0, AUC and off-decay time in DETQ (temporal window) condition vs. Veh (*p < 0.05, **p < 0.01). AUC, n = 5 mice/group. Two-sided paired t-test, p = 0.0143. Peak maxima, n = 5 mice/group. Paired t-test, p = 0.0078. Off-decay, n = 5 mice/group. Paired t-test, p = 0.0450. Data shown as mean/SEM. Source data is provided.
Fig. 5
Fig. 5. No effect of DETQ on tonic/phasic DA release properties monitored with AlloLite-ctr in vivo.
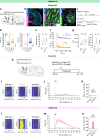
a–g Validation of phasic DA detection using AlloLite-ctr. a, Viral injection strategy. b, Representative immunohistochemistry showing VTA ChrimsonR expression and colocalization with tyrosine hydroxylase (TH) and NAc AlloLite-ctr expression. c, Experimental timeline of injections: vehicle (Day 1) or DETQ (10 mg/kg) (Day 8); cocaine (20 mg/kg) 20 min later. Opto-activation of DA axons started 10 min after each injection (3 trials; 2 s, 20 Hz, 20-ms pulses) every 5 min. d Average traces showing opto-evoked trials (blue lines) over time after Veh/Cocaine (left) and DETQ/Cocaine (right). e Quantification shows significant increase in baseline ΔF/F0 with cocaine vs. Veh and cocaine/DETQ vs. DETQ (*p < 0.05). n = 5 mice/group, one-way ANOVA, main effect of drug (cocaine): p = 0.0214; main effect of drug (DETQ): p = 0.4011; drug (cocaine) x drug (DETQ) interaction: p = 0.8209. f Average opto-evoked traces aligned to opto-onset in all 4 conditions. g Quantification of opto-evoked trials shows significant increase in AUC and off-decay time with cocaine vs. Veh and cocaine/DETQ vs. DETQ (*p < 0.05; **p < 0.01). AUC: n = 5 mice/group, one-way ANOVA, main effect of drug (cocaine): p = 0.0050; main effect of drug (DETQ): p = 0.7645; drug (cocaine) x drug (DETQ) interaction: p = 0.7208. Off-decay: n = 5 mice/group, one-way ANOVA, main effect of drug (cocaine): p = 0.0261; main effect of drug (DETQ): p = 0.6262; drug (cocaine) x drug (DETQ) interaction: p = 0.7847. h Left, experimental strategy for measuring tonic DA using DETQ. i Baseline fluorescence for all AlloLite-ctr mice after Veh/DETQ injections, respectively. j Average AlloLite-ctr traces grouped by injection type (n = 4 mice). k Quantification of baseline ∆F/F0 AUC change for AlloLite-ctr from i. p = 0.49, Veh-day 1 vs. DETQ; p = 0.81, DETQ vs Veh-day 2; p = 0.23, Veh-day 1 vs Veh-day 2 (n = 4 mice). ln, same as ik for dLight1.3b. **p = 1.7 × 10⁻³, Veh-day 1 vs. DETQ; **p = 1.5 × 10⁻³, DETQ vs Veh-day 2; p = 0.99, Veh-day 1 vs Veh-day 2 (n = 5 mice). One-way ANOVA and Tukey post-hoc tests. See also Figs. S7, S10. Data shown as mean/SEM. Graphics in a, h were created with BioRender.com. Source data is provided.
Fig. 6
Fig. 6. dLight1.3b responses to DETQ in NAc partially depend on the activity of VTA DA neurons.
a Virus strategy for chemogenetic inhibition. b. Injections: vehicle (epoch 1); then Veh or DETQ (epoch 2); then Veh or the DREADD agonist J60 (low-dose: 0.2 mg/kg) or J60 (high-dose: 1 mg/kg) (epoch 3). c. Average dLight traces with Veh or DETQ as the second drug. DETQ rapidly increases baseline fluorescence. Chemogenetic inhibition of VTA DA neurons decreased dLight signal in the presence of DETQ, confirming its DArgic nature d. Quantification of drug-modified dLight signals. Veh: J60-high significantly decreases average dLight ΔF/F0 (*p < 0.05). n = 6 mice, 2-way RM-ANOVA, drug x epoch: F(2.154, 10.77) = 5.586, p = 0.0202; Sidak post-hoc on epoch 3: Veh vs. J60-low: t(5) = 1.786, p = 0.2504; Veh vs. J60-high: t(5) = 3.876, p = 0.0233. DETQ: J60-high significantly decreases average dLight signal (**p < 0.01). n = 6 mice, 2-way RM-ANOVA, drug x epoch: F(1.661, 8.307) = 16.82, p = 0.0016; Sidak post-hoc on epoch 3: Veh vs. J60-low: t(5) = 1.868, p = 0.2269; Veh vs. J60-high: t(5) = 5.192, p = 0.0070. e Virus strategy for opto-inhibition of DA NAc axons. f Injections: Veh, then DETQ. Opto-inhibition triggered every 3 min (8 trials/drug). g. Average dLight traces after Veh or DETQ. DETQ rapidly increases dLight signal amplitude. h Average traces showing dLight fluorescence in the −30, + 30 s before/after opto-inhibition. VTA DA opto-inhibition decreases dLight fluorescence, confirming its DArgic nature. Effect only detected in the presence of DETQ, indicating enhanced detection sensitivity for tonic changes in DA levels. i. Quantification of opto-modified dLight signals. Veh (left): opto-inhibition (‘stim’) did not significantly modulate average dLight ΔF/F0. DETQ (right): the same manipulation significantly decreased average dLight ΔF/F0 (**p < 0.01, ***p < 0.001). n = 5 mice, 2-way RM-ANOVA, drug x epoch: F(2, 8) = 10.93, p = 0.0052; Sidak post-hoc: Veh - ‘stim’ vs. ‘pre’: t(8) = 0.8363, p = 0.9647; ‘stim’ vs. ‘post: t(8) = 1.356, p = 0.7609. DETQ-‘stim’ vs. ‘pre’: t(8) = 6.483, p = 0.0011; ‘stim’ vs. ‘post: t(8) = 7.158, p = 0.0006. Data shown as mean/SEM. Graphics in a,e were created with BioRender.com. Source data is provided.
Fig. 7
Fig. 7. Using DETQ to monitor tonic DA levels across brain areas.
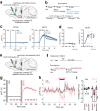
a Schematic of multi-fiber fluorescence recording setup (left) with the implanted 12-fiber array (right). Schematics of coronal brain sections (black) with optical fibers (orange) targeting PFC, NAc and CPu. b Example ΔF/F0 fluorescence traces of dLight1.3b recorded in CPu after DETQ i.p. injection (top, full view). Zoom at the higher temporal resolution on the periods before, during and after the injection. c ΔF/F0 fluorescence of dLight1.3b enhanced by DETQ, pooled across all mice and independent recording sites (mean DETQ red, mean vehicle black; shaded error bar ± SEM; n = 4 mice). d, Bar plots showing average ΔF/F0 change of amplitude (DETQ red, vehicle black; mean ± SEM; n = 4 mice, 16, 12, 7 independent channels for NAc, CPu and PFC respectively; ***p = 4.6347 × 10−06 for NAc, ***p = 1.0976 × 10−04 for CPu **p = 1.0976 × 10−04 for PFC, Wilcoxon Rank Sum test, Bonferroni corrected). e DETQ decay times (DETQ red, vehicle black; mean ± SEM; n = 4 mice, 16, 12, 7 independent channels for NAc, CPu and PFC respectively; ***p = 1.4388 × 10−05 for NAc, ***p = 1.0976 × 10−04 for CPu, *p = 0.0260 for PFC, Wilcoxon Rank Sum test, Bonferroni corrected). f ΔF/F0 signal decomposed with the Wavelet transform to multiple temporal scales (3.3 to 20 seconds) (DETQ red, vehicle black; mean ± SEM). Bar (top) shows p < 0,05 two-sided Wilcoxon signed-rank test for the before/after injection comparison of temporal scales. Source data are provided as a Source Data file.
Fig. 8
Fig. 8. DETQ enhances photometry-based DA detection during naturalistic behaviors.
a NAc dLight recordings. b Experimental timeline and Pavlovian protocol. c Example dLight1.3b traces and licking responses (expert sessions) after Veh or DETQ. Dashed lines: 12-s tone or reward delivery. d Top, representative heatmap showing trial-to-trial variability of CS-evoked dLight1.3b response after Veh/DETQ. Bottom, average licking profile. e Average dLight1.3b response and average licking profile (n = 6 mice). f Quantification of peak CS- and US-evoked ∆F/F0 (CS: ****p = 3.2 × 10⁻⁵ for Veh day 1 vs. DETQ, ****p = 1.0 × 10⁻⁵, for DETQ vs Veh day 2, p = 0.52 for Veh day 1 vs. day 2; US: US: *p = 0.044 for Veh day 1 vs. DETQ, *p = 0.012, for DETQ vs. Veh day 2, p = 0.72 for Veh day 1 vs. 2 (n = 6 mice). g Left, no difference in latency of anticipatory licking upon CS-detection between Veh/DETQ (Latency to lick: p = 0.69 for Veh day 1 vs. DETQ, p = 0.96 for DETQ vs. Veh day 2, p = 0.83 for Veh day1 vs. 2, n = 6 mice). Right, 6-times higher licking during CS vs. no CS; no difference between Veh/DETQ (Lick proportion: p = 0.93 for Veh day 1 vs. DETQ, p > 0.83 for DETQ vs. Veh day 2, p = 0.97 for Veh day1 vs. 2 n = 6 mice). h PFC dLight recordings. i Experimental timeline and unpredicted reward protocol. j, Left: Example dLight1.3b traces and average licking responses from all trials (brown-shaded area). Right: response to reward detected in 70.62 ± 3.93% of single trials after Veh day 1, 90.91 ± 1.40% for DETQ and 66.15 ± 4.03% for Veh day 2 (**p = 4,2 × 10⁻³ for Veh day 1 vs. DETQ, ***p = 9.00 × 10⁻⁴, for DETQ vs. Veh day 2, p = 0.65 for Veh day 1 vs. 2). k Representative heatmap showing trial-to-trial variability of US-evoked dLight1.3b response after Veh/DETQ. l Average dLight1.3b response and average licking profile (n = 7 mice). m, Quantification of peak Unpredicted Reward-evoked ∆F/F0 (***p = 5.25 × 10⁻⁴ for Veh day 1 vs. DETQ, ****p = 7.4 × 10⁻⁵, for DETQ vs. Veh day 2, p = 0.43 for Veh day 1 vs. 2) (n = 7 mice). n, No difference in lick duration associated with reward collection (top: p = 0.79 for Veh day 1 vs. DETQ, p = 0.91 for DETQ vs. Veh day 2, p = 0.96 for Veh day 1 vs. 2). o, Unpredicted shock protocol. p Average dLight1.3b response (n = 8 mice). Blue-shaded area: unpredicted shock. q Quantification of peak Unpredicted Shock-evoked ∆F/F0 (****p = 3.5 × 10⁻⁹ for Veh day 1 vs. DETQ, ****p = 4.9 × 10⁻⁹, for DETQ vs. Veh day 2, p = 0.94 for Veh day 1 vs. 2) (n = 8 mice). r No difference in total freezing episodes associated with footshock (p = 0.99 for Veh day 1 vs. DETQ, p = 0.99 for DETQ vs. Veh day 2, n = 8 mice). One-way ANOVA and Tukey or Sidak, or Friedman’s test by Dunn’s tests used. Data shown as mean/SEM. Graphics in b, i, o were created with BioRender.com. Source data is provided.

References

    1. Berke JD. What does dopamine mean? Nat. Neurosci. 2018;21:787–793. doi: 10.1038/s41593-018-0152-y. - DOI - PMC - PubMed
    1. Björklund A, Dunnett SB. Dopamine neuron systems in the brain: an update. Trends Neurosci. 2007;30:194–202. doi: 10.1016/j.tins.2007.03.006. - DOI - PubMed
    1. Zhuang Y, et al. Structural insights into the human D1 and D2 dopamine receptor signaling complexes. Cell. 2021;184:931–942.e18. doi: 10.1016/j.cell.2021.01.027. - DOI - PMC - PubMed
    1. Jaquins-Gerstl A, Michael AC. A review of the effects of FSCV and microdialysis measurements on dopamine release in the surrounding tissue. Analyst. 2015;140:3696–3708. doi: 10.1039/C4AN02065K. - DOI - PMC - PubMed
    1. Sabatini BL, Tian L. Imaging Neurotransmitter and Neuromodulator Dynamics In Vivo with Genetically Encoded Indicators. Neuron. 2020;108:17–32. doi: 10.1016/j.neuron.2020.09.036. - DOI - PubMed

LinkOut - more resources