. 2024 Jul 3;15(1):5578.
doi: 10.1038/s41467-024-49991-7.

A rapid aureochrome opto-switch enables diatom acclimation to dynamic light

Affiliations

A rapid aureochrome opto-switch enables diatom acclimation to dynamic light

Huan Zhang et al. Nat Commun. .

Abstract

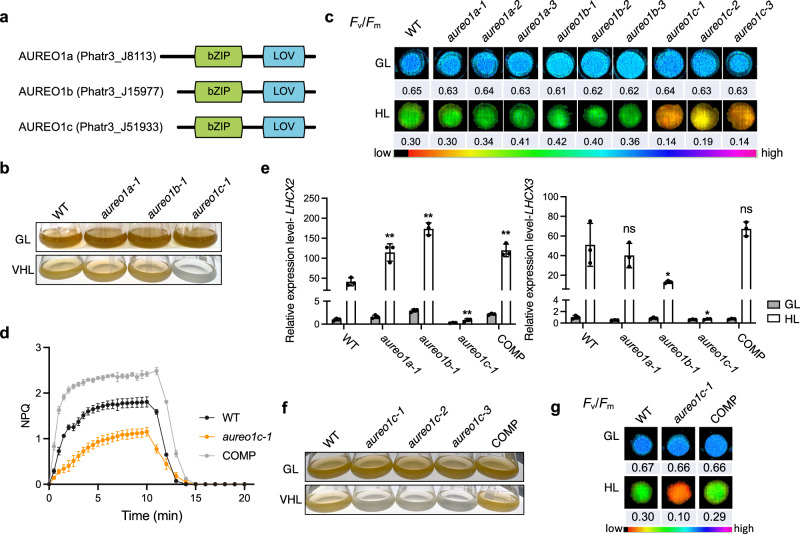
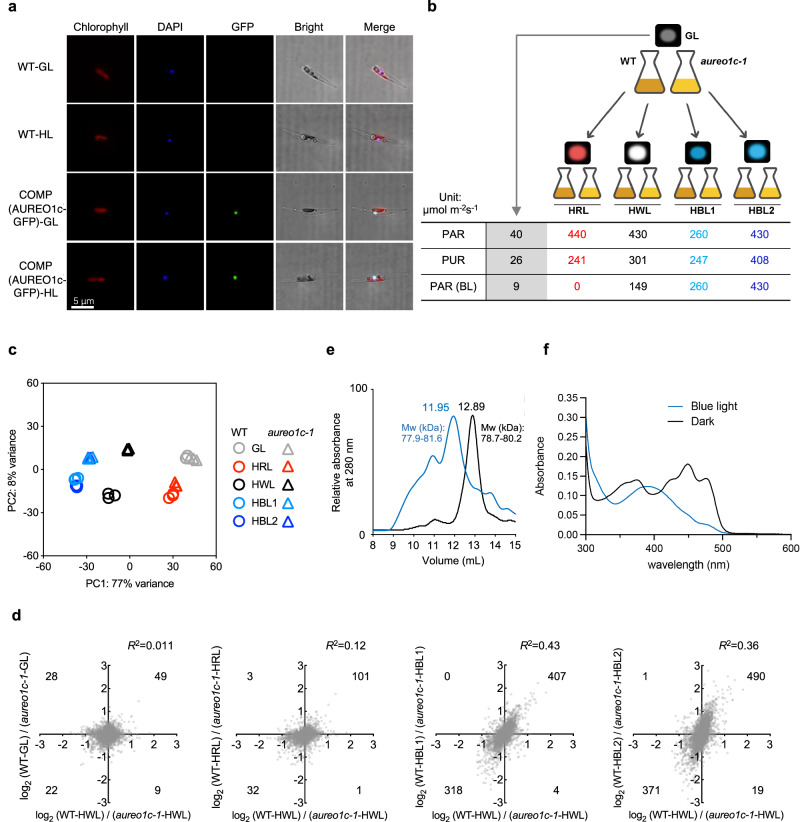
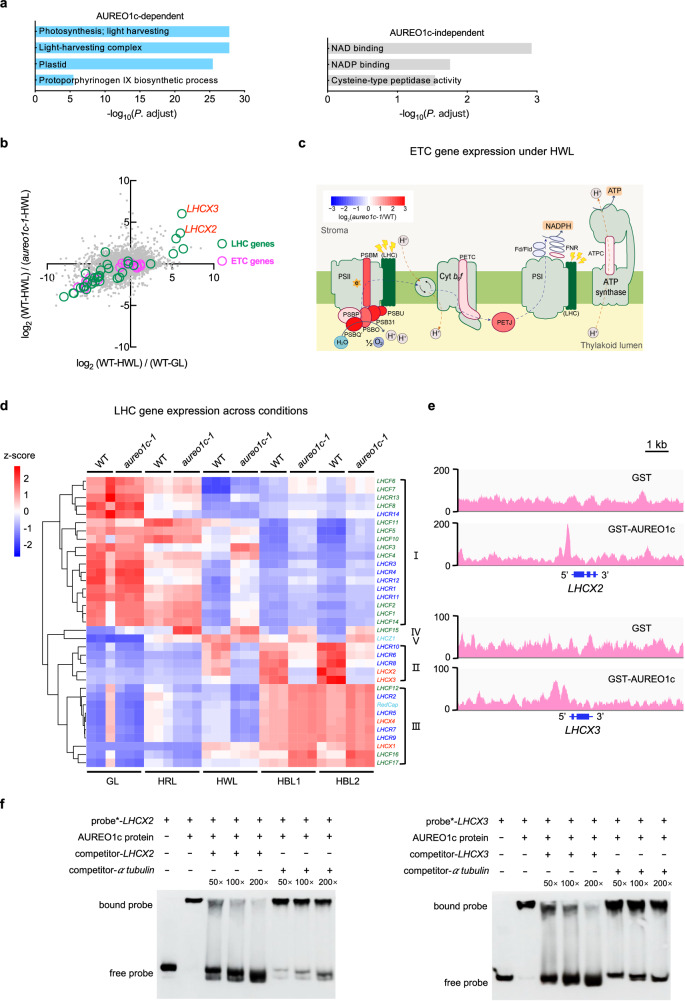
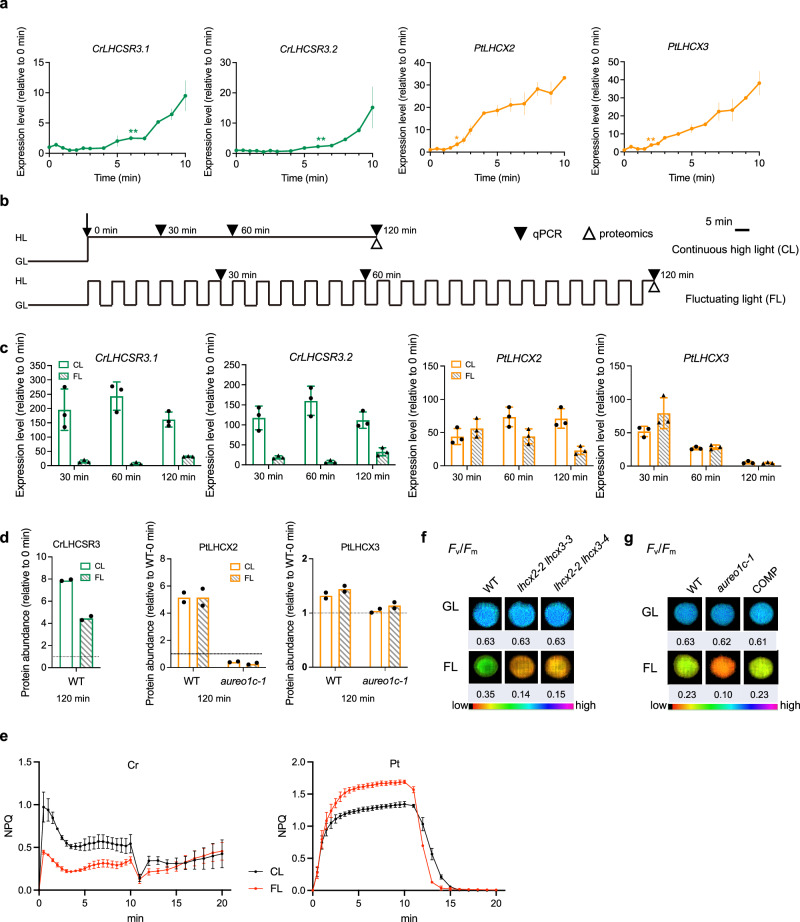
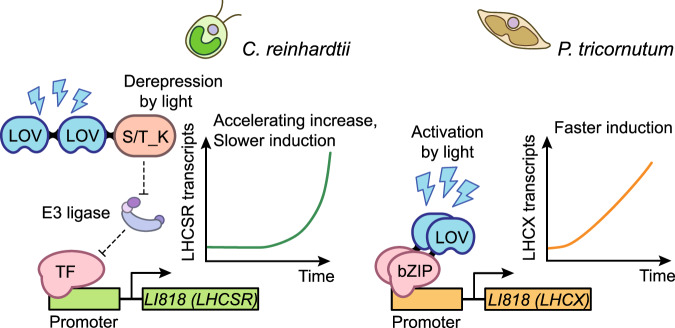
Diatoms often outnumber other eukaryotic algae in the oceans, especially in coastal environments characterized by frequent fluctuations in light intensity. The identities and operational mechanisms of regulatory factors governing diatom acclimation to high light stress remain largely elusive. Here, we identified the AUREO1c protein from the coastal diatom Phaeodactylum tricornutum as a crucial regulator of non-photochemical quenching (NPQ), a photoprotective mechanism that dissipates excess energy as heat. AUREO1c detects light stress using a light-oxygen-voltage (LOV) domain and directly activates the expression of target genes, including LI818 genes that encode NPQ effector proteins, via its bZIP DNA-binding domain. In comparison to a kinase-mediated pathway reported in the freshwater green alga Chlamydomonas reinhardtii, the AUREO1c pathway exhibits a faster response and enables accumulation of LI818 transcript and protein levels to comparable degrees between continuous high-light and fluctuating-light treatments. We propose that the AUREO1c-LI818 pathway contributes to the resilience of diatoms under dynamic light conditions.


Conflict of interest statement

X.L., H.Z., K.G., X.X., and T.C. have submitted a Chinese patent application for this work presented in the manuscript. The application number is 202410675502.8. The other authors declare that they have no competing interests.

Figures

Fig. 1
Fig. 1. AUREO1c is required for LHCX2/3 gene expression, NPQ development, and maintenance of photosynthetic performance under high light.
a Diagrams of the three aureochromes in P. tricornutum. b Photographs of cultures of wild-type (WT) and aureochrome mutants grown under our standard light conditions (GL, 40 µmol photons m−2 s−1 of white light) and treated for 2 days under very high light (VHL; 1200 µmol photons m−2 s−1 of white light). c Maximal quantum yields of photosystem II (PSII) for WT cells and aureochrome mutants, after growth under GL and 3 days of treatment under high light (HL; 550 µmol photons m−2 s−1 of white light), measured as the ratio of variable chlorophyll fluorescence (Fv) to the maximum fluorescence (Fm) after dark acclimation (see “Methods”). The Fv/Fm ratios are shown as false-color images, with values indicated below each image. d NPQ phenotypes of WT, the aureo1c-1 mutant, and the COMP strain treated for 6 h under 900 µmol photons m−2 s−1 of white light. Data are presented as mean values ± standard deviations (SD). e Relative transcript abundance of LHCX2 and LHCX3 in WT, aureochrome mutants, and the aureo1c-1 complemented line (COMP; expressing the wild-type AUREO1c gene in aureo1c-1 mutant cells) normalized to the average of the WT-GL samples. The measurements were performed by RT-qPCR. Data are presented as mean values ± SD. The GL and HL growth conditions were the same as those in (c). HL treatment continued for 1 h before cells were collected for analysis. The expression level of LHCX2/3 in aureochrome mutants and COMP line under high light conditions was compared with that of WT cells using a two-sided t-test. *p < 0.05; **p < 0.01; ns, not significant. For LHCX2, the p values for the comparisons were 0.0061 for aureo1a-1 vs. WT, 0.0002 for aureo1b-1 vs. WT, 0.002 for aureo1c-1 vs. WT, and 0.002 for COMP vs. WT, respectively; for LHCX3, the p values were 0.493 for aureo1a-1 vs. WT, 0.040 for aureo1b-1 vs. WT, 0.016 for aureo1c-1 vs. WT, and 0.291 for COMP vs. WT, respectively. f Phenotypic rescue of aureo1c-1 by complementation with the wild-type AUREO1c gene (the COMP strain), observed as appearance under VHL (same condition with VHL in (b)). In addition, photographs of the cultures of the two other mutant lines of AUREO1c are shown. g Phenotypic rescue of aureo1c-1 by genetic complementation based on the Fv/Fm ratio. The GL and HL conditions were the same as those in (c). Uncropped images with additional replicates (independent cultures or independent mutant lines) for (c, g) are provided in Supplementary Fig. 6a, b. For (bg), three independent cultures were used for the measurements. The experiment was repeated three times independently with consistent results and a representative result is shown. Source data are provided as a Source Data file.
Fig. 2
Fig. 2. AUREO1c is a nucleus-localized sensor for strong blue light.
a Localization of AUREO1c-GFP protein under growth light (GL) and high light (HL). Wild-type (WT) cells lacking the transgene did not show detectable signal in the GFP channel, suggesting the signal for the COMP line is from the AUREO1c-GFP fusion protein. b Schematic showing conditions and treatments for transcriptome analysis. Three independent cultures were sampled each for WT and the aureo1c-1 mutant. HWL, HRL, HBL stand for high white light, high red light, and high blue light respectively. The photosynthetic active radiation (PAR), photosynthetic usable radiation (PUR), and the blue light fraction of the PAR [PAR (BL)] for each condition were calculated and shown in the table. See “Methods”, Supplementary Fig. 2 and Supplementary Data 2 for further details. c Principal component (PC) analysis of the transcriptomes of WT and the aureo1c-1 mutant under various light conditions. Note that PC1 explains the bulk (77%) of the variation. d Correlation between the effects of the aureo1c-1 mutation on transcriptomes under different conditions. The y-axes show the log2 values of the ratios between normalized expression levels in WT and mutant cells, under one of these four light regimes: GL, HRL, HBL1, and HBL2. The corresponding values under HWL condition are plotted along the x-axes. Each dot represents one gene. The squared Pearson’s correlation coefficients (R2) are indicated. All correlations had a two-sided p value < 0.0001. In each quadrant, the number of genes showing significant (FDR < 0.01; see “Methods”) differences between WT and the mutant under both conditions is shown in the corner. e Size-exclusion chromatography of the recombinant proteins of AUREO1c, after dark incubation or blue light irradiation, followed by crosslinking. The molecular weight (Mw) labels are based on data in Supplementary Fig. 15. f Absorption spectra of recombinant AUREO1c proteins after dark incubation or blue light irradiation. For (a, e, f), the experiment was repeated three times independently, yielding similar results and a representative result is shown.
Fig. 3
Fig. 3. AUREO1c regulates multiple processes related to photosynthesis and photoprotection, and can bind the promoters of LHCX2 and LHCX3.
a Enriched gene ontology (GO) terms for genes regulated in HWL compared to GL in wild type (WT), separated into AUREO1c-dependent and AUREO1c-independent gene groups (see “Methods” for definitions). These GO terms had an adjusted p value (p. adjust) <0.05. The p values were obtained from the one-sided Fisher’s exact test used in the clusterProfiler package, and Benjamini–Hochberg method was used to adjust for multiple comparisons (see “Methods”). The length of each bar is calculated based on its adjusted p value. b A scatterplot of all the genes in P. tricornutum genome showing their responses to HWL in WT cells and the effect of the aureo1c-1 mutation on their expression. LHC family genes and nuclear genes encoding subunits of the photosynthetic electron transport chain (ETC) are highlighted. The data plotted were averages from three independent cultures. c Genes encoding ETC components color-coded to show relative expression levels. The ratio of the transcript abundance of ETC genes between aureo1c-1 and WT under HWL is shown as a heatmap; red and blue indicate higher and lower expression in aureo1c-1 compared to WT respectively. Many of the ETC subunits are encoded by the chloroplast genome and could not be detected in regular RNA-Seq experiments; these are shown as the gray background for each complex. Association between the light-harvesting complex (LHC) family members with photosystem II or photosystem I has not been entirely elucidated. They are shown as green rods here, with their transcript abundance details in (d). Fld flavodoxin, FNR ferredoxin-NADP+ oxidoreductase, PS photosystem, Cyt b6f cytochrome b6f complex. Two FLD and four FNR gene isoforms were detected and plotted. The data plotted were averages from three independent cultures. d A heatmap showing the expression levels of the chlorophyll-binding protein-encoding genes in the LHC family. The genes were hierarchically clustered into five major categories (I–V). The expression level for each of the three independent cultures under each condition was plotted separately as a column. e DNA affinity purification sequencing (DAP-Seq) results showing enrichment of promoter regions of LHCX2 and LHCX3 in sequences bound to the AUREO1c protein. Note that different gene model annotations exist for LHCX2, and the Phatr2_54065 model shown in this panel is supported by our RNA-Seq and PCR validation results presented in Supplementary Fig. 16. This experiment was repeated twice independently with consistent results and a representative result is shown. f Electrophoretic mobility shift assays (EMSAs) showing the binding of recombinant AUREO1c to DNA probe harboring sequences from the promoters of LHCX2 and LHCX3 respectively. The competing unlabeled probes were applied in excess, as indicated (50–200x). An upper shift of the labeled probes suggests their binding to the AUREO1c protein. The experiment was repeated three times independently, yielding similar results and a representative result is shown. Source data are provided as a Source Data file.
Fig. 4
Fig. 4. AUREO1c rapidly induces LHCX gene expression upon high light and enables transcript and protein accumulation under rapidly fluctuating light.
a Transcript abundance of LI818 genes in wild-type C. reinhardtii (shown in green) and P. tricornutum (shown in orange brown) based on RT-qPCR at different time points after the switch from growth light (GL; 40 µmol photons m−2 s−1 of white light) to high blue light (260 µmol photons m−2 s−1). Three independent cultures were used for the quantification. Data are presented as mean values ± SD. The data were analyzed by using a one-sided unpaired t-test (*p < 0.05; **p < 0.01; and the p value corresponding to ** or * for LHCSR3.1, LHCSR3.2, LHCX2 and LHCX3 are 0.0024, 0.0048, 0.0183 and 0.00009 respectively). Correction for multiple comparisons was not performed. b Diagram of light regimes for LI818 transcript abundance and LI818 protein abundance analysis. Cells were initially grown under GL and then switched to continuous high light (CL; 550 µmol photons m−2 s−1 of white light) or fluctuating light (FL; 550 µmol photons m−2 s−1 of white light alternating with 40 µmol photons m−2 s−1 of white light). c Transcript abundances of LI818 genes in wild-type C. reinhardtii and P. tricornutum, after CL or FL treatments, relative to those under GL, measured by RT-qPCR. Samples from each condition receiving the same total length of high light treatment were compared. Three independent cultures were used for the quantification. Data are presented as mean values ± SD. d LI818 protein abundance in C. reinhardtii wild type (WT), P. tricornutum WT and the aureo1c-1 mutant, measured by proteomics. CrLHCSR3.1 and CrLHCSR3.2 are identical in amino acid sequence and are shown collectively as “CrLHCSR3” for C. reinhardtii WT, the data were normalized to the protein abundance of LHCSR3 under GL (shown as a dashed line). For P. tricornutum WT and the aureo1c-1 mutant, the data were normalized to the protein abundance of LHCX2 or LHCX3 in WT under GL (shown as a dashed line). Two independent cultures were used for the quantification and the means are presented. This experiment was repeated twice independently with similar results and a representative result is shown. e The NPQ of C. reinhardtii and P. tricornutum after 2 h of CL and FL treatments. Three independent cultures were used for the quantification. Data are presented as mean values ± SD. f Maximal quantum yields of PSII (Fv/Fm) of wild type (WT), and two lhcx2 lhcx3 mutants grown under fluctuating light (as the FL scheme in b) for 5 days. The Fv/Fm ratios are shown as false-color images with values shown below. g Maximal quantum yields of PSII (Fv/Fm) of WT, the aureo1c-1 mutant, and the COMP line, grown under fluctuating light (as FL in b) for 5 days. Uncropped images with additional replicates (independent cultures) for (f, g) are provided in Supplementary Fig. 6c, d. For (a, c, eg), the experiment was repeated three times independently with similar results and a representative result is shown. Source data are provided as a Source Data file.
Fig. 5
Fig. 5. A hypothetical model for the kinetic properties of the pathways regulating photoprotective gene expression in P. tricornutum and C. reinhardtii.
Note that factors beyond the photoreceptor-mediated pathways may also contribute to the kinetic features of LI818 gene induction, as cautioned in the “Discussion”.

Similar articles

Cited by

References

    1. Katz ME, Finkel ZV, Grzebyk D, Knoll AH, Falkowski PG. Evolutionary trajectories and biogeochemical impacts of marine eukaryotic phytoplankton. Annu. Rev. Ecol. Evol. Syst. 2004;35:523–556. doi: 10.1146/annurev.ecolsys.35.112202.130137. - DOI
    1. Ibarbalz FM, et al. Global trends in marine plankton diversity across kingdoms of life. Cell. 2019;179:1084–1097.e21. doi: 10.1016/j.cell.2019.10.008. - DOI - PMC - PubMed
    1. Field CB, Behrenfeld MJ, Randerson JT, Falkowski P. Primary production of the biosphere: integrating terrestrial and oceanic components. Science. 1998;281:237–240. doi: 10.1126/science.281.5374.237. - DOI - PubMed
    1. Seth K, et al. Bioprospecting of fucoxanthin from diatoms—challenges and perspectives. Algal Res. 2021;60:102475. doi: 10.1016/j.algal.2021.102475. - DOI
    1. Wang, W. et al. Structural basis for blue-green light harvesting and energy dissipation in diatoms. Science363, 10.1126/science.aav0365 (2019). - PubMed

MeSH terms