. 2024 Jul;27(7):1260-1273.
doi: 10.1038/s41593-024-01677-5. Epub 2024 Jul 2.

Direct neuronal reprogramming of mouse astrocytes is associated with multiscale epigenome remodeling and requires Yy1

Affiliations

Direct neuronal reprogramming of mouse astrocytes is associated with multiscale epigenome remodeling and requires Yy1

Allwyn Pereira et al. Nat Neurosci. 2024 Jul.

Abstract

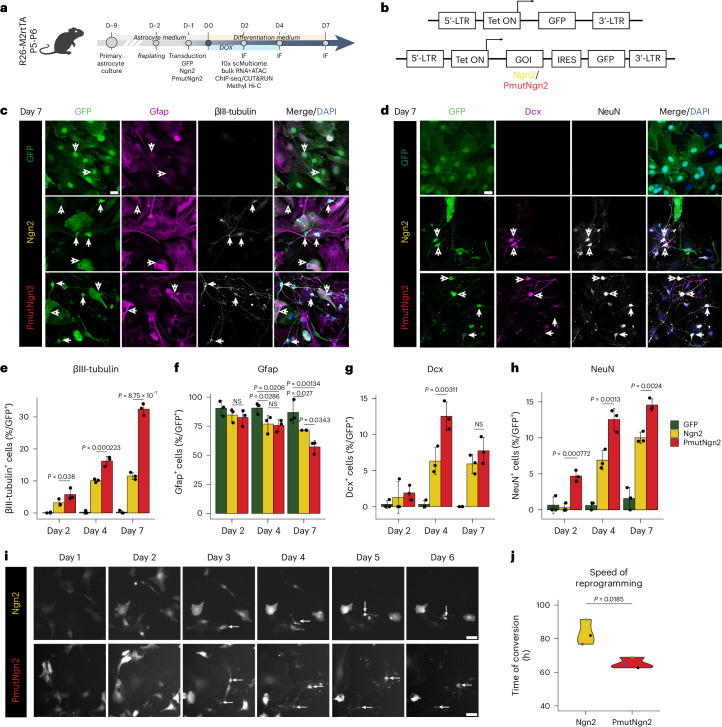
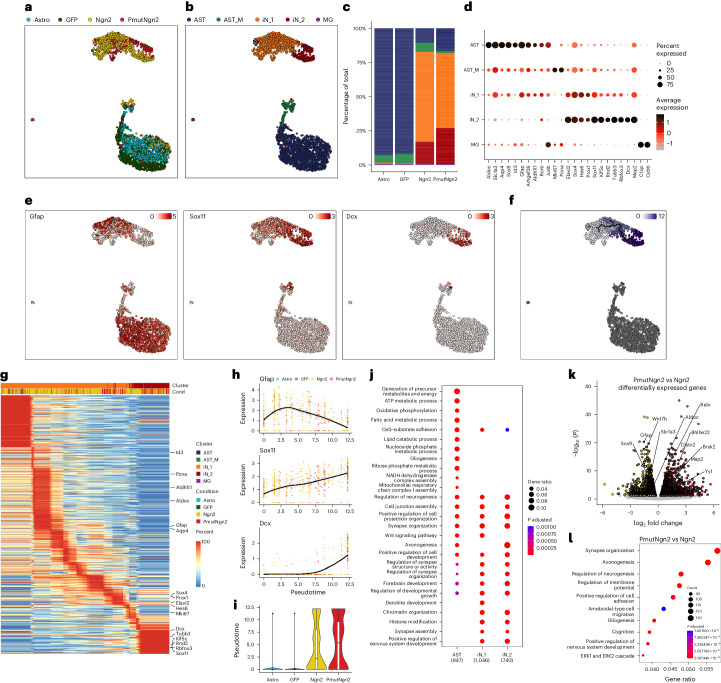
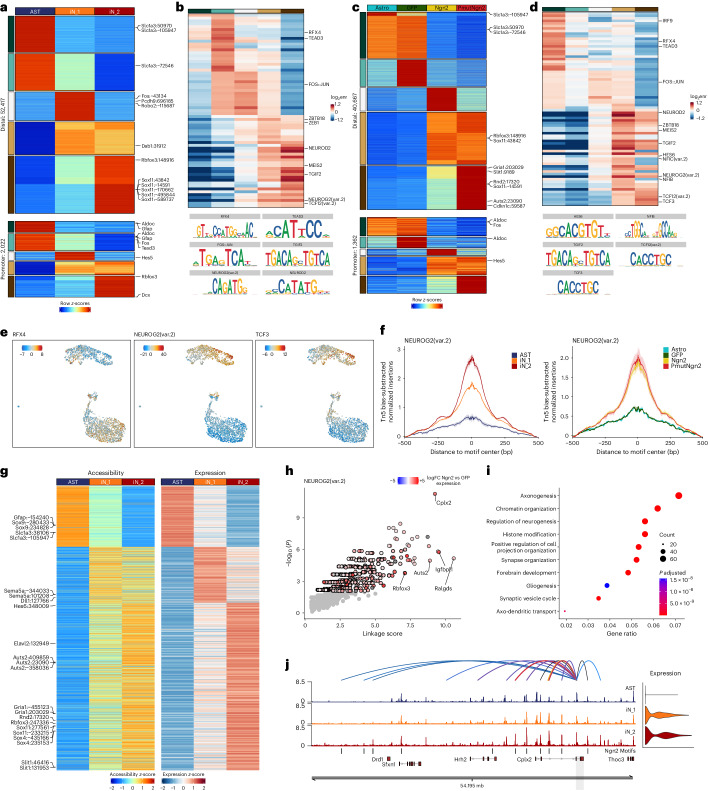
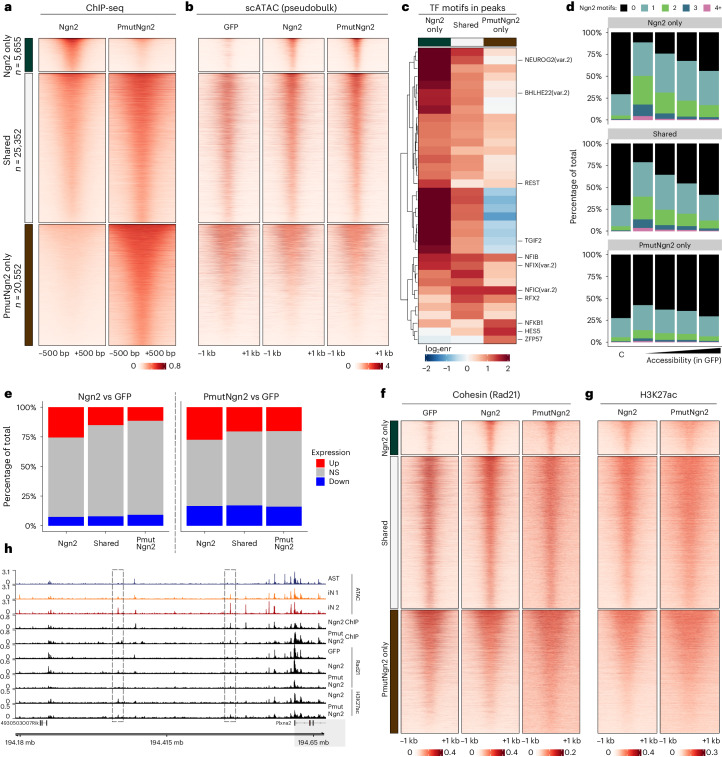
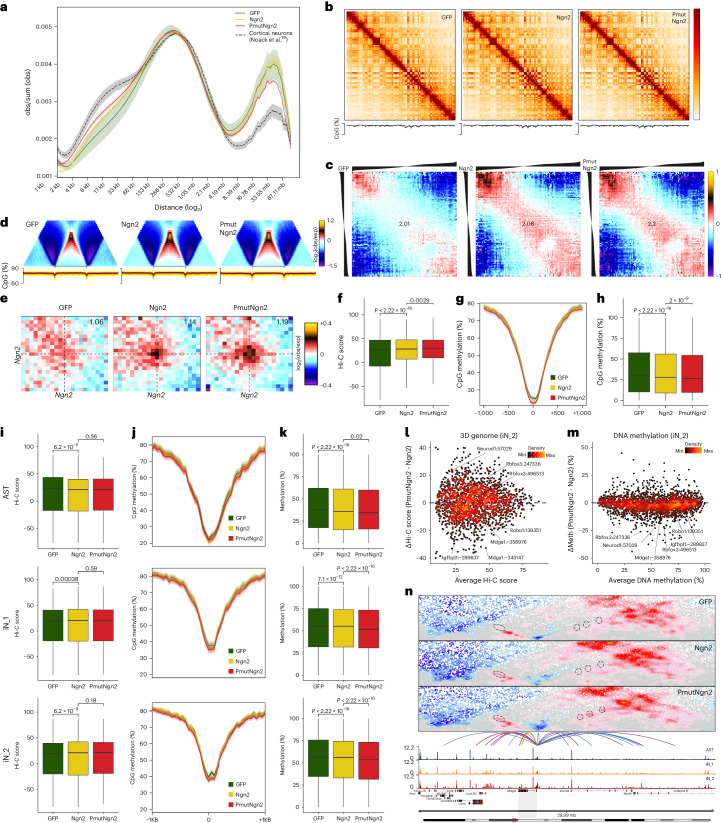
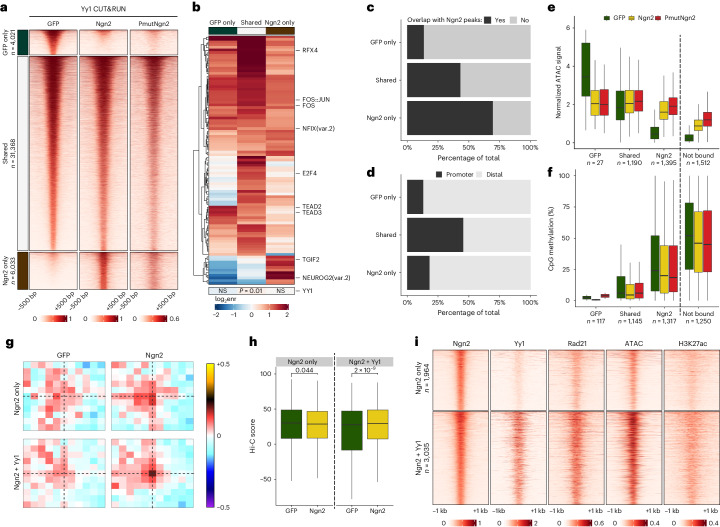
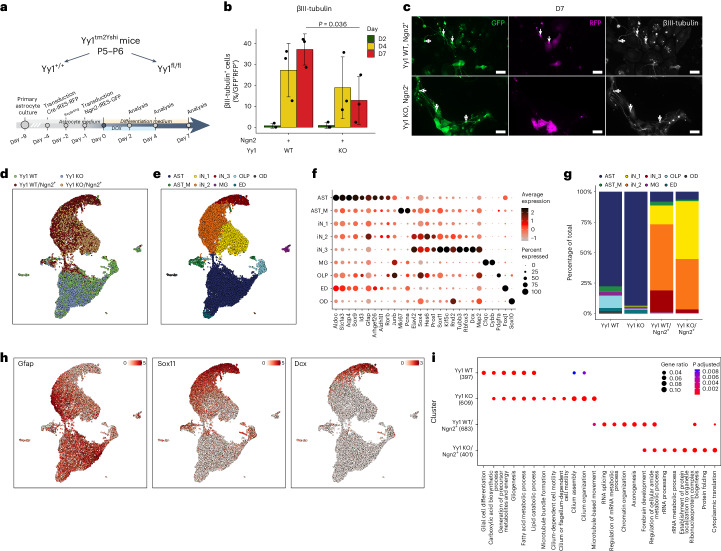
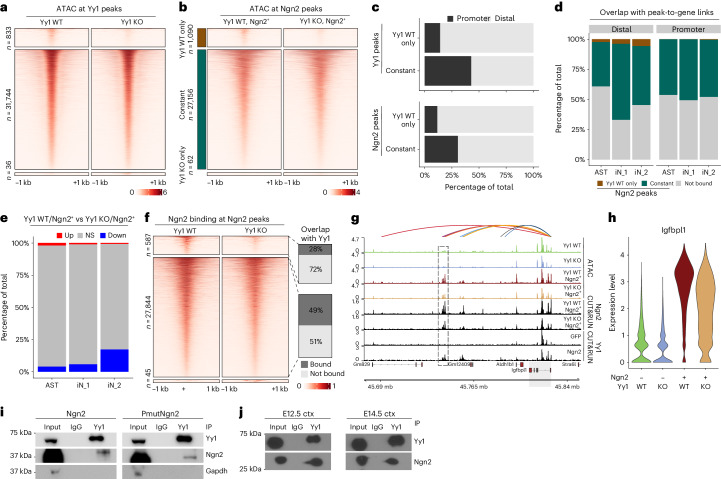
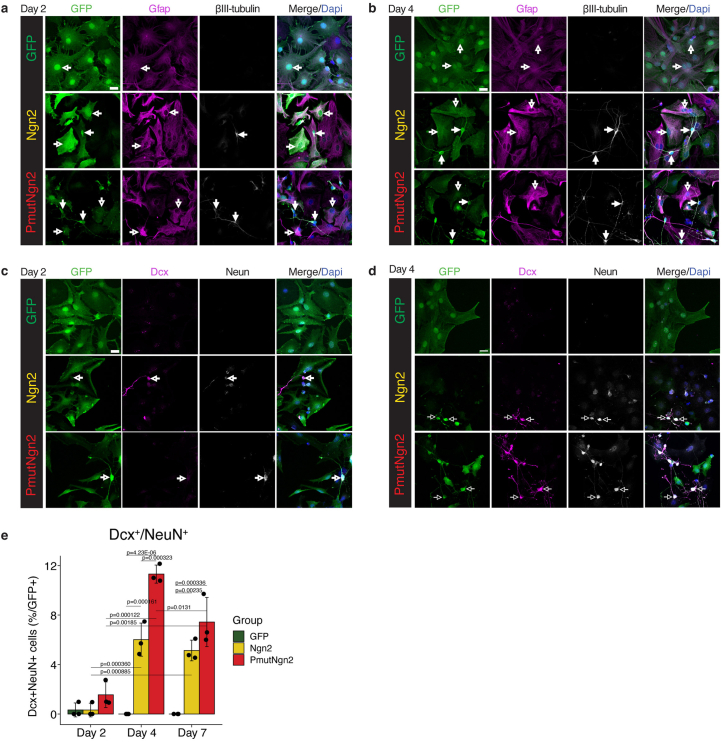
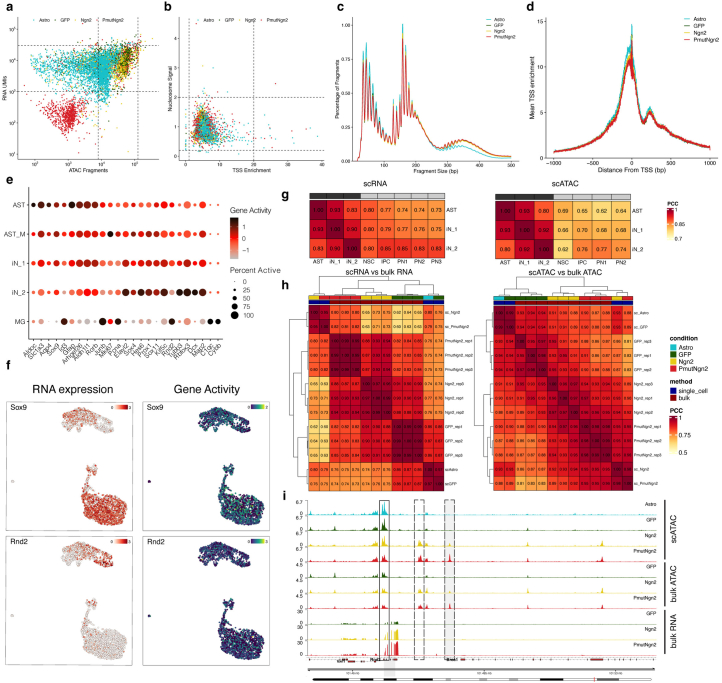
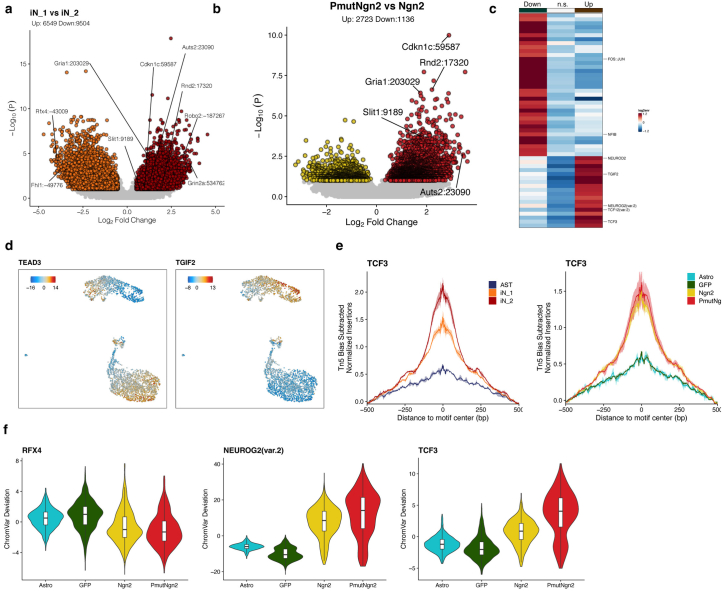
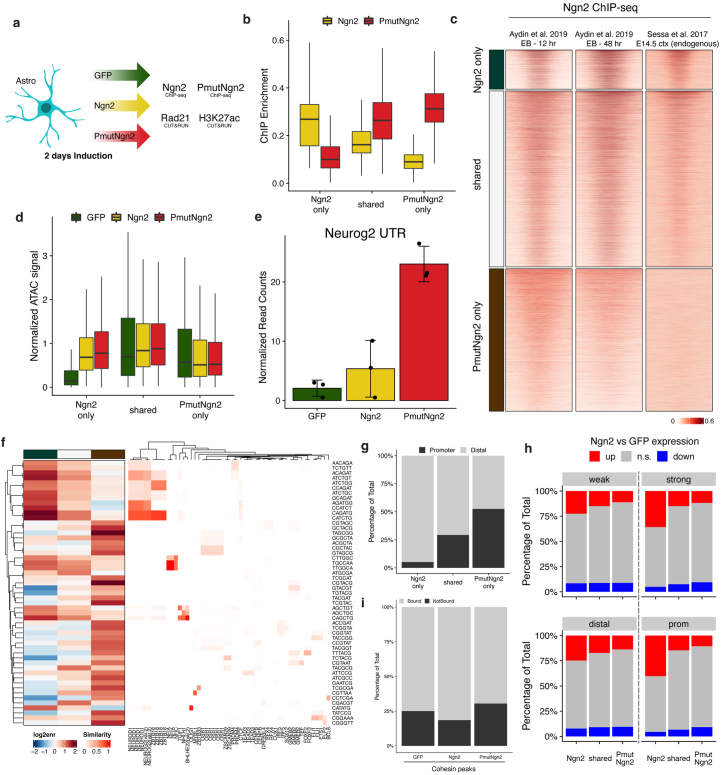
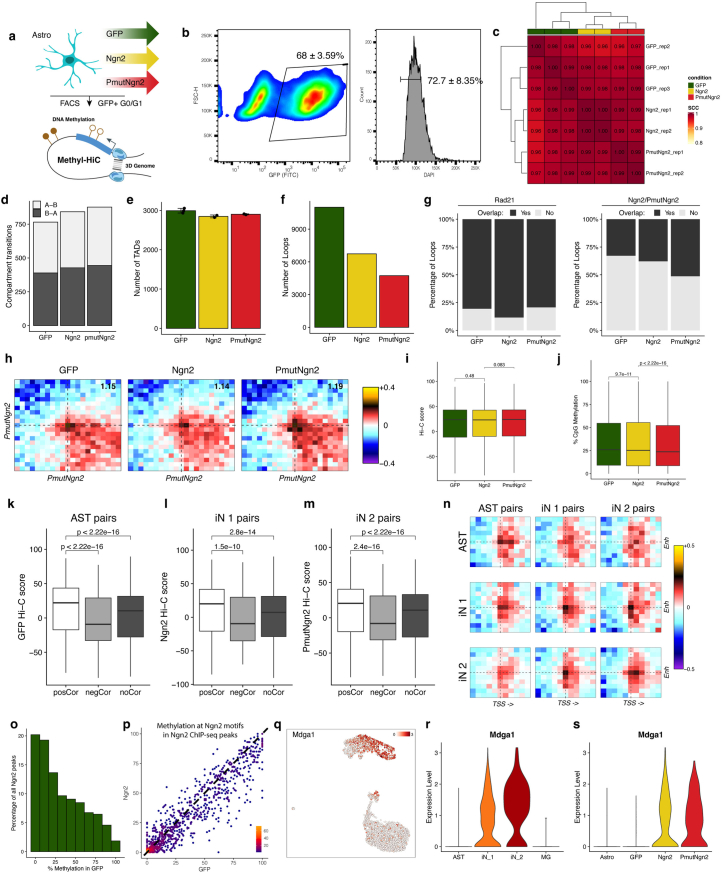
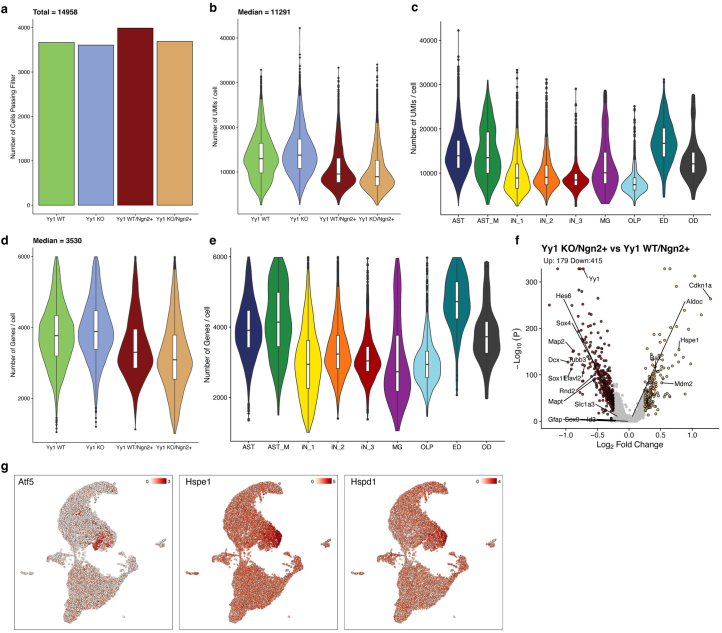
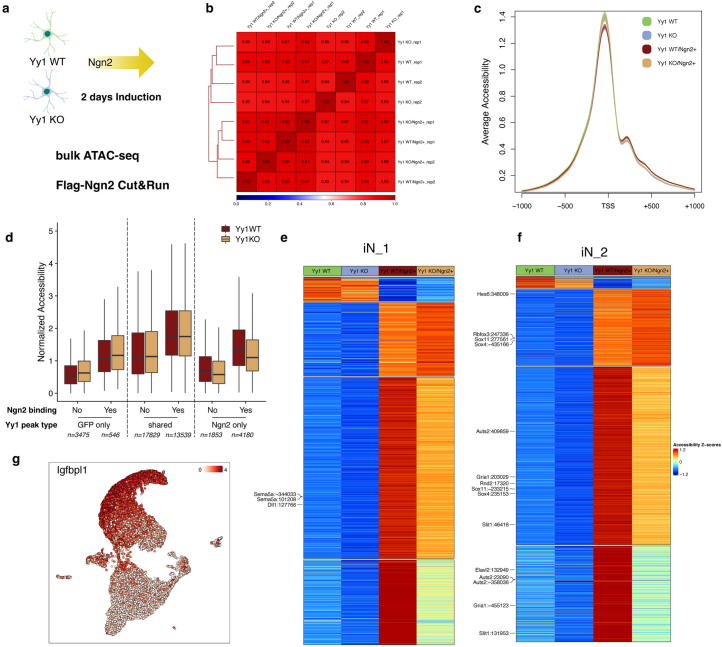
Direct neuronal reprogramming is a promising approach to regenerate neurons from local glial cells. However, mechanisms of epigenome remodeling and co-factors facilitating this process are unclear. In this study, we combined single-cell multiomics with genome-wide profiling of three-dimensional nuclear architecture and DNA methylation in mouse astrocyte-to-neuron reprogramming mediated by Neurogenin2 (Ngn2) and its phosphorylation-resistant form (PmutNgn2), respectively. We show that Ngn2 drives multilayered chromatin remodeling at dynamic enhancer-gene interaction sites. PmutNgn2 leads to higher reprogramming efficiency and enhances epigenetic remodeling associated with neuronal maturation. However, the differences in binding sites or downstream gene activation cannot fully explain this effect. Instead, we identified Yy1, a transcriptional co-factor recruited by direct interaction with Ngn2 to its target sites. Upon deletion of Yy1, activation of neuronal enhancers, genes and ultimately reprogramming are impaired without affecting Ngn2 binding. Thus, our work highlights the key role of interactors of proneural factors in direct neuronal reprogramming.


Conflict of interest statement

The authors declare no competing interests.

Figures

Fig. 1
Fig. 1. PmutNgn2 accelerates mouse astrocyte-to-neuron reprogramming.
a,b, Scheme of the experimental design (a) and the lentiviral constructs (b) used in the study. c,d, Representative micrographs of astrocytes immunostained as indicated on top of the panels at 7 dpi for the experimental condition indicated on the left. Scale bar, 20 µm. In c, the filled arrows mark the iNs, and the empty arrows mark cells lacking neuronal markers (n = 3, biologically independent samples). In d, the filled arrow marks mature iNs (NeuN+Dcx), and the empty arrow marks immature iNs (NeuN+Dcx+) (n = 3, biologically independent samples). eh, Histograms showing percent of βIII-tubulin+ (e), Gfap+ (f), Dcx+ (g) and NeuN+ (h) cells among transduced cells (y axis) over time (x axis). Data are plotted as mean ± s.e.m.; each dot represents an individual biological replicate (n = 3). i, Micrographs show example frames of a continuous live-imaging experiment for the indicated experimental conditions across the indicated timescale. Scale bar, 50 µm. j, Violin plot showing the first timepoint when tracked cells showed a neuronal morphology; each dot represents a biological replicate (n = 3). Statistical significance was calculated using a linear regression model (eh,j). D, day; NS, not significant; IF, immunofluorescence. Source data
Fig. 2
Fig. 2. Gene expression differences elicited by Ngn2 and PmutNgn2.
a,b, Joint (single-cell RNA + single-cell ATAC) UMAP projection, where murine cells are colored based on the experimental condition (a) or their cluster identity (b). c, Stacked bar plot representing the relative proportion of the identified cell types in each experimental condition. d, Dot plot showing the proportion of cells (as a percentage, size of dots) and the gene expression levels of selected marker genes (color) in the respective cell type clusters. e, UMAP visualization of the expression levels of indicated markers genes. f, UMAP visualization of the inferred neuronal maturation trajectory and the corresponding pseudotime. g, Heatmap depicting the expression levels of the most variable genes across maturation pseudotime. h, Gene expression changes of the indicated marker genes across the maturation pseudotime. Each dot depicts the expression level per cell of the given gene across pseudotime; the color indicates the experimental condition identity; and the line represents a smoothed fit of the gene expression values across pseudotime. i, Box plots depicting the pseudotime values per condition (n = 708, 708, 732 and 311 cells, respectively). Shown are the median (line), 25th or 75th percentiles (box) and 10th or 90th percentiles (whiskers). j, Bubble plot depicting the enriched GO terms specific to the indicated clusters. Statistical significance was calculated using a Benjamini–Hochberg-adjusted hypergeometric test. k, Volcano plot depicting the differentially expressed genes (FDR < 0.05) from a pairwise comparison between PmutNgn2 versus Ngn2 using bulk RNA-seq (n = 3 biological replicates). l, Bubble plot showing the top 10 GO terms of the differentially regulated genes from a pairwise comparison between PmutNgn2 versus Ngn2 bulk RNA-seq.
Fig. 3
Fig. 3. Changes in regulatory landscape caused by Ngn2 or PmutNgn2.
a, Heatmap of the pseudobulk accessibility (z-scores) per murine cell type cluster of the differentially accessible sites in distal and promoter regions. b, Heatmap depicting the log2 fold enrichment of TF motifs in the five clusters identified by k-means clustering of the differentially accessible sites between cell types in distal and promoter regions. c, Same as a but for differentially accessible sites identified per experimental condition. d, Same as b but for TF motif enrichment in the clusters of differentially accessible sites identified per experimental condition. e, UMAP projection of motif activity scores for the indicated TFs. Scale bar represents the ChromVar motif deviation score. f, Motif footprint of NEUROG2(var.2) normalized for Tn5 insertion bias at the single-cell ATAC peaks in the indicated cell type clusters or experimental condition. g, Heatmaps depicting the aggregated accessibility of putative enhancer elements (left) and the expression levels of their linked genes (right) for positively correlated EGPs. h, Scatter plot depicting the predicted target genes of Ngn2 based on its motifs, with each dot representing a putative target gene. Significant genes are colored based on log fold change (FC) of expression between Ngn2 and the GFP condition (bulk RNA-seq). i, Bubble plot depicting the top 10 GO terms of the predicted Ngn2 target genes based on its motif. Color and size of circles indicate Benjamini–Hochberg-adjusted P value (hypergeometric test) and number of genes, respectively. j, Genome track showing aggregated single-cell ATAC accessibility and expression in the indicated experimental conditions at the Cplx2 locus. Values represent reads per million mapped reads (RPM). enr, enrichment.
Fig. 4
Fig. 4. Ngn2 or PmutNgn2 differentially bind and remodel chromatin.
a,b, Heatmaps showing the enrichment of ChIP-seq (a) or pseudobulk single-cell ATAC-seq (b) signal around differentially bound or shared peaks in murine iNs. c, Heatmaps depicting the motif enrichment in the peaks groups shown in a and b. d, Number of Ngn2 motifs in different peak categories, stratified by chromatin accessibility in GFP-transduced astrocytes. ‘C’ indicates the control group of peaks (randomly sampled accessible regions that are not bound by Ngn2 or PmutNgn2). e, Percentage of differentially regulated genes (based on bulk RNA-seq) overlapping with different peak categories (±100-kb window around the TSS). f,g, Heatmaps showing the enrichment of cohesin (Rad21) (f) or H3K27ac (g) CUT&RUN signal around differentially bound or shared Ngn2/PmutNgn2 peaks. h, Genome track showing aggregated single-cell ATAC accessibility, Ngn2/PmutNgn2 ChIP-seq as well as Rad21 and H3K27ac CUT&RUN tracks in the indicated experimental conditions at the Plxna2 locus. Values represent reads per million mapped reads (RPM). Dashed rectangles depict distal enhancers of the Plxna2 locus (shaded region), which show increased chromatin accessibility and recruitment of Rad21 and H3K27ac upon Ngn2 binding. enr, enrichment; NS, not significant.
Fig. 5
Fig. 5. PmutNgn2 enhances 3D genome and DNA methylation changes.
a, Contact probability as a function of the genomic distance. Lines: mean values from biological replicates; semi-transparent ribbons: s.e.m. obs/sum (obs), normalized contact probability. b, Knight–Ruiz balanced contact matrices for Chr 3 at 250-kb resolution (top) and DNA methylation (bottom). c, Average contact enrichment between pairs of 250-kb loci arranged by their eigenvalue (shown on top). Numbers represent the compartment strength. d, Average contact enrichment (top) and DNA methylation levels (bottom) across TADs. e, Aggregated Hi-C plots between intra-TAD pairs of the top 5,000 Ngn2 ChIP-seq peaks. f, Quantification of the interaction strength of intra-TAD contact pairs depicted in e (n = 6,888 pairs). g, Average DNA methylation plots at the distal regions within the top 5,000 Ngn2 ChIP-seq peaks. h, Quantification of the average DNA methylation at the sites depicted in g (n = 4,125 regions). i, Box plots depicting the interaction strength of intra-TAD cluster-specific positively correlated EGPs (n = 1,853, 1,795 and 3,852 pairs, respectively). j, Average DNA methylation plots at enhancers belonging to cluster-specific EGPs. k, Quantification of DNA methylation levels at enhancers belonging to cluster-specific EGPs (n = 1,568, 1,661 and 3,275 regions, respectively). l, Density scatter plots showing iN_2 E–P contact strengths. m, Same as l but for DNA methylation. n, Contact map (top) and aggregated accessibility of matched single-cell ATAC-seq clusters (bottom) at the Mdga1 locus. Depicted are the identified linked enhancers (arcs), colored by the Pearson correlation of the enhancer accessibility and Mdga1 expression. Dashed circles highlight dynamic E–P interactions. The shaded region highlights the Mdga1 locus and its associated contact map (top) and the aggregated accessibility of matched single-cell ATAC-seq clusters (bottom). Statistical significance in f, hi and k was calculated using a two-sided paired Wilcoxon rank-sum test. Obs and exp refer to observed and expected chromatin contacts, respectively. All box plots display median (line), 25th or 75th percentiles (box) and 10th or 90th percentiles (whiskers). All experiments were performed with murine cells.
Fig. 6
Fig. 6. Ngn2 and Yy1 synergize to alter the epigenetic landscape.
a, Heatmaps showing the enrichment of Yy1 CUT&RUN signal around differentially bound or shared peaks. b, Heatmap depicting the TF motif enrichment in the peak groups shown in a. c, Percentage overlap between Ngn2 peaks and either differentially bound or shared Yy1 peaks. d, Overlap of differential or shared Yy1 peaks with genomic features. e, Box plots depicting chromatin accessibility at the top 5,000 Ngn2 peaks overlapping differential or shared Yy1 peaks or not bound by Yy1. f, As in e but quantifying DNA methylation at the respective regions. Box plots display median (line), 25th or 75th percentiles (box) and 10th or 90th percentiles (whiskers). n indicates the number of regions in each category. g, Aggregated Hi-C plots between intra-TAD pairs of the top 5,000 Ngn2 ChIP-seq peaks, split by whether they overlap (Ngn2+Yy1) or not (Ngn2 alone) with Yy1. h, Quantification of the interaction strength of the pairs depicted in g. Statistical significance was calculated using a two-sided paired Wilcoxon rank-sum test (n = 1,038 and n = 3,035 pairs, respectively). Box plots display median (line), 25th or 75th percentiles (box) and 10th or 90th percentiles (whiskers). i, Heatmaps showing the enrichment of Ngn2, Yy1, Rad21, pseudobulk single-cell ATAC and H3K27ac signal around the same peaks as in g. Experiments were performed with murine cells. enr, enrichment; NS, not significant.
Fig. 7
Fig. 7. Successful murine glia-to-neuron reprogramming requires Yy1.
a, Scheme of the experimental design. b, Quantification of the proportion of GFP+RFP+ immunopositive for βIII-tubulin. Data are plotted as mean ± s.d.; each dot represents an individual biological replicate (n = 3). Statistical significance was calculated using a linear regression model. c, Representative micrographs of immunocytochemistry as indicated at 7 dpi of Ngn2 (GFP+) in the indicated conditions. The filled arrow indicates βIII-tubulin+ iNs in the double-transduced (GFP+RFP(Cre)+) cells; the empty arrow indicates βIII-tubulin+ iNs transduced only with Ngn2 (GFP+). Scale bar, 50 µm. Immunostainings were independently replicated (n = 3). d, Single-cell RNA-seq UMAP projection of the indicated experimental conditions. e, Same as d but for the identified cell type clusters. f, Dot plot showing the proportion of cells (as a percentage, size of dots) and the expression levels of selected marker genes in respective cell type clusters. g, Stacked bar plot depicting the proportion of the cell types in the respective experimental conditions. h, UMAP visualization of the expression of the indicated marker genes. i, Bubble plot depicting the GO term enrichment in the indicated experimental conditions. D, day; KO, knockout; WT, wild-type. Source data
Fig. 8
Fig. 8. Yy1 facilitates Ngn2-mediated epigenetic remodeling.
a, Heatmaps showing the enrichment of chromatin accessibility signal around differentially bound or shared Yy1 peaks in astrocytes from Yy1 WT or Yy1 KO mice, respectively. b, Heatmaps showing the enrichment of chromatin accessibility signal around differentially accessible or shared Ngn2 peaks in either Yy1 WT+Ngn2 or Yy1 KO+Ngn2 condition. c, Overlap of Yy1 and Ngn2 peaks that lose accessibility (Yy1 WT) or remain unchanged (shared) with genomic features. d, Overlap of Yy1 and Ngn2 peaks that lose accessibility or remain unchanged with EGP links as identified in Fig. 3g. e, Percentage of differentially regulated genes (based on single-cell RNA-seq) overlapping with either distal or promoter EGP anchor. f, Heatmaps showing Ngn2 (Flag) CUT&RUN enrichment at either differentially bound or shared peaks. Shown is also the ratio between peaks overlapping with Yy1 in each category. g, Genome track showing the linked enhancers (arcs), chromatin accessibility, Ngn2 and Yy1 CUT&RUN signal in the indicated conditions at the Igfbpl1 locus. A cluster of enhancers with reduced accessibility upon Yy1 KO is indicated with a dashed rectangle. The shaded region highlights the Igfbpl1 locus. h, Violin plot depicting the expression levels of Igfbpl1 in the indicated conditions. i, Co-IP experiments in P19 cells showing pulldown using IgG or Yy1 antibody and staining for Yy1, Ngn2 and Gapdh. j, Similar to i but using either E12.5 or E14.5 cortex with endogenous Yy1 and Ngn2. i,j, Co-IP experiments were independently replicated (n = 2). ctx, cortex; KO, knockout; NS, not significant; WT, wild-type. Source data
Extended Data Fig. 1
Extended Data Fig. 1. PmutNgn2 accelerates mouse astrocyte-to-neuron reprogramming.
(a-d) Representative micrographs of astrocytes immunostained for the indicated proteins at day 2 and 4 after induction of the inducible constructs expressing GFP, Ngn2 or PmutNgn2. Scale bar 20 µm. In (c), the filled arrow heads mark the iNs, the empty arrow heads mark example cells lacking neuronal markers. In (d), the filled arrow heads mark mature iNs (NeuN+Dcx-), the empty arrow marks immature iNs (NeuN+Dcx + ). (e) Histograms depicting cell quantifications indicated on the y-axis over time indicated on the x-axis. Data are plotted as mean ± standard deviation (sd) where the dots represent individual biological replicates (n = 3).
Extended Data Fig. 2
Extended Data Fig. 2. Quality control and comparison of genomic datasets.
(a-b) Scatter plot of the RNA UMIs, ATAC fragments, Nucleosome signal and TSS enrichment per cell, colored by experimental condition. The cells within the square box were retained for further analysis. (c) Aggregated scATAC-seq (multiome) fragment size distribution, colored by cell condition. (d) Aggregated fragment enrichment at all TSSs from the scATAC-seq (multiome), colored by experimental condition. (e) Dot plot showing gene activity estimated by gene body accessibility at the indicated set of markers genes. (f) UMAP projection of RNA expression and gene activity for Sox9 and Rnd2 respectively. (g) Correlation heatmaps comparing this study with in vivo single-cell dynamics in the E14.5 developing mouse cortex (h) Correlation heatmaps showing the similarity between gene expression or ATAC using single cell (10x multiome) and bulk RNA/ATAC. (i) Genome track depicting the chromatin accessibility measured by single cell and bulk ATAC-seq and the transcriptional output measured by bulk RNA-seq at the Rnd2 gene locus. Full rectangle demarcates the gene body of Rnd2 while the dashed rectangles denote the putative distal regulatory regions of Rnd2.
Extended Data Fig. 3
Extended Data Fig. 3. Chromatin accessibility characteristics of induced neurons.
(a-b) Volcano plot depicting the differentially accessible regions (DARs) (pseudobulk chromatin accessibility at ATAC peaks from multiome data) identified from a pairwise comparisons. (c) Heatmap depicting the log2-fold enrichment of TF motifs in the DARs. (d) UMAP visualization of TF motif activity of the indicated TFs. (e) Motif footprint of Tcf3 normalized for Tn5 insertion bias at the scATAC peaks in the indicated cell type clusters (left) or experimental condition (right). (f) Boxplots depicting the ChromVar deviation values for the indicated TFs in the indicated experimental conditions (n = 708, 708, 732 and 311 cells per condition respectively). Boxplots display median (line), 25th or 75th percentiles (box) as well as 10th or 90th percentiles (whisker).
Extended Data Fig. 4
Extended Data Fig. 4. Ngn2 and PmutNgn2 binding remodels chromatin.
(a) Schematic representation of the experimental setup (b) Boxplots depicting the ChIP-seq enrichment in reads per million (RPM) at the indicated peak groups (n = 5655, 25352 and 20552 regions respectively). (c) Heatmaps showing ChIP-seq around differentially bound or shared Ngn2/PmutNgn2 peaks. (d) Boxplots depicting normalized accessibility (RPM) at the indicated peak groups (n = 5655, 25352 and 20552 regions respectively). (e) Barplots with mean ± s.d. showing the normalized read counts mapping to either the 5’ or the 3’UTR of the endogenous Ngn2 locus. Dots represent individual biological replicates (n = 3) (f) Heatmaps depicting kmer enrichment in the peak groups shown in Fig. 4a,b, as well as the closest matching TF motif based on similarity. (g) Percentage overlap between peaks and gene promoters ( ± 5 kb from TSS). (h) Percentage of differentially regulated genes (based on bulk RNA-seq) overlapping with different peak categories or genomic features. (i) Percentage of Ngn2/PmutNgn2 peaks overlapping with Rad21 (Cohesin) peaks in the corresponding condition. All boxplots display median (line), 25th or 75th percentiles (box) as well as 10th or 90th percentiles (whisker).
Extended Data Fig. 5
Extended Data Fig. 5. Ngn2 and PmutNgn2 rewire the 3D genome.
(a) Schematic representation of the methyl-HiC experimental strategy (b) FACS gating strategy for sorting transduced (GFP + ) cells in the G0/G1 cell cycle stage. (c) Pairwise correlation matrixes displaying 3D genome correlation coefficient (stratum adjusted correlation coefficient, 50 kb bins, calculated by HiCRep). (d) Stacked bar plots depicting compartment transitions. (e) Barplot showing the number of TADs per condition (n = 3, 2 and 2 biological replicates for GFP, Ngn2 and PmutNgn2 respectively). Data is represented as mean ± s.d. and individual values are shown as dots. (f) Barplot showing the number of chromatin loops per condition (FDR < = 0.1). (g) Stacked barplots showing the percentage overlap between Rad21 or Ngn2/PmutNgn2 peaks and loop anchors. (h) Aggregated Hi-C plots between intra-TAD pairs of the top 5000 PmutNgn2 peaks. (i) Quantification of the interaction strength of intra-TAD contact pairs depicted in (h) (n = 7036 pairs). Statistical significance is calculated using a two-sided, paired Wilcoxon rank-sum test. (j) Quantification of the average DNA methylation at the distal regions within the top PmutNgn2 distal sites (n = 4141). Statistical significance is calculated using a two-sided, paired Wilcoxon rank-sum test. (k-m) HiC scores measured in AST, iN 1 or iN 2 between cluster-specific positive (posCor), negatively (negCor) or non-correlated (noCor) enhancer-gene pairs. Statistical significance is calculated using a two-sided, unpaired Wilcoxon rank-sum test. Number of regions per category are indicated directly at the plot. (n) Aggregated Hi-C maps between the linked distal peak and the transcription start site (TSS) of cluster specific enhancer-gene pairs. Genes are oriented according to transcription. (o) Histogram depicting the percentage of methylation in the GFP methyl-HiC condition at Ngn2 ChIP-seq binding sites. (p) Density scatter plot showing the level of DNA methylation at Ngn2 motifs within Ngn2 ChIP-seq peaks. (q) Expression levels of Mdga1 visualised on joint UMAP projection. (r-s) Violin plot depicting the expression levels of Mdga1 in the indicated cell-type clusters or conditions. All boxplots display median (line), 25th or 75th percentiles (box) as well as 10th or 90th percentiles (whisker).
Extended Data Fig. 6
Extended Data Fig. 6. Yy1 is required for successful mouse astrocyte-to-neuron conversion.
(a) Bar plot showing the number of cells per experimental condition that passed the quality control filters and were used for downstream analysis. (b) Violin and box-whisker plot depicting the number of UMIs per cell for each experimental condition (n = 3666, 3608, 3991 and 3693 cells per condition respectively). (c) Same as d, but for each annotated cell-type cluster (n = 6790, 338, 2378, 3691, 835, 175, 444, 208 and 99 cells per cluster respectively). (d) Violin and box-whisker plot depicting the number of genes per cell for each experimental condition (n = 3666, 3608, 3991 and 3693 cells respectively). (e) Same as f, but for each annotated cell-type cluster (n = 6790, 338, 2378, 3691, 835, 175, 444, 208 and 99 cells per cluster respectively). (f) Volcano plot showing the differentially expressed genes for the following pairwise comparison, Yy1_KO/Ngn2+ vs Yy1_WT/Ngn2. Yellow, red, and grey dots represent the up-, down- and non-regulated genes. (g) UMAP visualization of the expression levels of the indicated marker genes. All boxplots display median (line), 25th or 75th percentiles (box),10th or 90th percentiles (whisker) and outliers (dots).
Extended Data Fig. 7
Extended Data Fig. 7. Yy1 deletion impairs Ngn2-mediated chromatin remodelling.
(a) Schematic representation of the experimental setup (b) Pearson’s correlation for ATAC in the indicated experimental conditions (N = 2 biological replicates). (c) Average accessibility (+/- 1 kb) at all TSSs in the indicated experimental conditions. (d) Boxplots depicting the normalized accessibility levels in Yy1WT/KO + Ngn2 conditions at different categories of Yy1 peaks (based on Fig. 7a) grouped by the overlap with Ngn2 binding sites. Boxplots display median (line), 25th or 75th percentiles (box),10th or 90th percentiles (whisker) and outliers (dots) (e-f) Heatmaps depicting the accessibility levels at iN_1 or iN_2 distal enhancers in the indicated experimental conditions. (g) UMAP visualization of the expression levels of Igfbpl1.

References

    1. Barker RA, Gotz M, Parmar M. New approaches for brain repair—from rescue to reprogramming. Nature. 2018;557:329–334. - PubMed
    1. Heins N, et al. Glial cells generate neurons: the role of the transcription factor Pax6. Nat. Neurosci. 2002;5:308–315. - PubMed
    1. Heinrich, C. et al. Directing astroglia from the cerebral cortex into subtype specific functional neurons. PLoS Biol.8, 1000373 (2010). - PMC - PubMed
    1. Masserdotti G, et al. Transcriptional mechanisms of proneural factors and REST in regulating neuronal reprogramming of astrocytes. Cell Stem Cell. 2015;17:74–88. - PMC - PubMed
    1. Gascón, S. et al. Identification and successful negotiation of a metabolic checkpoint in direct neuronal reprogramming. Cell Stem Cell18, 396–409 (2016). - PubMed

MeSH terms

Substances