. 2024 Jul;56(7):1420-1433.
doi: 10.1038/s41588-024-01777-9. Epub 2024 Jul 3.

Homopolymer switches mediate adaptive mutability in mismatch repair-deficient colorectal cancer

Affiliations

Homopolymer switches mediate adaptive mutability in mismatch repair-deficient colorectal cancer

Hamzeh Kayhanian et al. Nat Genet. 2024 Jul.

Abstract

Mismatch repair (MMR)-deficient cancer evolves through the stepwise erosion of coding homopolymers in target genes. Curiously, the MMR genes MutS homolog 6 (MSH6) and MutS homolog 3 (MSH3) also contain coding homopolymers, and these are frequent mutational targets in MMR-deficient cancers. The impact of incremental MMR mutations on MMR-deficient cancer evolution is unknown. Here we show that microsatellite instability modulates DNA repair by toggling hypermutable mononucleotide homopolymer runs in MSH6 and MSH3 through stochastic frameshift switching. Spontaneous mutation and reversion modulate subclonal mutation rate, mutation bias and HLA and neoantigen diversity. Patient-derived organoids corroborate these observations and show that MMR homopolymer sequences drift back into reading frame in the absence of immune selection, suggesting a fitness cost of elevated mutation rates. Combined experimental and simulation studies demonstrate that subclonal immune selection favors incremental MMR mutations. Overall, our data demonstrate that MMR-deficient colorectal cancers fuel intratumor heterogeneity by adapting subclonal mutation rate and diversity to immune selection.


Conflict of interest statement

The authors declare no competing interests.

Figures

Fig. 1
Fig. 1. Subclonal MSH6F1088fs and MSH3K383fs homopolymer frameshift mutations drive increased mutation burden in the MMRd CRC GEL WGS cohort.
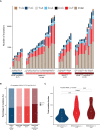
a, MS-instable CRC. b, The MMR system safeguards genomic integrity by detecting and repairing replication-associated mismatches (left, blue). Recent studies indicate that MutS also participates in the repair of endogenous mutational damage independent of MLH1 (right, pink). c, Volcano plot showing the relationship between MS frameshifts in individual genes and total mutation burden in multiple linear regression analysis. For each independent variable, the P value of a two-sided t-test is plotted as −log10(P). Two-sided F statistic (accounting for multiple independent variables in the regression model) P = 4.2 × 10−7. d, Pie charts showing mutation categories for MSH3 (top) and MSH6 (bottom). e, Cases with MSH6F1088fs and/or MSH3K383fs homopolymer frameshifts (in red), and cases without such mutations (in blue) ranked by mutation burden (n = 217). Clonal alterations in MMR genes MLH1, PMS2, MSH2 and MSH6, as well as subclonal MSH6F1088fs and MSH3K383fs frameshift status, are indicated below. Insets show MSH6F1088fs and MSH3K383fs mutation variant allele fraction. Extended Data Fig. 1a–c shows analysis restricted to BRAFV600E tumors. fh, Number of SNV (f), number of InDel (g) and total mutation burden (h) according to MSH6F1088fs and MSH3K383fs mutation status. Median values are represented by horizontal black lines.
Fig. 2
Fig. 2. Frameshift switching of the MSH6 C8 coding homopolymer drives stochastic loss and restoration of MSH6 expression like a molecular ON/OFF switch.
a,b, Example hematoxylin and eosin (H&E) staining (a) and MSH6 IHC for polypoid cancer displaying subclonal loss of MSH6 expression (marked by dashed line, b). The tumor showed a BRAFV600E mutation and MLH1 methylation with loss of MLH1 and PMS2 labeling throughout the tumor (not shown). Boxes i, ii and iii are shown in ce. (c) Region i, normal crypts show reference MSH6 labeling. (d) Region ii, small MSH6-deficient subclone. e, Region iii, nested MSH6-reverter subclone shows restoration of MSH6 labeling in tumor cells. f, Multiplex IHC (Methods) confirms scattered nested individual tumor cells (region ii) and small strips (iii) marked by pan-CK (red), which have restored MSH6 labeling (nuclear green) within MSH6-deficient tumor regions. MSH6-proficient region (box i) is shown for reference. g, LCM followed by Sanger sequencing of DNA from microdissected tumor regions confirms that frameshift switching of the C8 coding homopolymer underpins loss and subsequent restoration of MSH6 expression (Hg38 chr2: 47,803,501). h, Schematic representation showing that frameshift reversion mutations in the coding MSs of MSH6 and MSH3 allow them to act as a molecular ON/OFF switch for mutation rate. ag, The workflow described was performed in n = 3 independent tumors.
Fig. 3
Fig. 3. Subclonal MSH6F1088fs and MSH3K383fs homopolymer frameshift mutations drive intratumor mutation burden and mutation bias heterogeneity and provoke increased antigen presentation machinery mutations.
a, LCM strategy. Top, MSH6 IHC results with four target regions indicated—two regions show loss of MSH6 immunolabeling and two regions show retained MSH6 immunolabeling. Bottom, consecutive slide after LCM. bd, Number of SNV (b), number of InDel (c) and total mutation burden (d) in LCM samples according to MSH6F1088fs and MSH3K383fs mutation status. e, SNV and InDel mutation bias in sample groups according to MSH6F1088fs and MSH3K383fs mutation status. fh, Detailed 96-channel trinucleotide mutation spectra comparing substitution bias between (f) MSH6wt/MSH3wt and MSH6F1088fs regions, (g) MSH6wt/MSH3wt and MSH3K383fs regions and (h) MSH6wt/MSH3wt and MSH6F1088fs plus MSH3K383fs regions, respectively. i, Heatmaps showing the number of mutations in antigen presentation machinery genes in samples according to MSH6 and MSH3 homopolymer InDel mutation status. j, Violin plot showing increased number of HLA or antigen presentation machinery gene mutations in samples according to MSH6 and/or MSH3 homopolymer frameshift status. Two-sided Wilcoxon test. k, Trinucleotide context of antigen presentation machinery gene mutations. l, Overview case UCL_1014 with LCM samples as indicated (boxed regions). MSH6-proficient tumors are in blue, and MSH6-deficient areas are in red. Arrowheads in high-power images indicate minute reverter clones. m, Phylogenetic tree for tumor UCL_1014 annotated with HLA mutations identified in samples s111 and s112. n, MOBSTER subclonal deconvolution from diploid variants detected in LCM samples s111 (left, blue) and s112 (right, pink) from patient UCL_1014 shows a clonal population C1 with a subclonal tail of neutral variants. o, Cumulative frequency distribution of subclonal tail variants in s111 and s112. The point estimate of the normalized mutation rate μ in p is estimated from the slope of the cumulative frequency distribution. p, Bootstrapped 95% CI for the point estimate of the mutation rates in o.
Fig. 4
Fig. 4. Mutation burden and spectrum associated with incremental MMR mutations in PDOs.
a, Macropicture of sampled excision specimen, tumor regions one to five indicated. The inset shows the corresponding H&E-stained tumor section. b, Cartoon showing clonal PDO derivation strategy. Bulk samples were briefly expanded and subcloned at passage 1. Individual clonal organoids were expanded and genotyped at passage 4 (15× WGS). c, Neighbor-joining tree showing lineage relationships of bulk and clonal organoids. Tree labels refer to sample names, where N indicates normal tissue and Ca indicates cancer tissue. d, Homopolymer genotyping confirms the allelic status of MMR homopolymers as shown. e, Cartoon extended culture mutation accumulation experiment (see ‘Mutation burden and spectrum in patient-derived organoids (PDOs)’ for details). f, Variant allele fraction density distribution shows symmetric binomial distribution around 0.5 confirming single cell origin. g, InDel burden across MMR PDO genotypes (MLH1−/− (n = 4), MLH1−/−/MSH2+/− (n = 4), MLH1−/−/MSH3+/− (n = 4) and MLH1−/−/MSH3−/−/MSH6+/ (n = 6)) after 8 weeks of extended culture (two-sided Welch’s t-test). h, Homopolymer population diversity is shown as proportional VAF for each homopolymer length across genotypes analyzed at t = 1 (black) and t = 2 (pink) for the MSH2 A7, MSH3 A8 and MSH6 C8 homopolymers. Beige shows reference length and gray shows alternate alleles (two-tailed Fisher’s exact test). NS, not significant.
Fig. 5
Fig. 5. MSH6F1088fs and MSH3K383fs homopolymer frameshift mutations accelerate clonal HLA diversity at the cost of increased neoantigen burden and immune cell infiltration.
a, Workflow for integrating MMRd clonal architecture, LCM sampling and MIF experiments. b, ORION workflow developed to investigate immune cell infiltration in MSH6-proficient and MSH6-deficient tumor subclones. c, Example segmented MIF image showing the interface between MSH6-proficient and MSH6-deficient subclones. MIF dataset consisted of n = 26 independent tumors. d–g, Infiltration levels of CD8-pos (d), CD20-pos (e), CD4-pos (f) and FOXP3-pos (g) immune cells within 100 μm radius of MSH6-proficient or MSH6-deficient tumor cells. h, Median CD8 infiltration levels in MSH6-proficient and MSH6-deficient subclones of individual tumors. i, CD8 count against total mutation burden according to MSH6F1088fs and MSH3K383fs mutation status. Color scheme as before. j, Neoantigen burden in samples according to MSH6F1088fs and MSH3K383fs mutation status. k, Shannon population diversity of length 8 homopolymers against total mutation burden according to MSH6F1088fs and MSH3K383fs mutation status. Color scheme as before. l, Shannon population diversity of length 8 homopolymers according to MSH6F1088fs and MSH3K383fs mutation status. m, Frequency of HLA class I mutations per sample according to MSH6F1088fs and MSH3K383fs mutation status (Polysolver package). n, Density plot showing fraction of neoantigens according to CCF in samples grouped according to MSH6F1088fs and MSH3K383fs status. o, Percentage of clonal versus subclonal neoantigens in samples grouped according to MSH6F1088fs and MSH3K383fs status. p, Immune dN/dS scores according to MSH6F1088fs and MSH3K383fs mutation status.
Fig. 6
Fig. 6. Mathematical model of the effect of stochastic mutation rate switching on tumor growth.
a, The model captures early tumor growth (from 100 to 100,000 cells) using a stochastic birth–death process. Tumor cells can either die or proliferate according to their overall fitness and accumulate new mutations during cell division, which may affect their fitness value. Fitness is codetermined by the lineage-specific burden of stochastically accumulated neoantigens and the prevailing immune selection. Cells can either be in a basal MMRd hypermutated state or in a higher mutation rate regime. The probability of switching between µbasal and µhigh is given by the switch rate β, where β = 0 corresponds to mutation rates that remain constant and β = 0.01 represents frequent switching to or from the higher mutation rate regime. The shade and outline color of each circle (cell) represent that cell’s fitness and mutation rate, respectively (for further details of the model and parameter choice, see Methods). b, Six simulated tumor growth trajectories. Five eliminated lineages are indicated in light gray, one surviving lineage in dark gray with the number of immune-escaped cells within the tumor shown in red (overlapping the dark gray curve). Pie charts indicate the proportion of tumor cells with basal (blue) and higher (pink) mutation rates. c, Shannon diversity of an MS locus in simulated tumors (n = 50) with varying starting mutation rate and switching rate. d, Tumor growth time (in arbitrary units) between establishing immune escape and reaching detectable size (the model in b), computed from 100 simulated tumors with starting mutation rate μ = 120 mutations/division at increasing lethal mutation frequency (left to right) and mutation rate switching rate (x axis). The P value of a two-sided Wilcoxon test comparing β = 0 and β = 0.02 is reported on top of each panel in c and d. e, Average (over 50 replicates) number of eliminated lineages per ten surviving lineages as a function of selection strength, in tumors with no (= 0, blue) and frequent (= 0.02, pink) mutation rate switching. Three independent repeats of simulation and averaging are indicated by circles, triangles and squares. Boxplots: horizontal black line represents median. Lower and upper hinges represent first and third quartiles. Lower and upper whiskers extend to values up to 1.5× interquartile range from the hinge. Outlying points beyond the whisker are plotted individually.
Fig. 7
Fig. 7. Phylogenetic trees reveal MSH6 homopolymer frameshift reversion events.
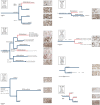
a, Cartoon showing workflow for phylogenetic reconstruction. Multiregion whole-exome sequencing data from MSH6-proficient and MSH6-deficient microdissected patches (n = 22 tumors, between two and six patches per patient) are used to generate a binary SNV matrix to infer phylogenies using the maximum parsimony method (PAUP package). Scale bars indicate branch length and evolutionary distance expressed as substitution burden. The read length distribution of the MSH6 and MSH3 homopolymers is plotted separately (MSIsensor package) and compared against the reference MSH6 and MSH3 IHC of the input sample for verification. Finally, MSH6 labeling is overlaid on the phylogeny to reconstruct homopolymer evolution. bd, Maximum parsimony phylogenetic trees were reconstructed using SNV mutation data with cases UCL_1016 (b), UCL_1002 (c) and UCL_1018 (d) displayed. Branch length is proportional to the number of mutations. Inset shows clinicopathological characteristics. Branches are colored according to MSH6 IHC labeling, with blue indicating MSH6-proficient and pink indicating MSH6-deficient lineages. High-power photomicrographs show MSH6, MSH3 and MSH2 labeling as indicated. Dashed lines indicate the border between proficient and deficient labeling; asterisk indicates the absence of labeling throughout; arrowheads indicate small reverter clones throughout. Trees are labeled with pertinent immune escape mutations. MS length distribution shows MSIsensor output where peak height is proportional to allelic frequency, with beige indicating reference C8 or A8 length, dark gray indicating expanded or contracted alleles and red indicating +3 frameshift. Phylogenetic trees were generated for all n = 10 tumors (Extended Data Fig. 10). Yo, year old.
Fig. 8
Fig. 8. Model illustrating genomic evolutionary trajectories to immune escape in MMRd cancer.
Incremental MMR mutations diversify cellular mutation rate and redirect mutation bias, which expands accessible genotype space and increases population diversity, allowing natural selection to pick immune-adapted variants.
Extended Data Fig. 1
Extended Data Fig. 1. Mutation burden is increased in presence of incremental MSH6F1088fs and MSH3K383fs across cohorts.
(ac) Genomics England MSI CRC cohort subset for cases with confirmed MutL (MLH1/PMS2) loss as primary cause of MMRd. Violin plots show SNV (a), InDel (b) and total mutation burden (c) in tumors according to presence of secondary MSH6F1088 and MSH3K383 frameshifts. (dj) TCGA MSI validation cohort. (df) Violin plots display SNV (d), InDel (e) and total mutation burden (f) according to presence of secondary MSH6F1088 and MSH3K383 frameshifts. (g,h) RNA expression of MSH6 (g) and MSH3 (h) is reduced in tumors with MSH6 and MSH3 frameshifts, respectively. Two-sided Wilcoxon test reported. (i) Neoantigen burden according to MSH6F1088 and MSH3K383 frameshifts. (j) Number of tumors according to tumor type making up the TCGA MSI cohort. UCEC = uterine corpus endometrial carcinoma, STAD = stomach adenocarcinoma, CRC = colorectal adenocarcinoma and ESO = esophageal adenocarcinoma. Boxplots: horizontal black line represents median. Lower and upper hinges represent 1st and 3rd quartiles. Lower and upper whiskers extend to values up to 1.5× interquartile range from the hinge.
Extended Data Fig. 2
Extended Data Fig. 2. MSH6 immunolabeling reveals nested proficient reversion subclones within deficient regions.
(a) Summary table for the cohort of n = 546 consecutive CRCs used in this study. (b) Representative MMR IHC of polypoid tumor with complete loss of MLH1/PMS2 and subclonal loss of MSH6. High-power detail image shows islands of MSH6 reversion (arrowheads, bottom right panel) within MSH6-deficient subclone. (c) Breakdown of the pattern of MMR protein loss in n = 88 MMRd tumors. n = 32 tumors had subclonal MSH6 loss, and the estimated percentage of deficient tumor cells observed is displayed in the heatmap. (d) n = 3 example tumors with MSH6 subclonal loss. For each tumor H&E staining overview, MSH6 immunohistochemistry overview, IHC segmentation (red is MSH6-proficient, blue is MSH6-deficient and green is stroma) and detail images are shown.
Extended Data Fig. 3
Extended Data Fig. 3. Extended data for UCL colorectal cancer cohort mutation bias and burden plots.
(a) Mutation bias on a per sample basis with absolute numbers of each mutation type. (b) Proportions of SNVs and InDels per mutation group. (c) Mutation burden according to MSH6 allelic status.
Extended Data Fig. 4
Extended Data Fig. 4. Patient-derived organoids mutation clustering.
(a) Heatmap and unsupervised clustering of patient-derived organoids, both bulk and clonally derived samples. The first three columns from the left are normal mucosal samples (labeled ‘normal’), and the remainder are tumor samples (labeled ‘tumor PDOs’).
Extended Data Fig. 5
Extended Data Fig. 5. Patient-derived organoids validation.
(a) Sections of the mirror block to the tumor block shown in Fig. 4a, inset. Left columns show low power overview, and right columns show high-power detail photomicrographs. Rows show H&E, MLH1, PMS2, MSH2, MSH6 and MSH3. MLH1 and PMS2 show no labeling throughout the tumor bed, as expected. MSH2 is retained throughout. MSH6 shows several small foci of loss (example dashed region shown), and MSH3 shows two larger clones which show complete loss of labeling (dashed regions). PDO genotyping confirms biallelic MSH3 homopolymer InDels, n = 1 for all immunohistochemistry. (b) MSH3 immunofluorescence comparing immunolabeling in MLH1−/− MSH3+/+, MLH1−/− MSH3+/− and MLH1−/− MSH3−/− PDOs. For each MSH3 genotype, 230 cells were measured from 30 organoids (2 replicates of 15 organoids/condition per IF round). Nuclear intensity counts show a stepwise decrease (one-way ANOVA, MSH3+/+ vs MSH3+/−: 8,74546E-16, MSH3+/− vs MSH3−/−: 3,55818E-88, and MSH3+/+ vs MSH3−/−: 2,8033E-103). Nb. Plasma membrane labeling is background. (c) InDel mutation bar chart showing frequency of indicated InDels across PDO genotypes. Barplot represents all InDels accumulated over the course of 8 weeks per genotype (MLH1−/−, n = 4; MLH1−/− MSH2+/−, n = 4; MLH1−/− MSH3+/−, n = 4; MLH1−/− MSH3−/− MSH6+/−, n = 6). Error bars show SD of the mean, two-way ANOVA (* p < 0.05, ** p < 0.01, *** p < 0.001, **** p < 0.0001).
Extended Data Fig. 6
Extended Data Fig. 6. ORION (FluOResence cell segmentatION) workflow.
(a) Multiplex IF image of example tumor labeled for MSH6, pan-CK, CD8, CD4, CD20 and FOXP3. (b) Isolation of MSH6, CD20, FoxP3, CD4 and CD8 spectral signals. (c) Example of the ORION main workflow steps. The workflow includes locally adaptive thresholding of isolated spectral signals, estimation of distance maps and local maxima, ellipsoidal modeling of cells and Bayesian classification for the identification of cells. Neighborhood analysis is used for the identification of tumor–immune interactions estimating the number of immune cells within radius R of each MSH6-proficient or deficient tumor cell (shown in b_6). ORION workflow was performed in n = 26 tumors producing n = 194 imaged tiles. (d,f,h,j) Immune infiltration levels for CD8 (d), CD20 (f), CD4 (h) and FOXP3 (j) cells in tumors per imaged tile. (e,g,i,k) Data presented with MSH6-proficient and deficient tiles from the same tumor were presented as separate plots side by side. Dots are colored according to MSH6 expression status of tumor in the imaged tile. In total, n = 194 multispectral imaged tiles were assessed across 26 independent tumors. Boxplots: horizontal black line represents median. Lower and upper hinges represent 1st and 3rd quartiles. Lower and upper whiskers extend to values up to 1.5× interquartile range from the hinge.
Extended Data Fig. 7
Extended Data Fig. 7. Microsatellite diversity in tumor samples according to homopolymer length and neoantigen analysis.
(a) Cartoon illustrating microsatellite (MS) length diversity analysis. We hypothesized that increasing clonal mutation burden would be reflected in increasing clonal diversity. In this analysis, microsatellites are used as lineage tags to interrogate population structure. MSH6F1088fs and MSH3K383fs frameshift status from left to right and seven arbitrary homopolymers from top to bottom. Plots show read count for each microsatellite length, beige is the wild-type reference allele and gray are deviations from the reference. Cartoon shows progressive population heterogeneity with MSH6F1088fs and MSH3K383fs frameshifts. (b,c) Homopolymer length (b) versus Shannon microsatellite diversity (c) in samples grouped according to MSH6 and MSH3 frameshift status. MSH6F1088fs and MSH3K383fs frameshifts result in increased microsatellite diversity, but effect size decreases at longer homopolymer lengths. Asterisks indicate significance according to two-sided Wilcoxon test (* p < 0.05, ** p < 0.005) (d,e) No correlation between Shannon MS diversity and tumor purity or median microsatellite read depth. Gray shaded error band represents 95% confidence interval for linear regression line. (f,g) No difference in tumor purity (f) or read depth at microsatellite (g) sites between samples according to MSH6/MSH3 grouping. (h) Counts for neoantigens predicted to escape NMD in samples grouped according to MSH6F1088fs and MSH3K383fs mutation status. (i) Bar chart shows counts of validated immunogenic neoantigens across groups (see list Supplementary Table 9 for a list of validated neoantigens). Cyan shows validated neoantigens that are predicted to escape nonsense-mediated decay, and pink shows validated neoantigens that are not predicted to escape nonsense-mediated decay.
Extended Data Fig. 8
Extended Data Fig. 8. Extended data for mathematical model of stochastic mutation rate switching.
(a) Number of lineages eliminated per 10 surviving lineages, computed from n = 100 simulated tumors at increasing immune selection (left to right) and switching rate (x axis). Tumors are initiated with μ = 6 mutations/division. (b) Number of lineages eliminated per 10 surviving lineages, computed from n = 100 simulated tumors at increasing selection rate (left to right) and mutation rate switching rate (x axis). Tumors are initiated with μ = 120 mutations/division. (c) Tumor growth time (in arbitrary units) between establishing immune escape and reaching detectable size, computed from n = 100 hypermutated simulated tumors at increasing lethal mutation rate (left to right) and mutation rate switching rate (x axis). The p-value of a two-sided Wilcoxon test comparing β = 0 and β = 0.02 is reported on each panel. Boxplots: horizontal black line represents median. Lower and upper hinges represent 1st and 3rd quartiles. Lower and upper whiskers extend to values up to 1.5× interquartile range from the hinge. Outlying points beyond the whisker are plotted individually.
Extended Data Fig. 9
Extended Data Fig. 9. Microsatellite length distribution heatmap and MSH6 IHC.
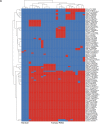
(a,b) Microsatellite length distribution heatmap for the MSH6 C8 (a) and MSH3 A8 (b) homopolymers in all samples from UCL WXS cohort (n = 49). (c,d) MSH6 IHC for cases shown in main Fig. 7 (n = 2 independent tumors). (c) Tumor UCL_1002 and (d) tumor UCL_1018.
Extended Data Fig. 10
Extended Data Fig. 10. Extended data for phylogenetic trees.
Phylogenetic trees not shown in main figure 7 included here. Phylogenetic trees were generated for all n = 10 tumors (see also Fig. 7).

References

    1. Kunkel TA, Erie DA. DNA mismatch repair. Annu. Rev. Biochem. 2005;74:681–710. - PubMed
    1. De Wind N, et al. HNPCC-like cancer predisposition in mice through simultaneous loss of Msh3 and Msh6 mismatch-repair protein functions. Nat. Genet. 1999;23:359–362. - PubMed
    1. Sanders, M. A. et al. Life without mismatch repair. Preprint at bioRxiv10.1101/2021.04.14.437578 (2021).
    1. Fang H, et al. Deficiency of replication-independent DNA mismatch repair drives a 5-methylcytosine deamination mutational signature in cancer. Sci. Adv. 2021;7:eabg4398. - PMC - PubMed
    1. Zou X, et al. A systematic CRISPR screen defines mutational mechanisms underpinning signatures caused by replication errors and endogenous DNA damage. Nat. Cancer. 2021;2:643–657. - PMC - PubMed