. 2024 Jul 1;15(1):5537.
doi: 10.1038/s41467-024-49852-3.

Environmental circadian disruption re-writes liver circadian proteomes

Affiliations

Environmental circadian disruption re-writes liver circadian proteomes

Hao A Duong et al. Nat Commun. .

Abstract

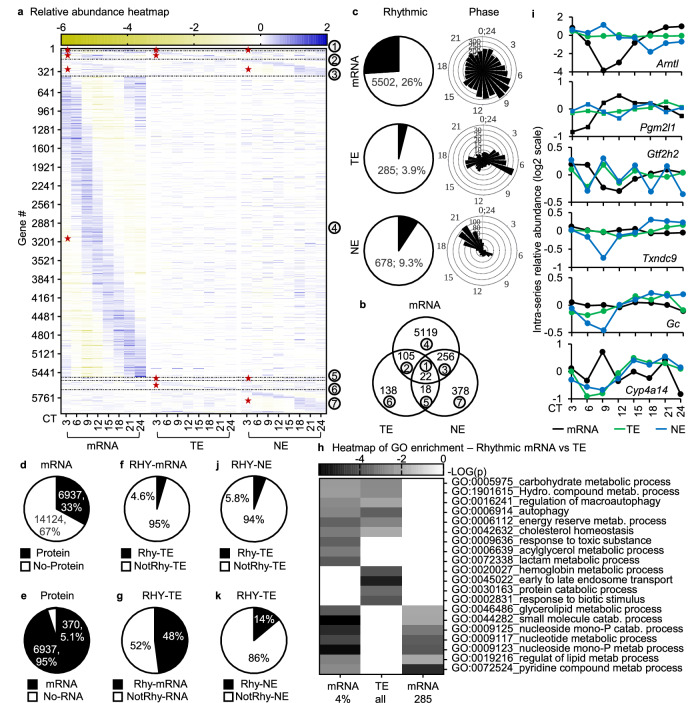
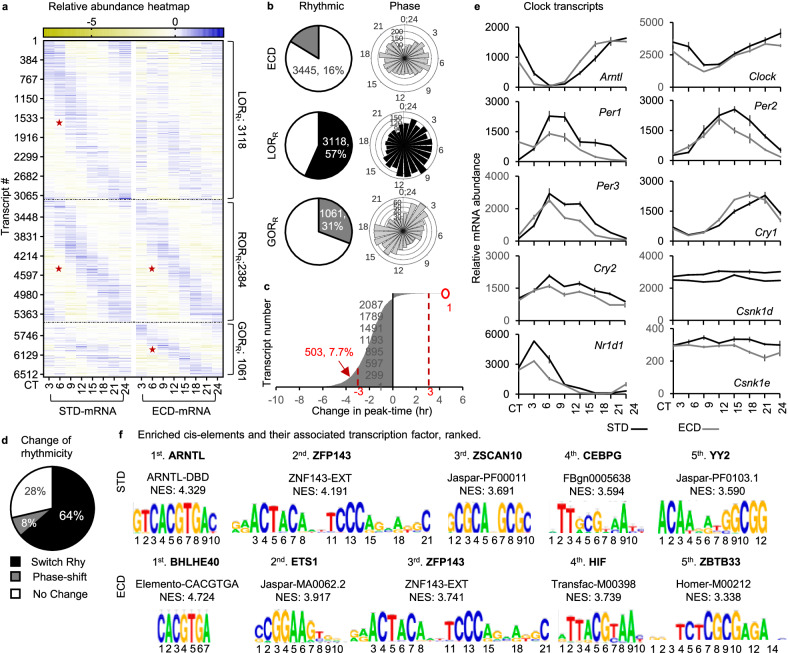
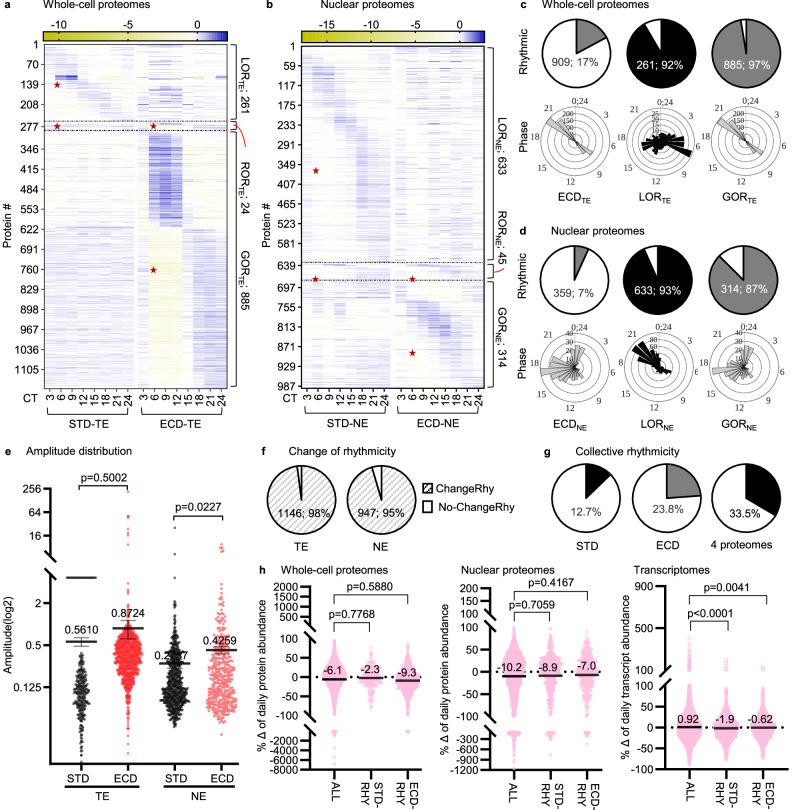
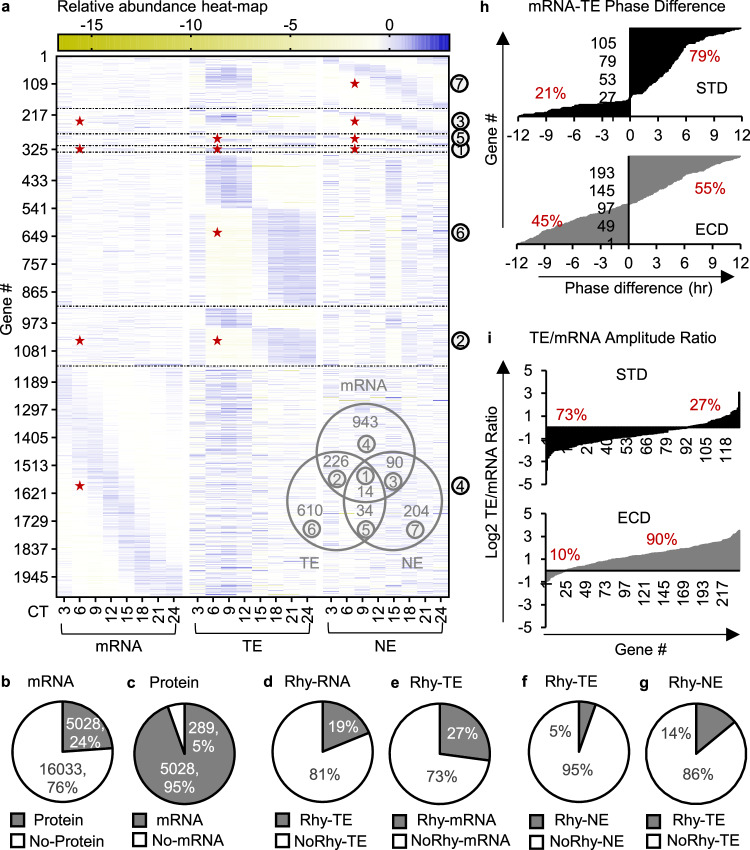
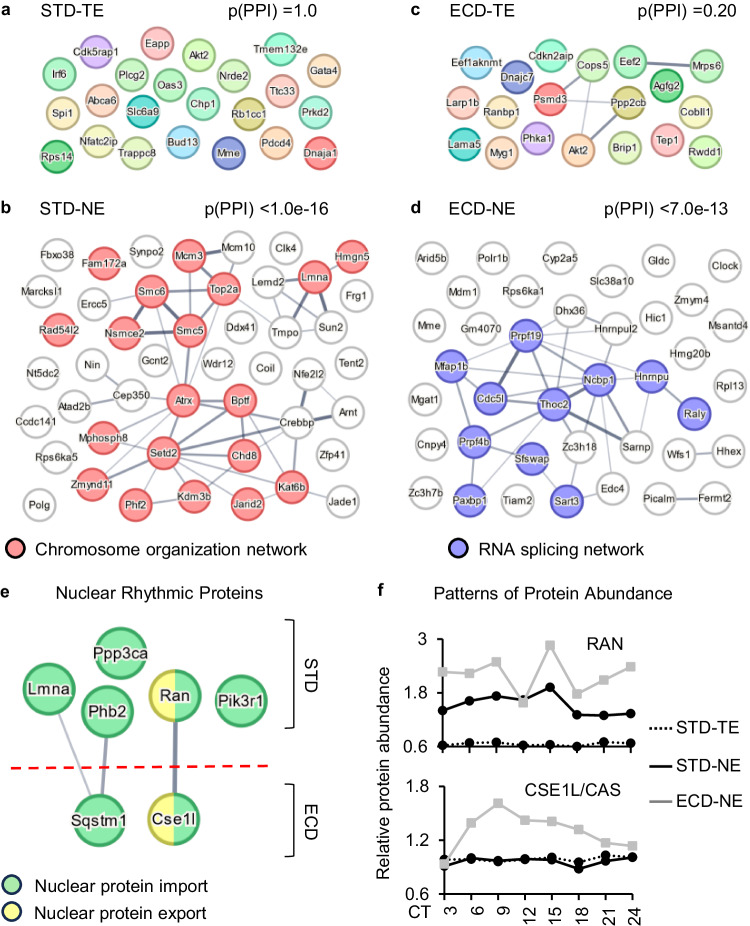
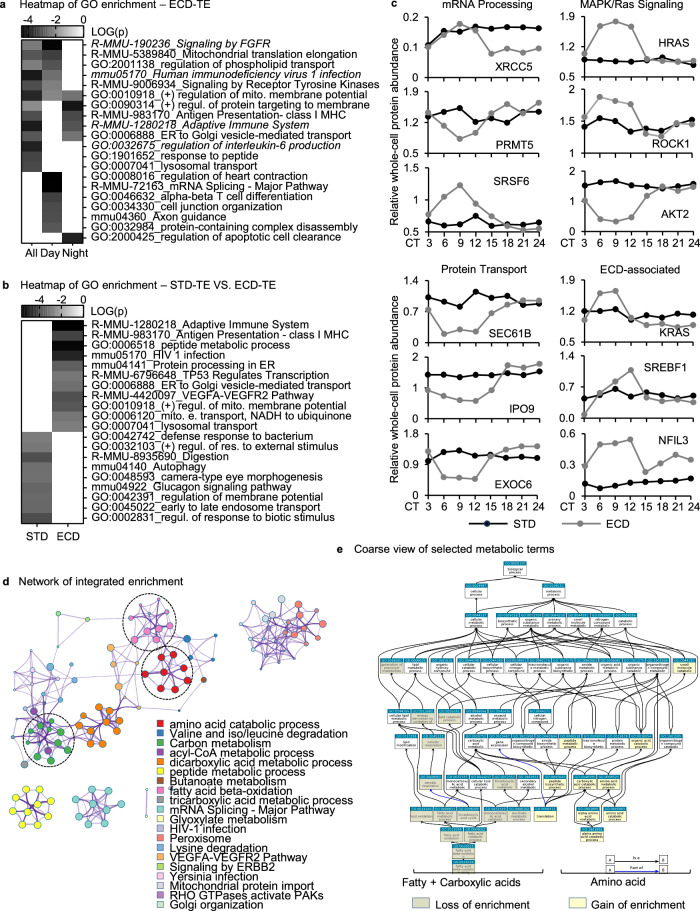
Circadian gene expression is fundamental to the establishment and functions of the circadian clock, a cell-autonomous and evolutionary-conserved timing system. Yet, how it is affected by environmental-circadian disruption (ECD) such as shiftwork and jetlag are ill-defined. Here, we provided a comprehensive and comparative description of male liver circadian gene expression, encompassing transcriptomes, whole-cell proteomes and nuclear proteomes, under normal and after ECD conditions. Under both conditions, post-translation, rather than transcription, is the dominant contributor to circadian functional outputs. After ECD, post-transcriptional and post-translational processes are the major contributors to whole-cell or nuclear circadian proteome, respectively. Furthermore, ECD re-writes the rhythmicity of 64% transcriptome, 98% whole-cell proteome and 95% nuclear proteome. The re-writing, which is associated with changes of circadian regulatory cis-elements, RNA-processing and protein localization, diminishes circadian regulation of fat and carbohydrate metabolism and persists after one week of ECD-recovery.


Conflict of interest statement

The authors declare no competing interests.

Figures

Fig. 1
Fig. 1. A topography of circadian gene expression in mouse liver.
a, b Relative-abundance heatmap (normalized to series average; log2 scale) of rhythmic transcripts (mRNA), rhythmic whole-cell proteins (TE) and rhythmic nuclear proteins (NE) (a), and the Venn diagram of their overlaps (b). c Percentages of rhythmic time series and their phase distribution of transcripts, whole cell proteins and nuclear proteins. dg Percentage of transcripts with or without proteins (d), proteins with or without transcripts (e), rhythmic transcripts with or without rhythmic whole-cell proteins, (f) rhythmic whole-cell proteins with or without rhythmic transcripts (g) in the 6937 sub-population. h Comparative functional enrichment analysis of highest 285 or 4% rhythmic transcripts vs. whole-cell circadian proteome (285 proteins). i Examples of differential transcript, whole-cell protein and nuclear circadian patterns. j, k Percentages of rhythmic whole-cell proteins with or without rhythmic nuclear proteins (j), or rhythmic nuclear proteins with or without rhythmic whole-cell proteins (k) in the 6937 sub-population. TE—total extract; NE—nuclear extract; RHY—rhythmic; Red star—rhythmic portion; Number in circle—corresponding groups between (a) and (b).
Fig. 2
Fig. 2. ECD re-writes rhythmicity of 4179 transcripts.
a Relative abundance heatmap (normalized to series average; log2 scale) of rhythmic transcripts in 21061 transcripts that were quantified under both standard (STD) and ECD conditions, grouping as rhythmic under STD but not under ECD (LORR), not rhythmic under STD but rhythmic under ECD (GORR) or rhythmic under both STD and ECD (RORR). b Percentages of rhythmic transcript time series and the corresponding phase distribution of transcripts that are either rhythmic under ECD, LORR or GORR. c The distribution of phase shifts in the RORR population between ECD and STD. d Percentages of transcripts that switch their rhythmicity in response to ECD. e Comparative abundance of core clock transcripts under STD and ECD throughout a circadian cycle as quantified by RNA-seqs. Data are presented as mean values ± SEM of 3 biological replicates. f Weight matrix of enriched cis-elements within 20 kb upstream of either STD or ECD rhythmic transcripts ranked by Normalized Enrichment Score (NES) and their associated transcription factors; Red star—rhythmic portion.
Fig. 3
Fig. 3. ECD re-writes rhythmicity of circadian whole-cell (TE) and nuclear (NE) proteomes.
a, b Relative-abundance heatmap (normalized to series average; log2 scale) of rhythmic proteins in whole-cell (a) or nuclear (b) proteomes under ECD in comparison with STD. c, d Percent rhythmic protein time series and the corresponding phase distribution of proteins that either loss rhythmicity (LOR), retain rhythmicity (ROR) or gain rhythmicity (GOR) in the whole-cell (TE) (c) or nucleus (NE) (d) circadian proteomes. e Comparative amplitude of all 4 circadian proteomes (log2 scale). f Percent of all proteins that change their rhythmicity at the whole-cell or nuclear compartment levels. g Estimate percentages of rhythmic proteins, collectively. h Comparative distribution of change in cumulative daily abundance of whole-cell proteomes, nuclear proteomes or transcriptomes in response to ECD between all, STD rhythmic and ECD rhythmic populations. For (e, h), data are presented as population average ± SEM, with each dot being a member of the population. The p-values of (e, h) were derived from unpaired 2-tailed t test. Red star—rhythmic portion. See also Supplemental Fig. 4.
Fig. 4
Fig. 4. Contributions of post-transcription and post-translation in circadian gene expression under ECD.
a Relative abundance heatmap (log2) of rhythmic transcripts, rhythmic whole-cell protein and rhythmic nuclear proteins in 5028 genes of which both transcript and protein were quantified under ECD. Venn diagram shows overlaps between each population shown in (a). (b, c) Percentages of transcripts with or without proteins and vice versa. d, e Percentages of rhythmic transcripts with or without rhythmic whole-cell proteins and vice versa. f, g Percentages of rhythmic whole-cell proteins with or without rhythmic nuclear proteins and vice versa. h Percentage of genes with the phase of transcript leads or lags the phase of whole-cell protein under STD or ECD. i Percentages of genes with the amplitude of whole-cell protein rhythms is lower or higher than that of the corresponding transcript rhythms under STD or ECD; Red star—rhythmic portion; Number in circle—corresponding groups between heatmap and Venn diagram in (a).
Fig. 5
Fig. 5. Association of nuclear protein import/export with nuclear circadian proteomes.
ad Functional protein interaction network analysis of NLS/NES-containing proteins that are rhythmic only at the whole-cell level (a, c) or in the nuclear compartment (b, d) under STD (a, b) or ECD (c, d) condition, using STRING algorithm. Line thickness is proportional to strength of evidence for the interaction. e PNIE-implicated proteins that are rhythmic in the nuclear compartment under STD or ECD. f Comparative protein abundance of RAN or CAS at the whole-cell and nuclear compartment level under STD and ECD throughout a circadian cycle. NLS/NES—nuclear localization/export sequence; PNIE—protein nuclear import/export process. PPI—protein-protein interaction network.
Fig. 6
Fig. 6. Comparative functional G.O. enrichment analyses.
a, b Heatmap of G.O. enrichment analysis of (a) ECD whole-cell rhythmic proteins peaking during day-time, night-time or both, (b) whole-cell circadian proteome under ECD in comparison with STD. c Comparative whole-cell protein abundance throughout a circadian cycle of representative factors in mRNA processing, RTK/Ras signaling, protein transport and ECD-associated under STD versus ECD conditions. d Reactome enrichment analysis of (b). e G.O. Slim map of changes in enrichment of terms related to fatty acid, carboxylic acid and amino acid, as circled in (d), in response to ECD. A replicate of (e) with bigger font could be found in Supplemental Fig. S5. Italic—known ECD-associated pathways, direct term or child term.

Update of

References

    1. Patke A, Young MW, Axelrod S. Molecular mechanisms and physiological importance of circadian rhythms. Nat. Rev. Mol. Cell Biol. 2019;21:67–84. doi: 10.1038/s41580-019-0179-2. - DOI - PubMed
    1. Lowrey, P. L. & Takahashi, J. S. Genetics of the mammalian circadian system: Photic entrainment, circadian pacemaker mechanisms, and posttranslational regulation. Annu. Rev. Genet.10.1146/annurev.genet.34.1.533 (2000). - PubMed
    1. Dunlap JC. Molecular bases for circadian clocks. Cell. 1999;96:271–290. doi: 10.1016/S0092-8674(00)80566-8. - DOI - PubMed
    1. Sanchez, S. E. & Kay, S. A. The plant circadian Clock: from a simple timekeeper to a complex developmental manager. Cold Spring Harb. Perspect. Biol.8 (2016). - PMC - PubMed
    1. Pallesen S, Bjorvatn B, Waage S, Harris A, Sagoe D. Prevalence of shift work disorder: a systematic review and meta-analysis. Front. Psychol. 2021;12:652. doi: 10.3389/fpsyg.2021.638252. - DOI - PMC - PubMed

LinkOut - more resources