. 2024 Jan-Dec;16(1):2374607.
doi: 10.1080/19420862.2024.2374607. Epub 2024 Jul 2.

Early determination of potential critical quality attributes of therapeutic antibodies in developability studies through surface plasmon resonance-based relative binding activity assessment

Affiliations

Early determination of potential critical quality attributes of therapeutic antibodies in developability studies through surface plasmon resonance-based relative binding activity assessment

Shuai Wang et al. MAbs. 2024 Jan-Dec.

Abstract

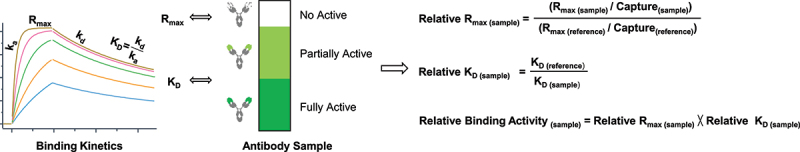
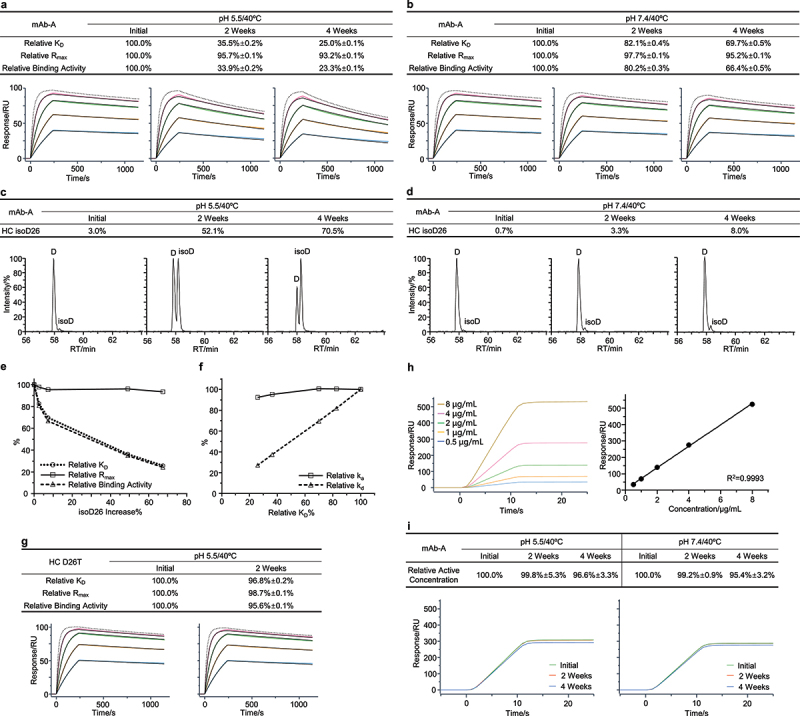
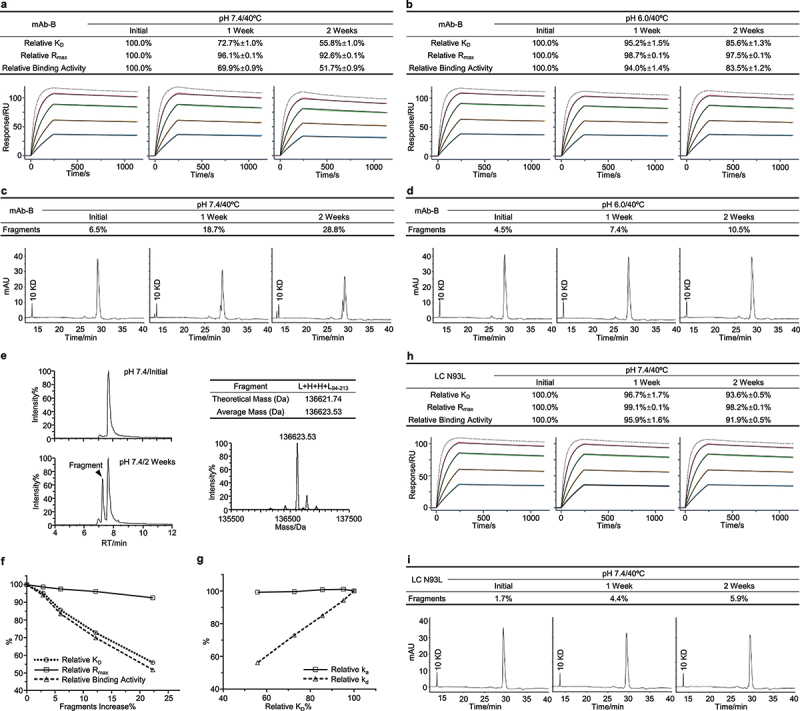
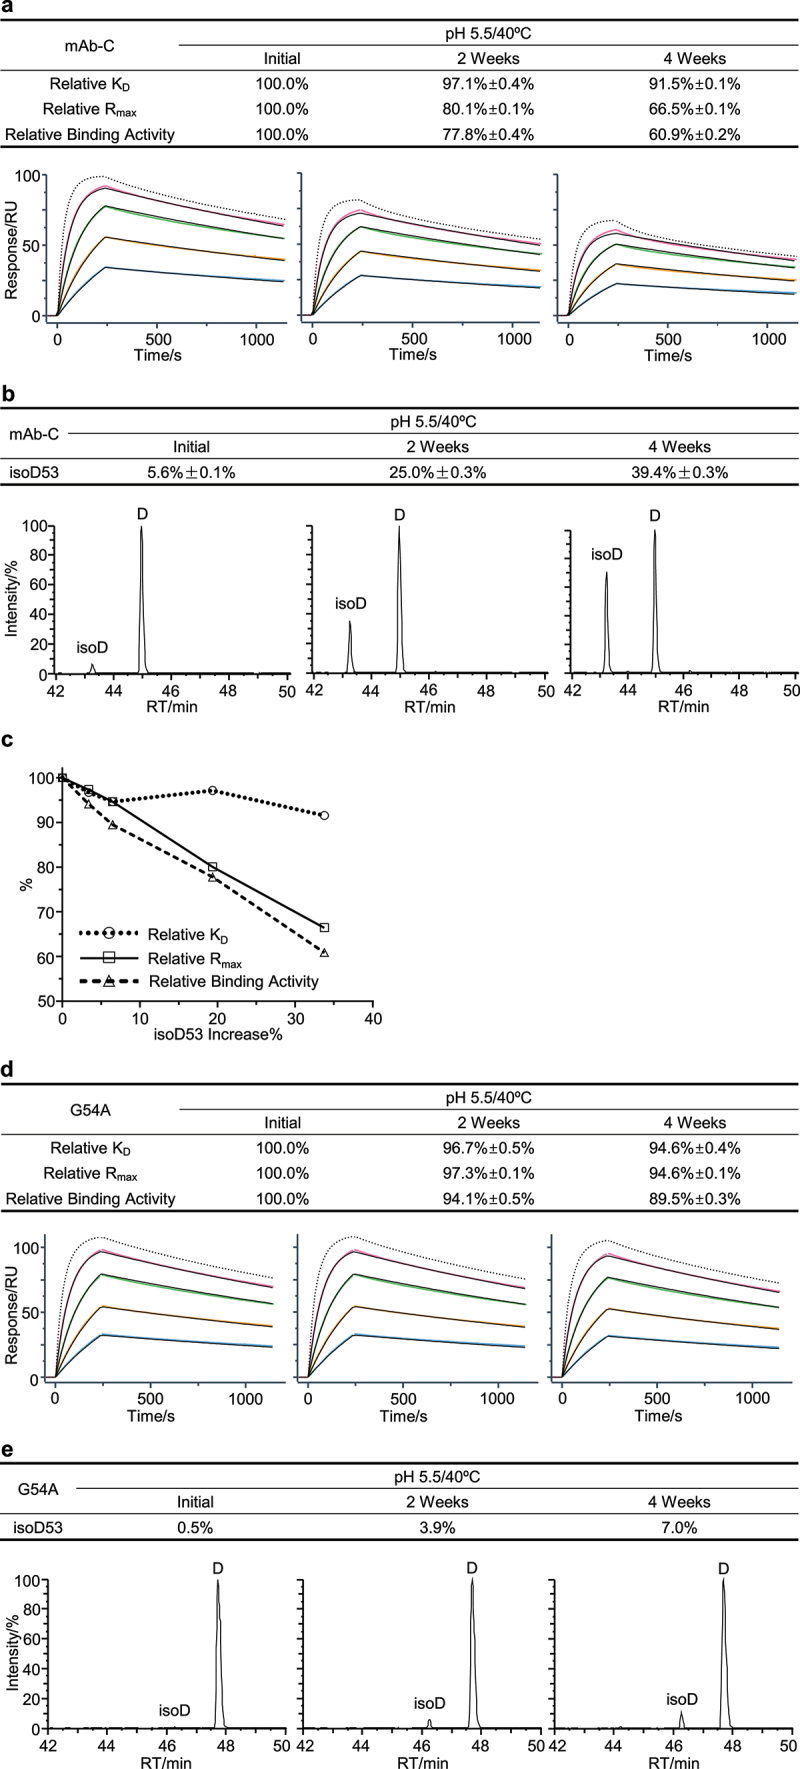
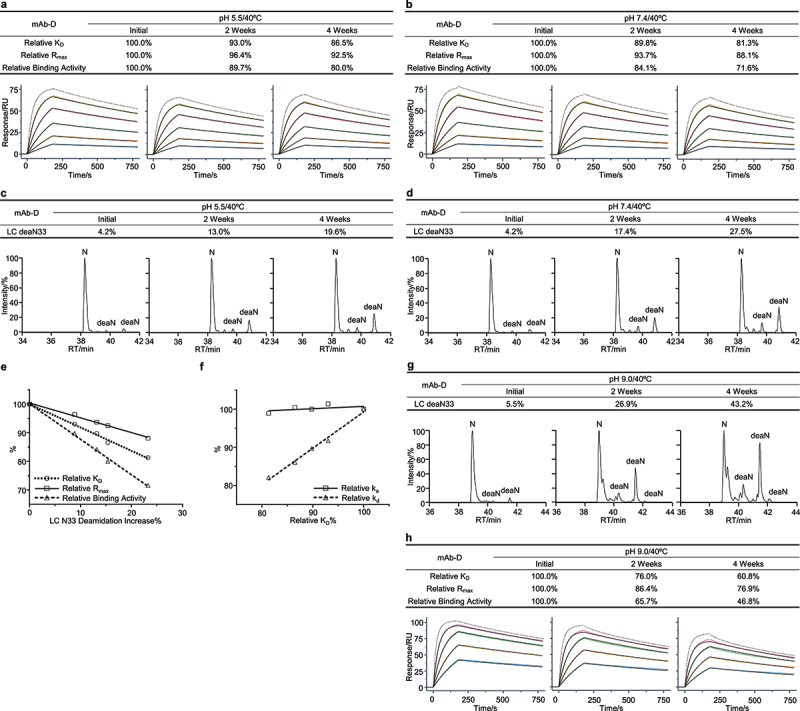
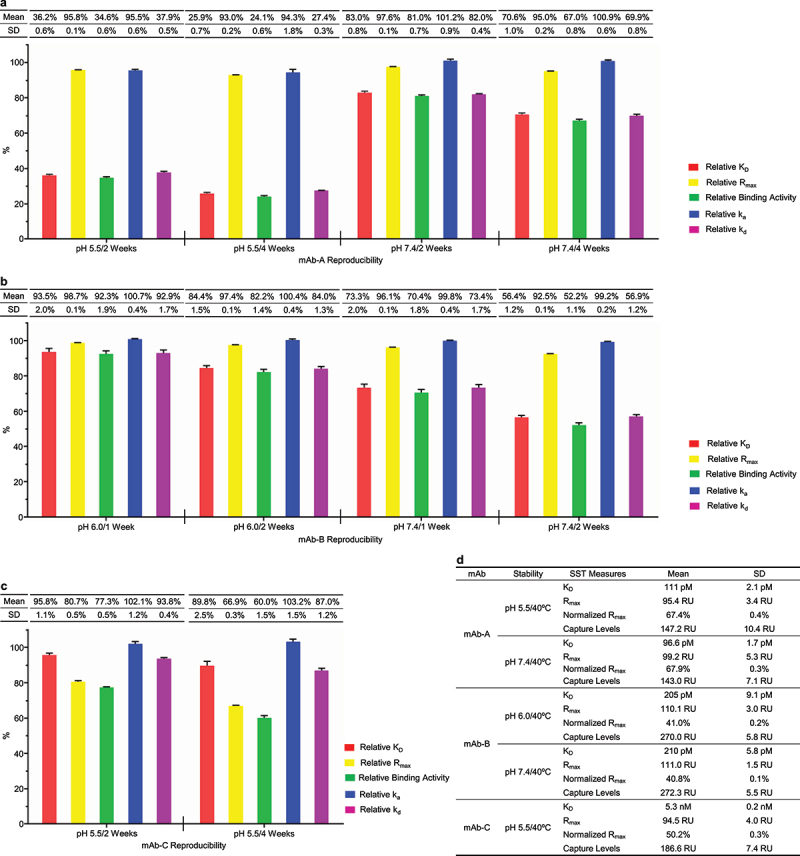
Precise measurement of the binding activity changes of therapeutic antibodies is important to determine the potential critical quality attributes (CQAs) in developability assessment at the early stage of antibody development. Here, we report a surface plasmon resonance (SPR)-based relative binding activity method, which incorporates both binding affinity and binding response and allows us to determine relative binding activity of antibodies with high accuracy and precision. We applied the SPR-based relative binding activity method in multiple forced degradation studies of antibody developability assessment. The current developability assessment strategy provided comprehensive, precise characterization of antibody binding activity in the stability studies, enabling us to perform correlation analysis and establish the structure-function relationship between relative binding activity and quality attributes. The impact of a given quality attribute on binding activity could be confidently determined without isolating antibody variants. We identified several potential CQAs, including Asp isomerization, Asn deamidation, and fragmentation. Some potential CQAs affected binding affinity of antibody and resulted in a reduction of binding activity. Certain potential CQAs impaired antibody binding to antigen and led to a loss of binding activity. A few potential CQAs could influence both binding affinity and binding response and cause a substantial decrease in antibody binding activity. Specifically, we identified low abundance Asn33 deamidation in the light chain complementarity-determining region as a potential CQA, in which all the stressed antibody samples showed Asn33 deamidation abundances ranging from 4.2% to 27.5% and a mild binding affinity change from 1.76 nM to 2.16 nM.

Keywords: Antibody development; critical quality attribute; developability assessment; forced degradation; relative binding activity; surface plasmon resonance; therapeutic antibody.


Conflict of interest statement

No potential conflict of interest was reported by the author(s).

Figures

Figure 1.
Figure 1.
The overview of SPR-based relative binding activity method. An antibody sample can be divided into two major subpopulations from the activity perspective, namely active and not active antibodies, where the active subpopulation comprises partially active and fully active antibodies. In antibody capture binding kinetics analysis, binding affinity (KD) represents antibody binding strength, and maximum binding response (Rmax) reflects antibody binding capacity. Regarding the relative binding activity assessment of a test sample normalized to the reference standard, relative KD reflects relative binding strength of antibodies, and relative Rmax reflects relative binding capacity of antibodies. Thus, the relative binding activity of a test sample is generated by multiplying relative Rmax and relative KD, which characterizes the overall relative binding activity level of a test sample relative to the reference standard.
Figure 2.
Figure 2.
Asp26 isomerization resulted in a significant reduction of binding activity for mAb-A. The mAb-A antibody was exposed to 40°C for 4 weeks in both the slightly acidic pH 5.5 and neutral pH 7.4 buffers. The stability samples were collected at the indicated time points. The relative binding activity was measured under the slightly acidic (a) and neutral (b) stability conditions including relative KD, relative Rmax, and relative binding activity, and then presented as mean ± standard deviation (SD) from three independent experiments, where the dot line binding profiles were not included in the data fitting analysis. The antigen solutions were separately injected at 30, 15, 7.5, 3.75, and 1.875 nM. Peptide mapping was performed. Asp26 isomerization in the heavy chain CDR1 region was identified and presented as the average from two independent tests for the slightly acidic (c) and neutral (d) stability studies. (e) Correlation analysis was performed between the Asp26 isomerization increase and three relative binding activity measures. (f) Correlation analysis was performed between relative ka, relative kd, and relative KD. (g) The D26T mutant was prepared. The thermal stress study was then performed. Similarly, the relative binding activity was measured and presented as mean ± SD from three independent experiments. (h) The classical SPR-based active concentration assay was developed through antigen immobilization followed by the injection of mAb-A stability samples. The binding signals were used to establish a calibration curve for active concentration analysis. (i) On the basis of the calibration curve, relative active concentrations could be calculated for mAb-A stability samples under the slightly acidic and neutral stability conditions and presented as mean ± SD from three independent experiments.
Figure 3.
Figure 3.
Fragmentation resulted in a significant decrease of binding activity for mAb-B. The mAb-B antibody was exposed to 40°C for 2 weeks in both the neutral pH 7.4 and slightly acidic pH 6.0 buffers. The stability samples were collected at the indicated time points. The relative binding activity was measured under the neutral (a) and slightly acidic (b) stability conditions including relative KD, relative Rmax, and relative binding activity, and then presented as mean ± SD from three independent experiments, where the assay concentrations of antigens were 100, 50, 25, 12.5, and 6.25 nM. The dot line binding profiles were not included in the data fitting analysis. The nrCE-SDS was performed. The fragments were measured and presented as the average from two independent tests for the neutral (c) and slightly acidic (d) stability studies. (e) Mass spectrometry was used to monitor the molecular weight of the stability samples. The clipping site was then derived. (f) Correlation analysis was performed between fragments increase and three relative binding activity measures. (g) Correlation analysis was performed between relative ka, relative kd, and relative KD. The N93L mutant was identified. The thermal stability study was then conducted. Similarly, (h) the relative binding activity was determined and presented as mean ± SD from three independent experiments. (i) The fragments were measured by nrCE-SDS.
Figure 4.
Figure 4.
Asp53 isomerization led to a loss of binding activity for mAb-C. (a) The mAb-C antibody was exposed to 40°C for 4 weeks in the slightly acidic pH 5.5 buffer. The stability samples were collected at the indicated time points. The relative binding activity measures were determined including relative KD, relative Rmax, and relative binding activity, and presented as mean ± SD from three independent experiments, where the dot line binding profiles were not included in the data fitting analysis. The antigen solutions were separately injected at 400, 200, 100, 50, and 25 nM. (b) Peptide mapping analysis was performed. Asp53 isomerization in the CDR2 region was identified and presented as mean ± SD from three independent experiments. (c) Correlation analysis was performed between the Asp53 isomerization increase and three relative binding activity measures. The G54A mutant was prepared. The thermal stress testing was then performed. Similarly, (d) the relative binding activity was measured and presented as mean ± SD from three independent experiments. (e) Asp5353 isomerization was determined by peptide mapping analysis.
Figure 5.
Figure 5.
Low abundance Asn33 deamidation was identified as a potential CQA for mAb-D. The mAb-D antibody was exposed to 40°C for 4 weeks in both the slightly acidic pH 5.5 and neutral pH 7.4 buffers. The stability samples were collected at the indicated time points. Relative binding activity measures were determined under the slightly acidic (a) and neutral (b) stability conditions including relative KD, relative Rmax, and relative binding activity, where the antigen concentrations were 100, 50, 25, 12.5, 6.25, and 3.125 nM. The dot line binding profiles were not included in the data fitting analysis. Peptide mapping was performed. Asn33 deamidation in the light chain CDR1 region was identified and quantitated for the slightly acidic (c) and neutral (d) stability studies, where deaN stood for the deamidated asparagine. (e) Correlation analysis was performed between Asn33 deamidation increase and three relative binding activity measures. (f) Correlation analysis was performed between relative ka, relative kd, and relative KD. The mAb-D antibody was incubated in the pH 9.0 buffer at 40°C for 4 weeks. Similarly, (g) Asn33 deamidation was determined by peptide mapping analysis. (h) The relative binding activity was measured using the antigen concentrations from 6.25 to 100 nM.
Figure 6.
Figure 6.
SPR-based relative binding activity method had the potential to become a quality control release assay. SPR-based relative binding activity analysis was performed for five groups of stability samples from mAb-A (a), mAb-B (b), and mAb-C (c) 9 times in approximately 40 days. The five relative binding activity measures, including relative KD, relative Rmax, relative binding activity, relative ka, and relative kd, were presented as mean and SD from nine independent experiments. (d) The SST was established for the five stability studies of mAb-A, mAb-B, and mAb-C. The SST parameters included KD, Rmax, and normalized Rmax for the reference standard, as well as antibody capture levels for all the stability samples. The mean and SD of the SST parameters for the five stability studies were presented.

Similar articles

References

    1. Kaplon H, Crescioli S, Chenoweth A, Visweswaraiah J, Reichert JM.. Antibodies to watch in 2023. Mabs-austin. 2023;15(1):2153410. doi:10.1080/19420862.2022.2153410. PMID:36472472. - DOI - PMC - PubMed
    1. Carter PJ, Lazar GA.. Next generation antibody drugs: pursuit of the ‘high-hanging fruit’. Nat Rev Drug Discov. 2018;17(3):197–14. doi:10.1038/nrd.2017.227. PMID:29192287. - DOI - PubMed
    1. The Antibody Society. Therapeutic monoclonal antibodies approved or in regulatory review. [accessed 2024 June 24]. www.antibodysociety.org/antibody-therapeutics-product-data.
    1. Dimasi JA, Feldman L, Seckler A, Wilson A. Trends in risks associated with new drug development: success rates for investigational drugs. Clin Pharmacol Ther. 2010;87(3):272–77. doi:10.1038/clpt.2009.295. PMID:20130567. - DOI - PubMed
    1. Reichert JM, Rosensweig CJ, Faden LB, Dewitz MC. Monoclonal antibody successes in the clinic. Nat Biotechnol. 2005;23(9):1073–78. doi:10.1038/nbt0905-1073. PMID:16151394. - DOI - PubMed

Substances

LinkOut - more resources