

A Continuous Intestinal Absorption Model to Predict Drug Enterohepatic Recirculation in Healthy Humans: Nalbuphine as a Model Substrate
- PMID: 38956965
- PMCID: PMC11999028
- DOI: 10.1021/acs.molpharmaceut.4c00424
A Continuous Intestinal Absorption Model to Predict Drug Enterohepatic Recirculation in Healthy Humans: Nalbuphine as a Model Substrate
Abstract
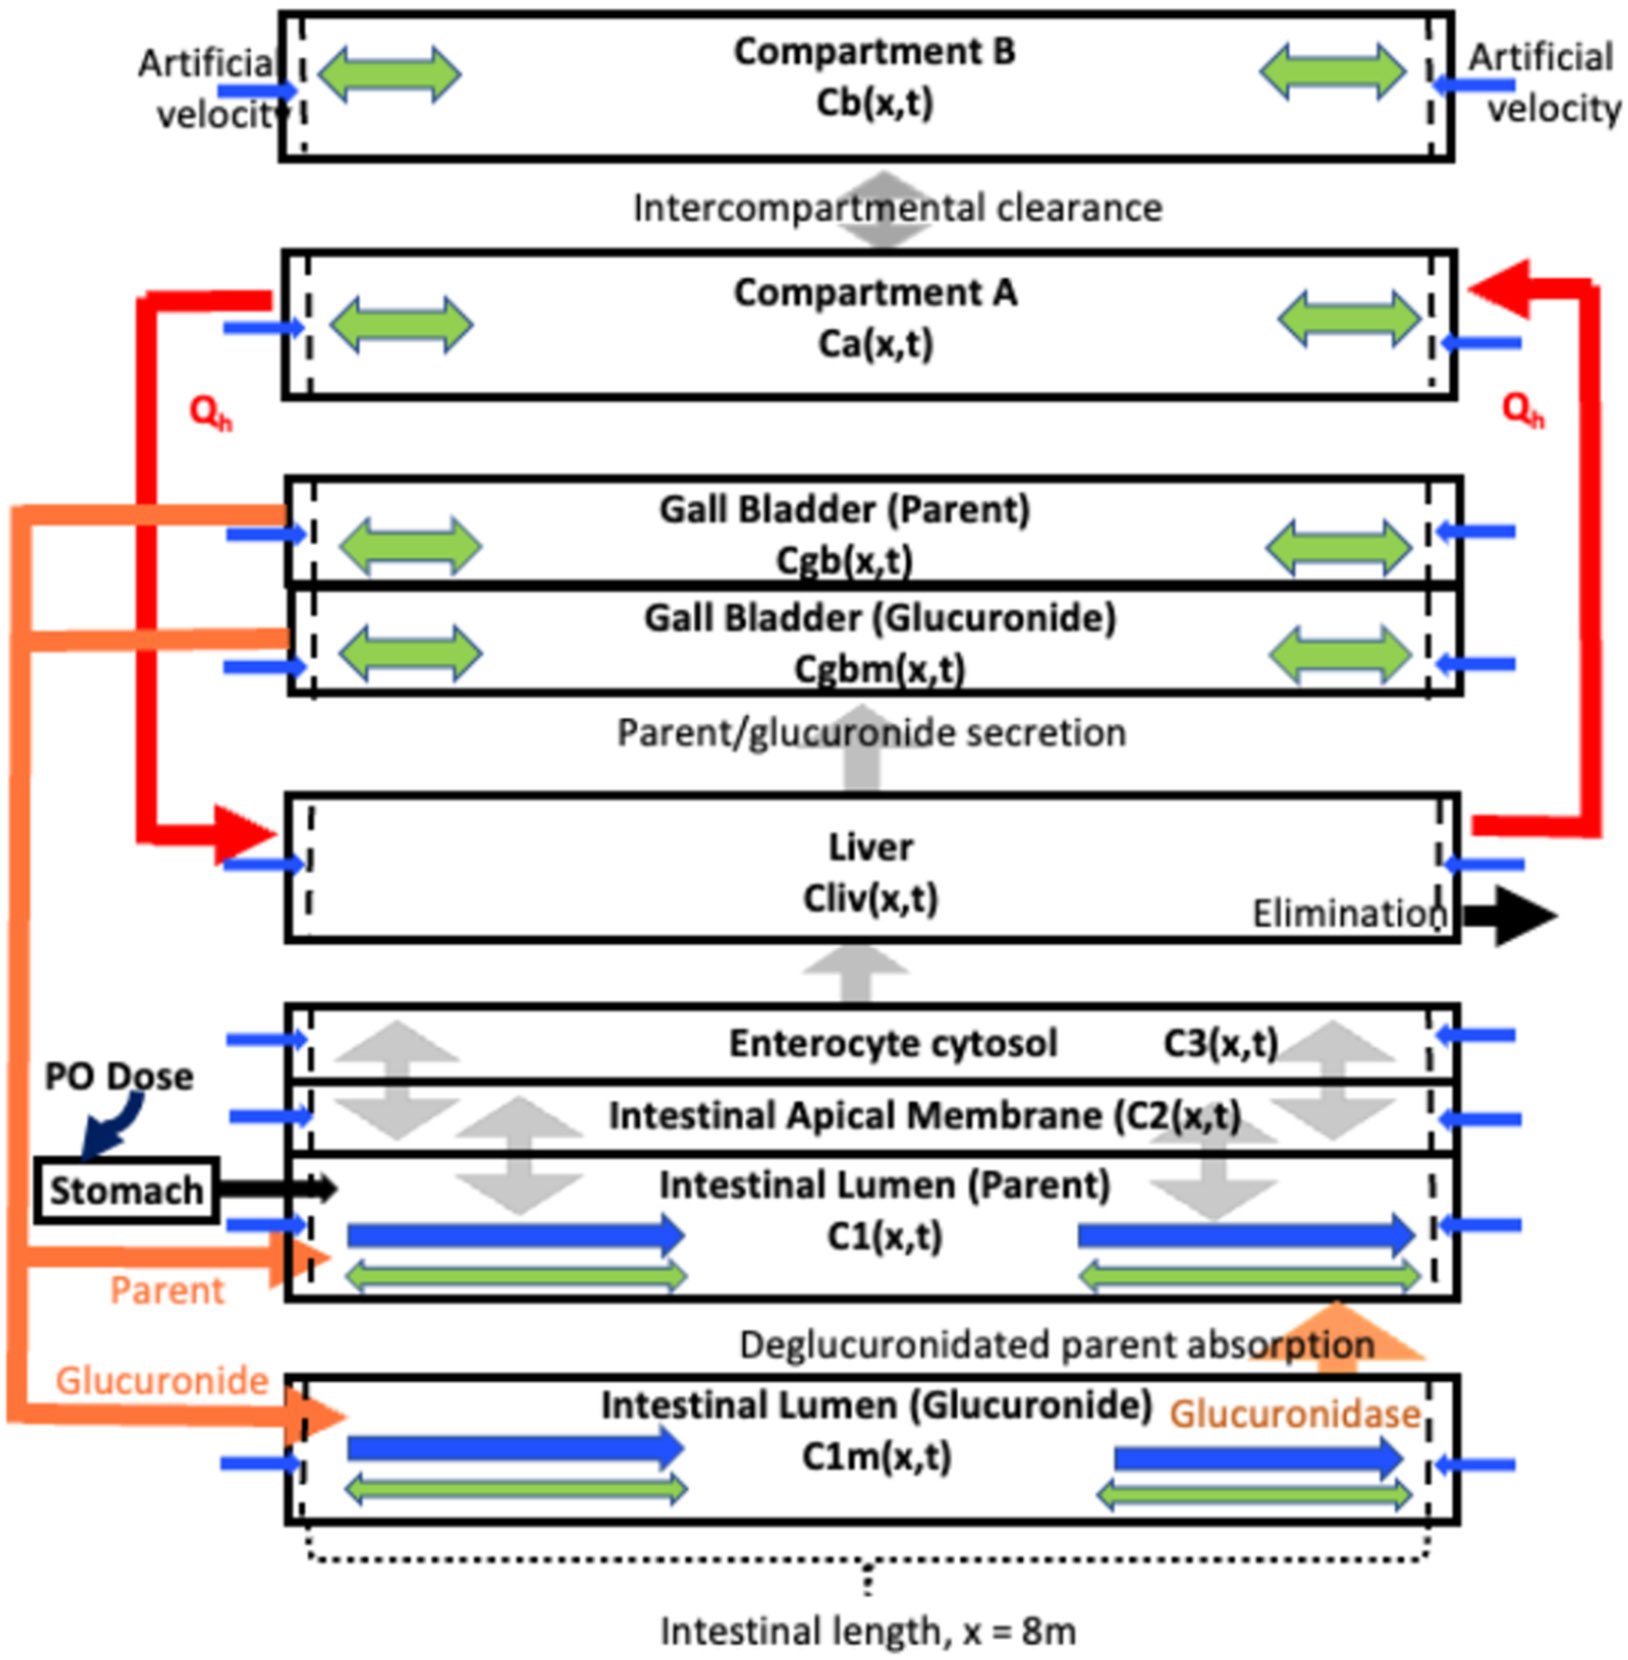
Nalbuphine (NAL) is a κ-agonist/μ-antagonist opioid being developed as an oral extended formulation (ER) for the treatment of chronic cough in idiopathic pulmonary fibrosis and itch in prurigo nodularis. NAL is extensively glucuronidated and likely undergoes enterohepatic recirculation (EHR). The purpose of this work is to develop pharmacokinetic models for NAL absorption and enterohepatic recirculation (EHR). Clinical pharmacokinetic (PK) data sets in healthy subjects from three trials that included IV, oral solution, and ER tablets in fed and fasted state and two published trials were used to parametrize a novel partial differential equation (PDE)-based model, termed "PDE-EHR" model. Experimental inputs included in vitro dissolution and permeability data. The model incorporates a continuous intestinal absorption framework, explicit liver and gall bladder compartments, and compartments for systemic drug disposition. The model was fully PDE-based with well-stirred compartments achieved by rapid diffusion. The PDE-EHR model accurately reproduces NAL concentration-time profiles for all clinical data sets. NAL disposition simulations required inclusion of both parent and glucuronide recirculation. Inclusion of intestinal P-glycoprotein efflux in the simulations suggests that NAL is not expected to be a victim or perpetrator of P-glycoprotein-mediated drug interactions. The PDE-EHR model is a novel tool to predict EHR and food/formulation effects on drug PK. The results strongly suggest that even intravenous dosing studies be conducted in fasted subjects when EHR is suspected. The modeling effort is expected to aid in improved prediction of dosing regimens and drug disposition in patient populations.
Keywords: enterohepatic recirculation; nalbuphine; partial differential equations; pharmacokinetic models.
Figures


Similar articles
-
Disposition of Oral Nalbuphine and Its Metabolites in Healthy Subjects and Subjects with Hepatic Impairment: Preliminary Modeling Results Using a Continuous Intestinal Absorption Model with Enterohepatic Recirculation.Metabolites. 2024 Aug 27;14(9):471. doi: 10.3390/metabo14090471. Metabolites. 2024. PMID: 39330478 Free PMC article.
-
Prescription of Controlled Substances: Benefits and Risks.2025 Jul 6. In: StatPearls [Internet]. Treasure Island (FL): StatPearls Publishing; 2025 Jan–. 2025 Jul 6. In: StatPearls [Internet]. Treasure Island (FL): StatPearls Publishing; 2025 Jan–. PMID: 30726003 Free Books & Documents.
-
The Black Book of Psychotropic Dosing and Monitoring.Psychopharmacol Bull. 2024 Jul 8;54(3):8-59. Psychopharmacol Bull. 2024. PMID: 38993656 Free PMC article. Review.
-
Nalbuphine for postoperative pain treatment in children.Cochrane Database Syst Rev. 2014 Jul 31;2014(7):CD009583. doi: 10.1002/14651858.CD009583.pub2. Cochrane Database Syst Rev. 2014. PMID: 25079857 Free PMC article.
-
Comparison of Two Modern Survival Prediction Tools, SORG-MLA and METSSS, in Patients With Symptomatic Long-bone Metastases Who Underwent Local Treatment With Surgery Followed by Radiotherapy and With Radiotherapy Alone.Clin Orthop Relat Res. 2024 Dec 1;482(12):2193-2208. doi: 10.1097/CORR.0000000000003185. Epub 2024 Jul 23. Clin Orthop Relat Res. 2024. PMID: 39051924
Cited by
-
Disposition of Oral Nalbuphine and Its Metabolites in Healthy Subjects and Subjects with Hepatic Impairment: Preliminary Modeling Results Using a Continuous Intestinal Absorption Model with Enterohepatic Recirculation.Metabolites. 2024 Aug 27;14(9):471. doi: 10.3390/metabo14090471. Metabolites. 2024. PMID: 39330478 Free PMC article.
References
-
- Nubain Product Label, 2019. https://www.accessdata.fda.gov/drugsatfda_docs/label/2019/018024s042lbl.pdf (accessed June 18, 2023).
-
- Maher TM; Avram C; Bortey E; Hart SP; Hirani N; Molyneux PL; Porter JC; Smith JA; Sciascia T Nalbuphine Tablets for Cough in Patients with Idiopathic Pulmonary Fibrosis. NEJM Evid. 2023, 2 (8), No. EVIDoa2300083. - PubMed
-
- Weisshaar E; Szepietowski JC; Bernhard JD; Hait H; Legat FJ; Nattkemper L; Reich A; Sadoghi B; Sciascia TR; Zeidler C; et al. Efficacy and safety of oral nalbuphine extended release in prurigo nodularis: results of a phase 2 randomized controlled trial with an open-label extension phase. J. Eur. Acad. Dermatol. Venereol 2022, 36 (3), 453–461. - PubMed
-
- Lo MW; Schary WL; Whitney CC Jr. The disposition and bioavailability of intravenous and oral nalbuphine in healthy volunteers. J. Clin. Pharmacol 1987, 27 (11), 866–873. - PubMed
MeSH terms
Substances
Grants and funding
LinkOut - more resources
Full Text Sources
Research Materials
