. 2024 Nov;57(11):e13702.
doi: 10.1111/cpr.13702. Epub 2024 Jul 2.

Abnormal HCK/glutamine/autophagy axis promotes endometriosis development by impairing macrophage phagocytosis

Affiliations

Abnormal HCK/glutamine/autophagy axis promotes endometriosis development by impairing macrophage phagocytosis

Sha-Ting Lei et al. Cell Prolif. 2024 Nov.

Abstract

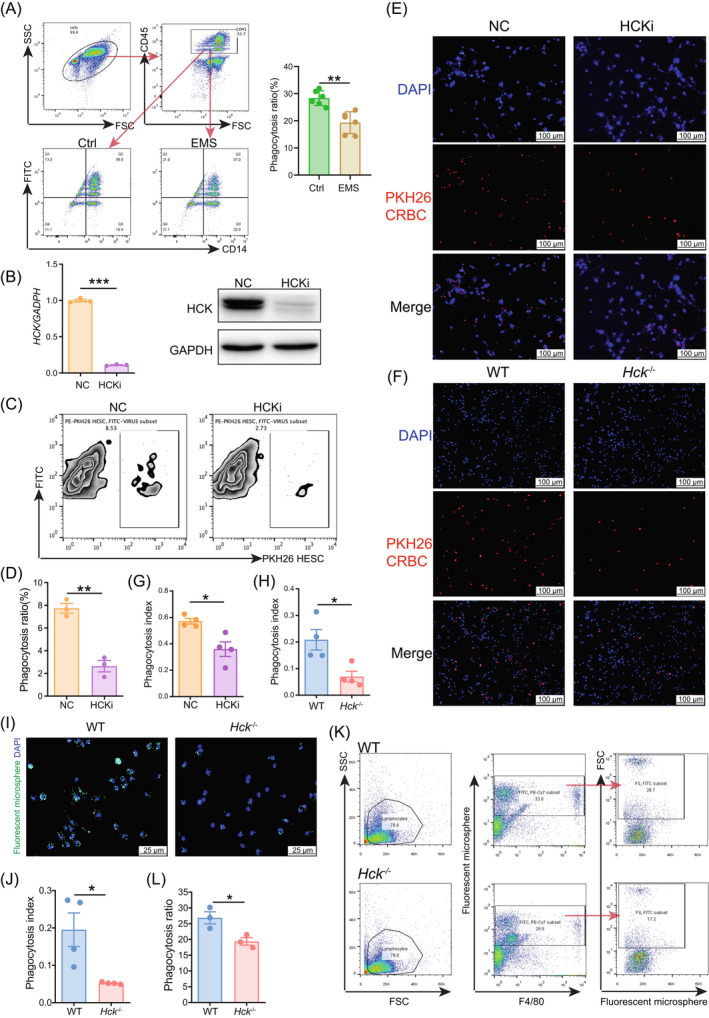
The presence of extensive infiltrated macrophages with impaired phagocytosis is widely recognised as a significant regulator for the development of endometriosis (EMs). Nevertheless, the metabolic characteristics and the fundamental mechanism of impaired macrophage phagocytosis are yet to be clarified. Here, we observe that there is the decreased expression of haematopoietic cellular kinase (HCK) in macrophage of peritoneal fluid from EMs patients, which might be attributed to high oestrogen and hypoxia condition. Of note, HCK deficiency resulted in impaired macrophage phagocytosis, and increased number and weight of ectopic lesions in vitro and in vivo. Mechanistically, this process was mediated via regulation of glutamine metabolism, and further upregulation of macrophage autophagy in a c-FOS/c-JUN dependent manner. Additionally, macrophages of EMs patients displayed insufficient HCK, excessive autophagy and phagocytosis dysfunction. In therapeutic studies, supplementation with glutamine-pre-treated macrophage or Bafilomycin A1 (an autophagy inhibitor)-pre-treated macrophage leads to the induction of macrophage phagocytosis and suppression of EMs development. This observation reveals that the aberrant HCK-glutamine-autophagy axis results in phagocytosis obstacle of macrophage and further increase the development risk of Ems. Additionally, it offers potential therapeutic approaches to prevent EMs, especially patients with insufficient HCK and macrophage phagocytosis dysfunction.


Conflict of interest statement

The authors declare that they have no competing interests.

Figures

FIGURE 1
FIGURE 1
Hypoxia plus oestrogen decrease HCK levels of PM cells from EMs patients. (A) Transcription level of HCK in PM cells of patients of EMs group (n = 14) or Ctrl group (n = 11) by RT‐PCR. (B) Western‐blot for HCK expression of patients of EMs group (n = 4) or Ctrl group (n = 4). And quantitative analysis of the expression levels of HCK. (C) Immunofluorescence detection for HCK expression in PM cells of patients of EMs group (n = 4) or Ctrl group (n = 4) (Scale bar, 25 μm). (D) Western‐blot for HCK expression of M0 macrophages treated with estradiol (0 M, 10^−8 M, 10^−7 M) or estradiol combined with hypoxia (oxygen concentration settled at 2%) treatment for 48 h (n = 3) (left). The quantification of relative expression levels of HCK in M0 macrophages treated with estradiol (0 M, 10^−8 M, 10^−7 M) or estradiol combined with hypoxia (oxygen concentration setted at 2%) treatment for 48 h by normalisation with expression level of GAPDH (right). (E) Transcription level of HCK in PM cells of M0 macrophages treated with estradiol (0 M, 10^−8 M, 10^−7 M) for 24 h (n = 3). Data were presented as mean ± SEM and analysed by t test or one‐way ANOVA test. NS: no significance. *p < 0.05; **p < 0.01; ****p < 0.0001. EM, endometriosis; HCK, haematopoietic cellular kinase; PM, peritoneal macrophages; RT‐PCR, real‐time polymerase chain reaction.
FIGURE 2
FIGURE 2
Deficiency of HCK leads to insufficient phagocytosis of macrophages. (A) The PM cells of patients with or without EMs were incubated with carboxylate‐modified fluorescent latex beads for 1 h (number of macrophages: number of beads = 1:100). Phagocytosis ratio was detected by FCM and calculated as the percentage of CD14+FITC+ cells among CD14+ macrophages. (B) Validation of HCK silenced THP1 cell lines using Western blotting or RT‐PCR. (C, D) HESCs were labelled with PKH26 and co‐cultured with NC (n = 3) or HCKi (n = 3) M2 macrophages for 2 h (number of macrophages: number of HESCs = 1:2). Phagocytosis ratio was detected by FCM and calculated as the percentage of PKH26+ macrophages among total macrophages. (E–H) Chicken erythrocytes (CRBC) were labelled with PKH26 and co‐cultured with NC (n = 3) or HCKi (n = 3) M2 macrophages (E and G) or PM cells of Hck −/− mice (n = 4) or WT mice (n = 4) (F and H) for 1 h (number of macrophages: number of chicken erythrocytes = 1:10). Macrophages labelled with DAPI. Phagocytosis was detected by fluorescence microscopy. The phagocytic index calculated as the percentage of phagocyted chicken erythrocytes among total macrophages (Scale bar, 100 μm). (I–L) The PM cells of Hck −/− mice (n = 4) or WT mice (n = 4) were incubated with carboxylate‐modified fluorescent latex beads for 1 h (number of macrophages: number of beads = 1:100). Phagocytosis was detected by fluorescence microscopy (I, J) or FCM (K, L) (Scale bar, 25 μm). Data were presented as mean ± SEM and analysed by t test. *p < 0.05; **p < 0.01; ***p < 0.001. EM, endometriosis; FCM, flow cytometry; HCK, haematopoietic cellular kinase; HCKi, HCK‐silenced; HESC, human endometrial stromal cells line; NC, normal control THP‐1 cells; PM, peritoneal macrophages.
FIGURE 3
FIGURE 3
EMs‐induced reduction of HCK leads to decreased glutamine levels. (A) Heatmap of differential metabolites in PM cells of Hck −/− mice (n = 8) and WT mice (n = 10). (B) Volcano plot showing differential metabolites of PM cells of Hck −/− mice (n = 8) or WT mice (n = 10). Red colour indicates metabolites that are upregulated and blue colour indicates downregulated metabolites in Hck −/− mice when compared with the WT mice. (C) Enriched KEGG pathways of differential metabolites clustering form (A). (D) Glutamine levels of PM cells of Hck −/− mice (n = 4) or WT mice (n = 3) were determined. (E) Glutamine levels of PM cells of patients of EMs group (n = 6) or Ctrl group (n = 6) were determined. (F) Summary of glutamine metabolism characteristics in PM cells of Hck −/− mice (ABAT: aminobutyrate aminotransferase, ALDH5A1: aldehyde dehydrogenase 5 family, member A1, CAD: carbamoyl phosphate synthase, GABA: γ‐aminobutyrate, GAD: glutamate decarboxylase, GFPT1: glutamine‐fructose‐6‐phosphate transaminase 1, GLS: glutaminase, GLUD1:glutamate dehydrogenase1, GS: glutamine synthetase, GOT: glutamic oxaloacetic transaminase, PPAT: phosphoribosyl pyrophosphate amidotransferase, TCA Cycly: tricarboxylic acid cycle). (G) Expression of metabolic enzymes of glutamine metabolism between PM cells of Hck −/− mice (n = 3) or WT mice (n = 4) was detected by RT‐PCR. (H) Expression of glutamine transporters of NC (n = 3) or HCKi (n = 3) THP‐1 cells was detected by RT‐PCR. Data were presented as mean ± SEM or median and quartile and analysed by t test. *p < 0.05; **p < 0.01; ***p < 0.001. EM, endometriosis; HCK, haematopoietic cellular kinase; HCKi, HCK‐silenced; NC: normal control THP‐1 cells; NS: no significance; PM, peritoneal macrophages.
FIGURE 4
FIGURE 4
Glutamine enhances phagocytosis of HCKi macrophages. (A, B) HESC that were labelled with CFSE were co‐cultured with M2 macrophages in either glutamine‐free (n = 6) or control medium (n = 6) for a duration of 2 h (number of macrophages: number of HESCs = 1:2). Phagocytosis was detected by FCM and calculated as the percentage of FITC+APC+ cells among APC+ macrophages. (C, D) HCKi M2 macrophages treated with glutamine (0 mM, 2 mM, 4 mM) for 4 h. After that, chicken erythrocytes (CRBC) that were labelled with PKH26 were co‐cultured with HCKi macrophages pre‐treated with glutamine for a duration of 1 h (number of macrophages: number of chicken erythrocytes = 1:10). Phagocytosis was detected by fluorescence microscopy (Scale bar, 100 μm). Data were presented as mean ± SEM and analysed by t test or one‐way ANOVA test. *p < 0.05; **p < 0.01; ***p < 0.001. HCK, haematopoietic cellular kinase; HCKi, HCK‐silenced.
FIGURE 5
FIGURE 5
A dysfunctional HCK/glutamine pathway induces upregulation of autophagy in macrophages. (A) Transcription level of autophagy related genes in PM cells of Hck −/− mice (n = 4) or WT mice (n = 4) by RT‐PCR. (B) Autophagic structures (indicated by yellow arrows) under transmission electron microscopy in PM cells of Hck −/− mice (n = 4) or WT mice (n = 4) (Scale bar, 10 μm). (C) Transcription level of autophagy related genes in PM cells of EMs group (n = 12) or Ctrl group (n = 10) by RT‐PCR. (D) Expression of autophagy related proteins in NC or HCKi macrophages was detected by Western blotting. (E) The quantification of relative protein expression levels in (D) in NC or HCKi macrophages by normalisation with expression level of GAPDH. (F, G) Transcription level of autophagy related genes in M2 macrophages that were cultured in either glutamine‐free (n = 3) or regular growth medium (n = 3) for a duration of 4 h by RT‐PCR (F) and Western blotting (G). (H, I) Immunofluorescence detection (H) or FCM analysis (I) for autophagy detection of M2 macrophages treated with regular growth medium, glutamine‐free medium, or rapamycin (100 nM) (n = 3) for 4 h (Scale bar, 10 μm). (J) Glutamine levels of M2 macrophages pre‐treated with regular growth medium, glutamine‐free medium, rapamycin (100 nM) for 4 h, or bafilomycin a1 (Baf, 100 μM) (n = 3) for 1 h were determined. (K) Transcription level of autophagy related genes in NC or HCKi macrophages (cultured with glutamine‐free medium) treated by glutamine 0 mM, 2 mM, 4 mM for 4 h, by RT‐PCR. Data were presented as mean ± SEM and analysed by t test or one‐way ANOVA test. *p < 0.05; **p < 0.01; ***p < 0.001; ### p < 0.001. EM, endometriosis; FCM, flow cytometry; HCK, haematopoietic cellular kinase; HCKi, HCK‐silenced; NC: normal control THP‐1 cells; PM, peritoneal macrophages; RT‐PCR, real‐time polymerase chain reaction.
FIGURE 6
FIGURE 6
Macrophage autophagy induced by lack of HCK/glutamine is dependent on the activation of c‐FOS/JUN. (A) The PPI of differentially expression genes between NC and HCKi macrophages (n = 3). (B) Transcription level of essential genes in (A) of NC and HCKi macrophages by RT‐PCR. (n = 3). (C) Expressions of essential proteins or autophagy related proteins in NC or HCKi macrophages were detected by Western blotting. (D) The quantification of relative protein expression levels in (C) in NC or HCKi macrophages by normalisation with expression level of GAPDH. (E) Transcription level of essential genes in (A) of M2 macrophages in either glutamine‐free (n = 3) or regular growth medium (n = 3) for a duration of 4 h. (F) Expressions of essential proteins in M2 macrophages in either glutamine‐free or regular growth medium for a duration of 4 h were detected by Western blotting (left). The quantification of relative protein expression levels in M2 macrophages in either glutamine‐free or regular growth medium for a duration of 4 h by normalisation with expression level of GAPDH (right). (G–I) FCM analysis (G, H) or immunofluorescence detection (I) for autophagy detection of M2 macrophages cultured with glutamine‐free medium with/without T5224 (10 μM) (n = 3) for 4 h (Scale bar, 10 μm). Data were presented as mean ± SEM and analysed by t test. *p < 0.05; **p < 0.01; ***p < 0.001, NS: no significance. HCK, haematopoietic cellular kinase; HCKi, HCK‐silenced; NC: normal control THP‐1 cells; PPI, protein–protein interaction; RT‐PCR, real‐time polymerase chain reaction.
FIGURE 7
FIGURE 7
Autophagy restricts macrophage phagocytosis. (A, B) M2 macrophages pre‐treated with regular growth medium or rapamycin (100 nM) for 4 h, and then M2 macrophages were incubated with carboxylate‐modified fluorescent latex beads for 1 h (number of macrophages: number of beads = 1:100). Phagocytosis was detected by FCM and calculated as the percentage of CD14+FITC+ cells among CD14+ macrophages (n = 6). (C) M2 macrophages pre‐treated with regular growth medium, glutamine‐free medium, rapamycin (100 nM) for 4 h, or bafilomycin a1 (Baf, 100 μM) combine with glutamine‐free medium for 1 h, were incubated with carboxylate‐modified fluorescent latex beads for 1 h (number of macrophages: number of beads = 1:100). Phagocytosis was detected by fluorescence microscopy (Scale bar, 50 μm or 20 μm). (D) M2 macrophages pre‐treated with regular growth medium, glutamine‐free medium, T5224 (10 μM) or T5224 (10 μM) combine with glutamine‐free medium for 4 h, were incubated with carboxylate‐modified fluorescent latex beads for 1 h (number of macrophages: number of beads = 1:100). Phagocytosis was detected by fluorescence microscopy (Scale bar, 50 μm or 20 μm). (E) Schematic diagram of the regulation of glutamine/FOS/JUN‐autophagy‐phagocytosis axis. In the microenvironment of endometriosis, the reduced glutamine level of peritoneal macrophages results in elevated cFOS and cJUN expression. This leads to upregulation of autophagy‐related genes, thereby suppressing macrophage phagocytic function. Restoring macrophage phagocytic ability can be achieved by inhibiting macrophage autophagy (Baf treatment) or by blocking the DNA binding capacity of cFOS/cJUN (T5224 treatment). Data were presented as mean ± SEM and analysed by t test or one‐way ANOVA test. *p < 0.05; **p < 0.01; ***p < 0.001. NS: no significance.
FIGURE 8
FIGURE 8
Glutamine suppresses endometriosis development by regulating autophagy and phagocytosis of macrophage. (A) This flowchart depicts the steps involved in establishing a mouse model for allogeneic endometrial transplantation using intraperitoneal injection of fragments of endometrial tissue. (B–D) The pictures (B), weight (C) and number (D) of ectopic lesions were analysed. (E) The process of constructing an in vivo phagocytosis model. (F, G) The pictures (F), weight and number (G) of ectopic lesions were analysed. (H, I) The proportions of Vimentin+ and PKH26+ macrophages were evaluated by FCM. Phagocytosis was calculated as the percentage of Vimentin+PKH26+ macrophages cells among donor macrophages. Data were presented as mean ± SEM and analysed by t test or one‐way ANOVA test. *p < 0.05; **p < 0.01; ***p < 0.001; ****p < 0.0001. FCM, FCM, flow cytometry; NS: no significance.
FIGURE 9
FIGURE 9
Schematic roles of the inhibition of phagocytic function in PM cells as a result of low HCK expression in patients with EMs. Abnormal elevation of oestrogen levels in patients with EMs leads to a reduction in HCK expression in PM cells, which subsequently affects glutamine transport, resulting in reduced intracellular glutamine content. Low glutamine levels in macrophages cause an increase in expression of EGR1, cFOS and cJUN, promoting transcription of autophagy‐related genes, further leading to a decrease in macrophage phagosomes and impaired phagocytic function. Ultimately, this results in insufficient clearance of endometrial cells at ectopic sites and the formation of endometriotic foci. EM, endometriosis; HCK, haematopoietic cellular kinase; PM, peritoneal macrophages.

References

    1. Organization WH . Endometriosis 2023. https://www.who.int/news-room/fact-sheets/detail/endometriosis
    1. Saunders PTK, Horne AW. Endometriosis: etiology, pathobiology, and therapeutic prospects. Cell. 2021;184(11):2807‐2824. - PubMed
    1. Horne AW, Saunders PTK. SnapShot: endometriosis. Cell. 2019;179(7):1677‐1677 e1. - PubMed
    1. Veth VB, van de Kar MM, Duffy JM, et al. Gonadotropin‐releasing hormone analogues for endometriosis. Cochrane Database Syst Rev. 2023;6(6):CD014788. - PMC - PubMed
    1. Vercellini P, Vigano P, Somigliana E, et al. Endometriosis: pathogenesis and treatment. Nat Rev Endocrinol. 2014;10(5):261‐275. - PubMed