

Published Erratum
doi: 10.3389/fmed.2024.1432559.
eCollection 2024.
Corrigendum: One-carbon pathway metabolites are altered in the plasma of subjects with Down syndrome: relation to chromosomal dosage
Affiliations
- PMID: 38957303
- PMCID: PMC11218810
- DOI: 10.3389/fmed.2024.1432559
Item in Clipboard
Published Erratum
Corrigendum: One-carbon pathway metabolites are altered in the plasma of subjects with Down syndrome: relation to chromosomal dosage
Front Med (Lausanne).
.
Abstract
[This corrects the article DOI: 10.3389/fmed.2022.1006891.].
Keywords: Down syndrome; chromosomal dosage; folates; one-carbon pathway; trisomy 21.
Copyright © 2024 Vione, Ramacieri, Zavaroni, Piano, La Rocca, Caracausi, Vitale, Piovesan, Gori, Pirazzoli, Strippoli, Cocchi, Corvaglia, Locatelli, Pelleri and Antonaros.
Figures
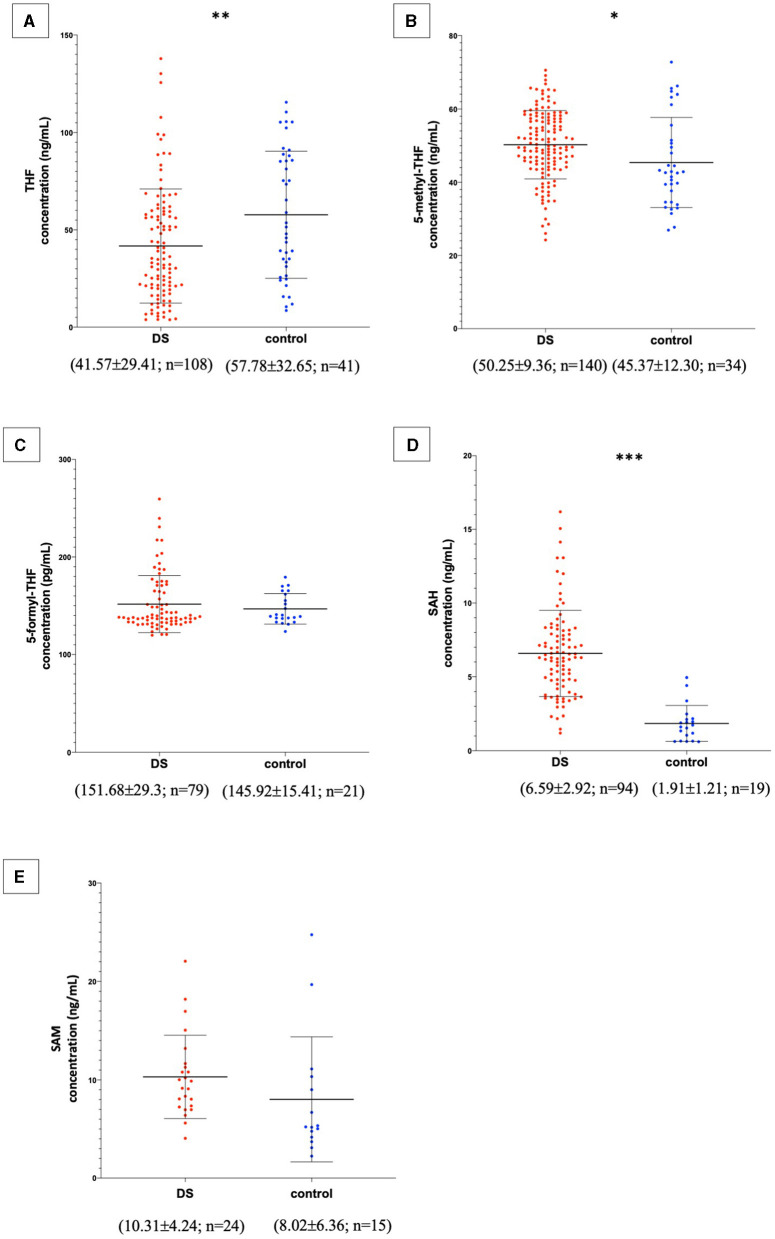
Metabolite concentrations in subjects with DS and normal control subjects. The graphs report metabolite plasma levels of each subject in the study. On the x-axis there is the subdivision of subjects in DS and control groups. Subjects with DS are represented like red dots and normal control subjects are represented like blue dots. On the y-axis the concentration of the metabolite in ng/mL or pg/mL is reported. The asterisks above the graph indicate the level of statistical significance (*p < 0.05; **p < 0.005; ***p < 0.0005). The middle black lines indicate the mean concentration values for each group and the external black lines indicate standard deviation (SD) values. The mean concentration, SD values and the number of subjects (n) are reported below each graph for DS and control groups. (A) shows THF concentrations; (B) shows 5-methyl-THF concentrations; (C) shows 5-formyl-THF concentrations excluding strong outliers; (D) shows SAH concentrations excluding strong outliers; (E) shows SAM concentrations. The graphs were created with GraphPad Prism software v.6.0 (San Diego, CA).
Erratum for
-
One-carbon pathway metabolites are altered in the plasma of subjects with Down syndrome: Relation to chromosomal dosage.Front Med (Lausanne). 2022 Dec 1;9:1006891. doi: 10.3389/fmed.2022.1006891. eCollection 2022. Front Med (Lausanne). 2022. PMID: 36530924 Free PMC article.
References
Publication types
LinkOut - more resources
Full Text Sources