. 2024 Aug 2;135(4):e94-e113.
doi: 10.1161/CIRCRESAHA.123.324015. Epub 2024 Jul 3.

mTORC1 Signaling in Brain Endothelial Progenitors Contributes to CCM Pathogenesis

Affiliations

mTORC1 Signaling in Brain Endothelial Progenitors Contributes to CCM Pathogenesis

Wang Min et al. Circ Res. .

Erratum in

Abstract

Background: Cerebral vascular malformations (CCMs) are primarily found within the brain, where they result in increased risk for stroke, seizures, and focal neurological deficits. The unique feature of the brain vasculature is the blood-brain barrier formed by the brain neurovascular unit. Recent studies suggest that loss of CCM genes causes disruptions of blood-brain barrier integrity as the inciting events for CCM development. CCM lesions are proposed to be initially derived from a single clonal expansion of a subset of angiogenic venous capillary endothelial cells (ECs) and respective resident endothelial progenitor cells (EPCs). However, the critical signaling events in the subclass of brain ECs/EPCs for CCM lesion initiation and progression are unclear.

Methods: Brain EC-specific CCM3-deficient (Pdcd10BECKO) mice were generated by crossing Pdcd10fl/fl mice with Mfsd2a-CreERT2 mice. Single-cell RNA-sequencing analyses were performed by the chromium single-cell platform (10× genomics). Cell clusters were annotated into EC subtypes based on visual inspection and GO analyses. Cerebral vessels were visualized by 2-photon in vivo imaging and tissue immunofluorescence analyses. Regulation of mTOR (mechanistic target of rapamycin) signaling by CCM3 and Cav1 (caveolin-1) was performed by cell biology and biochemical approaches.

Results: Single-cell RNA-sequencing analyses from P10 Pdcd10BECKO mice harboring visible CCM lesions identified upregulated CCM lesion signature and mitotic EC clusters but decreased blood-brain barrier-associated EC clusters. However, a unique EPC cluster with high expression levels of stem cell markers enriched with mTOR signaling was identified from early stages of the P6 Pdcd10BECKO brain. Indeed, mTOR signaling was upregulated in both mouse and human CCM lesions. Genetic deficiency of Raptor (regulatory-associated protein of mTOR), but not of Rictor (rapamycin-insensitive companion of mTOR), prevented CCM lesion formation in the Pdcd10BECKO model. Importantly, the mTORC1 (mTOR complex 1) pharmacological inhibitor rapamycin suppressed EPC proliferation and ameliorated CCM pathogenesis in Pdcd10BECKO mice. Mechanistic studies suggested that Cav1/caveolae increased in CCM3-depleted EPC-mediated intracellular trafficking and complex formation of the mTORC1 signaling proteins.

Conclusions: CCM3 is critical for maintaining blood-brain barrier integrity and CCM3 loss-induced mTORC1 signaling in brain EPCs initiates and facilitates CCM pathogenesis.

Keywords: TOR serine-threonine kinases; blood–brain barrier; caveolae; endocytosis; hemangioma, cavernous, central nervous system; mechanistic target of rapamycin complex 1; single-cell gene expression analysis.


Conflict of interest statement

None.

Figures
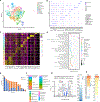
Fig. 1.
Fig. 1.. scRNA-seq analyses identify CCM signature clusters in P10 Pdcd10BECKO brain.
A. Uniform Manifold Approximation and Projection (UMAP) for single-cell transcriptomes in ECs from WT and Pdcd10BECKO cerebellum colored accordingly to identified clusters. B. Dotplots for specific marker genes in each cluster. C. Heatmaps for specific marker genes in each cluster. D. The representative GO pathways for each cluster. False discovery rate (FDR) was adjusted by p.adjust function in R with “method=”BH”” parameter. E-F. Percentage of cells for each cluster in WT and Pdcd10BECKO (E). The enriched clusters in WT and Pdcd10BECKO are listed on each column, respectively (F). G. Volcano plot of the log2 fold changes of the gene expression of the differentially expressed genes (n=390, adjusted p-value <0.05) between Pdcd10BECKO are and the WT. Representative upregulated and downregulated genes are indicated. H. Heatmaps of the log2-fold changes of specific groups of genes (BBB transporters, mitotic, and CCM lesion markers) from the 390 differential expressed genes (DEGs). Genes were considered significantly differentially expressed when the two-sided Wilcoxon Rank Sum test adjusted p-value, based on Bonferroni correction using the total number of genes in the dataset, was below 0.05.
Fig. 2.
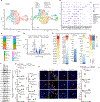
Fig. 2.. scRNA-seq analyses at an early stage identify EC progenitor population enriched for mTOR signaling.
A. UMAP for single-cell transcriptomes in ECs from WT and Pdcd10BECKO cerebellum colored accordingly to identified clusters. B. Heatmaps for specific marker genes in each cluster. C-D. Percentage of cells for each cluster in WT and Pdcd10BECKO. The enriched clusters in WT and Pdcd10BECKO are listed on each column, respectively (D). E. Volcano plot of the log2 fold changes of the gene expression of the differentially expressed genes (n= 323, adjusted p-value <0.05) between Pdcd10BECKO are and the WT. Representative upregulated and downregulated genes are indicated. F. Heatmaps of the log2 fold changes between P6KO and P6WT of specific groups of genes (BBB/Transporters, mitotic, and CCM lesion markers) from the 323 DEGs. G. Heatmaps of the log2 fold changes of P6KO vs P6WT and P10KO vs P10KO in proinflammatory and stem cell marker genes. Genes were considered significantly differentially expressed when the two-sided Wilcoxon Rank Sum test adjusted p-value, based on Bonferroni correction using the total number of genes in the dataset, was below 0.05. H. The top GO pathways from the IPA analyses for Clusters 2 and 6 of Pdcd10BECKO. Both enrichment and activation status were measured in IPA analyses. Significance for enrichment was measured with a corrected p-value while activation status was measured with a z-score presented by continuous color scale from blue, white and red (and gray for NA)) which IPA considers significant if the absolute value is bigger than 2. I-M. UMAP presentations for overlays of Ly6a+, Ccnd1+, Hmgb2+ and Irf7+ ECs with WT and KO populations. Cluster numbers are indicated.
Fig. 3.
Fig. 3.. CCM lesions exhibit increased mTOR signaling in endothelial progenitors.
Pdcd10BECKO pups were fed with tamoxifen at P1 to P3 and tissues were harvested at P6–10. A-B. Stem cell markers were detected by Western blot in brain tissues at P10. Representative two blots were shown (A). Protein levels were quantified and presented as fold changes by taking WT as 1.0 (n=3) (B). C-D. Sca1 is upregulated in mouse CCM lesions. Cerebral sections from WT and Pdcd10BECKO mice were immunostained for Sca1 with CD31. Representative merged images of normal vessels (arrows) and CCM lesions (asterisks) are shown. Large and small arrowheads indicate a representative Sca1+/CD31+ and Sca1+/CD31 progenitor cells, respectively (C). Quantification of Sca1+/CD31+ and Sca1+/CD31 and n=10 (D). E-G. mTOR signaling was upregulated in mouse CCM lesions. Cerebral sections from WT and Pdcd10BECKO mice were immunostained for p-mTOR or p-S6 with CD31. Representative merged images of normal vessels (arrows) and CCM lesions (asterisks). Arrowheads indicate a representative p-mTOR+/CD31+ and P-S6+/CD31+ EC (E, F). Quantification of p-mTOR and p-S6-positive ECs and n=10 (G). H-I. p-S6 is upregulated in Sca1+ EC progenitors. Brain sections from WT and Pdcd10BECKO mice were co-stained with Sca1, p-S6 and CD31. Representative images for WT normal vessels (arrows) and CCM lesions (asterisks). Large and small arrowheads indicate a representative p-S6+/CD31+ ECs and p-S6+/Sca1+ EPCs, respectively (H). Quantification of p-S6+/Sca1+ CD31 and P-S6+/Sca1+CD31+ cells and n=10 (I). Data are means ± SEM. P values are indicated, using unpaired, two tailed Student’s t-test (B, D, G, I). Scale bars: 25 μm (C, E, F, H).
Fig. 4.
Fig. 4.. Cav1 regulates mTOR signaling in CCM3-depleted endothelial progenitors.
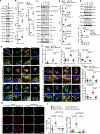
A. Effects of CCM silencing on mTOR signaling. HECFC were transfected with siRNAs as indicated for 48 hours. Stem marker (CD34), mTOR signaling molecules and lesion markers as well as knockdown efficiencies were detected by Western blot with specific antibodies. A representative blot was shown (A). Relative protein levels were quantified by taking Control siRNA (siCT) as 1.0 (n=4) (B). C-L. Co-silencing of Cav1 attenuates siCCM3-augmented mTOR signaling. HECFC were transfected with Control, CCM3, Cav1, or CCM3/Cav1 siRNAs as indicated for 48 hours. (C-D) mTOR signaling and lesion markers were detected by Western blot. A representative blot was shown. Relative protein levels were quantified by taking Ctrl siRNA as 1.0 (n=4) (D). (E-F) mTORC1 complex formation. Cell lysates were subjected to co-immunoprecipitation assays with anti-mTOR followed by Western blot with indicated antibodies. Aliquot of input (1/5) was loaded as controls. A representative blot was shown (E). Relative protein levels were quantified by taking Ctrl siRNA as 1.0 (n=4) (F). (G-J). Intracellular localization of mTOR. Co-immunofluorescence staining of mTOR with Cav1 (G), endocytic marker Rab5 (G), mTOR with lysosomal Lamp1 (G), phosphor-mTOR with Rab5 (I), and phosphor-mTOR with Lamp1 (I). Arrows indicate mTOR or p-mTOR with no colocalization, and arrowheads indicate colocalization of mTOR or p-mTOR with Cav1, Rab5 and Lamp1. Number of double-positive vesicles are quantified (H and J). K-L. EdU incorporation assays for EC proliferation. HECFC were transfected with siCtrl or siCCM3 for 36 h and treated with vehicle or Rapamycin (10 ng/ml) for 12 h followed by EdU incorporation assays. EdU was detected by a Click-iT assay followed by anti-p-mTOR immunostaining with counterstaining by DAPI. % EdU+ ECs were quantified from 10 random fields for each group with duplication from three independent experiments. Data are means ± SEM. P values are indicated, using unpaired, two tailed Student’s t-test (B) or one-way ANOVA followed by Tukey’s multiple comparisons test (D, F, H, J, L). Scale bar: 20 μm (G, I); 100 μm (K).
Fig. 5.
Fig. 5.. Upregulation of the mTOR vesicle signaling in human CCM lesions.
Human CCM specimens were co-immunostained for p-mTOR or p-S6 with Cav1 (A-B), CD34 (D-E), Rab7 (G) or Lamp1 (H). Representative images of human CCM3 samples captured under SP8 STED microscopy are shown with high power merged 4-color images on the right. Arrows indicate normal vessels whereas asterisks indicate for lesions and arrowheads for upregulated mTOR signaling within the lesions. The p-mTOR+CD31+ and p-S6+ CD31+ ECs (C), p-mTOR+CD34+ and p-mTOR+CD34+ EPCs (F), p-S6+CD34 and p-S6+CD34 non-ECs (F), p-mTOR+RAB7+ and p-mTOR+LAMP1+ (I) were quantified. n=6. Data are means ± SEM. P values are indicated, using unpaired, two tailed Student’s t-test. Scale bar: 8 μm.
Fig. 6.
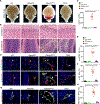
Fig. 6.. Genetic deficiency of Raptor (mTORC1) but not of Rictor (mTORC2) prevents CCM lesion formation in the Pdcd10BECKO model.
Ccm3lox/lox (WT), RptorBECKO (Rptor1-KO), Pdcd10BECKO and Pdcd10BECKO:Rptor BECKO (DKO) pups were fed with tamoxifen from P1 to induce deletion of Ccm3, and cerebella were harvested at P15. A. Images for fresh brain tissue. B. H&E staining and lesion quantifications. Representative images are shown where lesions are indicated asterisks. C. Lesion quantifications from the H&E staining. The numbers of total lesions were quantified as # of lesions per 10 coronal sections, which were 200 μm apart. n = 10 mice per group. D-F. Co-staining for p-S6/Cav1, p-mTOR/Cav1. Representative images of normal vessels (arrowheads) and CCM lesions (asterisks) (D). Quantification of p-mTOR- and p-S6-positive ECs, i.e., % green (p-mTOR or p-S6)-conjugated area/total red (CD31) areas by Image J. n=10 (E, F). G-H. Co-staining for Ki67/Sca1/CD31 for proliferative EPCs. Representative images of normal vessels (arrows) and CCM lesions (asterisks) with arrowheads for co-staining are shown. (h) Quantification of Ki67-positive EPCs. n=10. Data are means ± SEM. P values are indicated, one-way ANOVA followed by Tukey’s multiple comparisons test (C, E, F, H). Scale bars: 2 mm (A); 50 μm (B); 25 μm (D, G).
Fig. 7.
Fig. 7.. mTOR inhibition exhibits strong therapeutic effects on CCM lesion progression.
A-C. Short-term effects of Rapamycin on CCM lesions. A. A diagram for the protocol. Vehicle or Rapamycin was subcutaneously injected into WT and P1 deletion Pdcd10BECKO mice, and brain tissues were harvested at P15. B. Images of fresh brain tissue and H&E staining of brain sections. Representative images are shown where lesions are indicated asterisks. C. Lesion quantifications from the H&E staining. Lesion quantifications from the H&E staining. The numbers of total lesions were quantified as number of lesions per 10 coronal sections, which were 200 μm apart. n=10 mice per group. D-F. Long-term effects of Rapamycin on CCM lesions. D. A diagram for the protocol. Vehicle or Rapamycin was injected intraperitoneally every other day from P8-P28 into WT and P5 deletion Pdcd10BECKO mice, and brain tissues were harvested at P30. E. Images of fresh brain tissue and H&E staining of brain sections. Representative images are shown where lesions are indicated asterisks. F. Lesion quantifications. Lesion quantifications from the H&E staining. The numbers of total lesions were quantified as # of lesions per 10 coronal sections, which were 200 μm apart. n = 10 mice per group. G-H. Characterization of CCM lesions and EC-pericyte interactions by confocal microscopy. Vehicle or Rapamycin was injected intraperitoneally every other day from P8-P28 into WT and P5 deletion Pdcd10BECKO mice, and mice were analyzed at P30. (G). One-month-old mice were perfused with a Texas Red IV dye and NeuroTrace (pericytes) followed by confocal microscopy. Representative images from each group are shown. Arrows indicate pericyte processes whereas arrowheads indicate pericytes dissociating from vessels. (H) Pericyte-free caverns were quantified. n=4. I-J. Characterization of CCM lesions and vascular areas in Vehicle or Rapamycin-treated WT (Mfsd2aCreERT2:mT/mG) and Pdcd10BECKO:mT/mG mice were visualized by confocal microscopy. (I) Representative images of normal or normalized microvessels (arrows) and CCM lesions (arrowheads) are shown. Veins (V) and artery (A) are indicated. (J) Vascular areas are quantified. n=6. Data are means ± SEM. P values are indicated, one-way ANOVA followed by Tukey’s multiple comparisons test (C, F, H, J). Scale bars: 2 mm (upper panels in B); 25 μm (lower panels in B and E); 50 μm (G, I).
Fig. 8.
Fig. 8.. mTORC1 inhibition suppresses CCM pathogenesis by diminishing EPC population.
A. UMAP for single-cell transcriptomes in ECs from vehicle- or Rapamycin-treated P10 Pdcd10BECKO cerebellum colored accordingly to samples (left panel) or identified clusters (right panel). B. Dotplots for specific marker genes in each cluster. C. Percentage of cells for each cluster in vehicle- or Rapamycin-treated Pdcd10BECKO. The enriched clusters in vehicle- or Rapamycin-treated Pdcd10BECKO are listed on each column, respectively. D. Volcano plot of the log2 fold changes of the gene expression of the differentially expressed genes (n= 323, adjusted p-value <0.05) between Rapamycin vs vehicle groups. Representative upregulated and downregulated genes are indicated. E. Heatmaps of the log2 fold changes of specific groups of genes (BBB transporters, mitotic, CCM lesion markers, proinflammatory and stem cell marker) from the 323 DEGs between Rapamycin vs vehicle Pdcd10BECKO. Genes were considered significantly differentially expressed when the two-sided Wilcoxon Rank Sum test adjusted p-value, based on Bonferroni correction using the total number of genes in the dataset, was below 0.05. F-G. Rapamycin blunted mTOR signaling, lesion marker and inflammation in Pdcd10BECKO mice. Brain tissues were subjected to Western blot with respectively antibodies. A representative blot was shown (F). Protein levels were quantified and presented as fold changes by taking WT as 1.0 (n=4) (G). H-I. Rapamycin suppressed mTOR signaling in EPCs in mouse CCM lesions. Cerebral sections from WT and Pdcd10BECKO mice were immunostained for p-mTOR or p-S6 with EC marker CD31 and EPC marker Sca1. Representative merged images of normal vessels (arrows) and CCM lesions (asterisks) with positive staining for p-mTOR+/CD31+, p-S6+/CD31+ and P-S6+/Sca1+ (arrowheads) (H). Quantification of p-mTOR+/CD31+, p-S6+/CD31+ and P-S6+/Sca1+ (I). n=10. Data are means ± SEM. P values are indicated, one-way ANOVA followed by Tukey’s multiple comparisons test (G, I). Scale bars: 25 μm (H).

References

    1. Otten P, Pizzolato GP, Rilliet B and Berney J. [131 cases of cavernous angioma (cavernomas) of the CNS, discovered by retrospective analysis of 24,535 autopsies]. Neurochirurgie. 1989;35:82–3, 128–31. - PubMed
    1. Rigamonti D, Hadley MN, Drayer BP, Johnson PC, Hoenig-Rigamonti K, Knight JT and Spetzler RF. Cerebral cavernous malformations. Incidence and familial occurrence. N Engl J Med. 1988;319:343–7. - PubMed
    1. Revencu N and Vikkula M. Cerebral cavernous malformation: new molecular and clinical insights. J Med Genet. 2006;43:716–21. - PMC - PubMed
    1. Cavalcanti DD, Kalani MY, Martirosyan NL, Eales J, Spetzler RF and Preul MC. Cerebral cavernous malformations: from genes to proteins to disease. Journal of neurosurgery. 2012;116:122–32. - PubMed
    1. Snellings DA, Hong CC, Ren AA, Lopez-Ramirez MA, Girard R, Srinath A, Marchuk DA, Ginsberg MH, Awad IA and Kahn ML. Cerebral Cavernous Malformation: From Mechanism to Therapy. Circ Res. 2021;129:195–215. - PMC - PubMed

MeSH terms

Substances