. 2024 Oct 10;144(15):1617-1632.
doi: 10.1182/blood.2023023727.

Molecular taxonomy of myelodysplastic syndromes and its clinical implications

Affiliations

Molecular taxonomy of myelodysplastic syndromes and its clinical implications

Elsa Bernard et al. Blood. .

Abstract

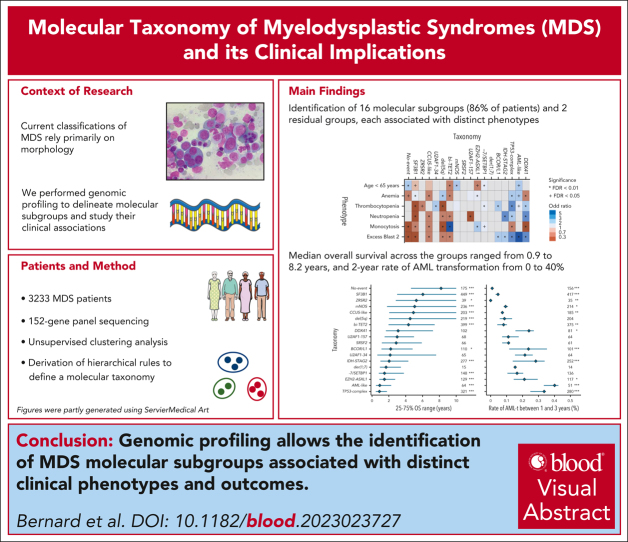
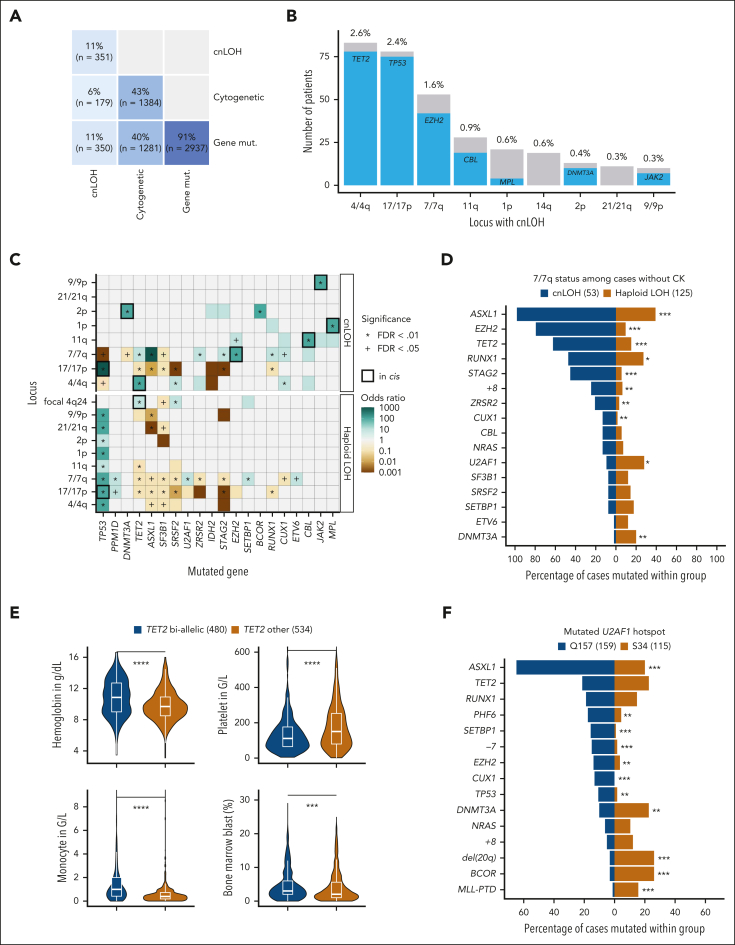
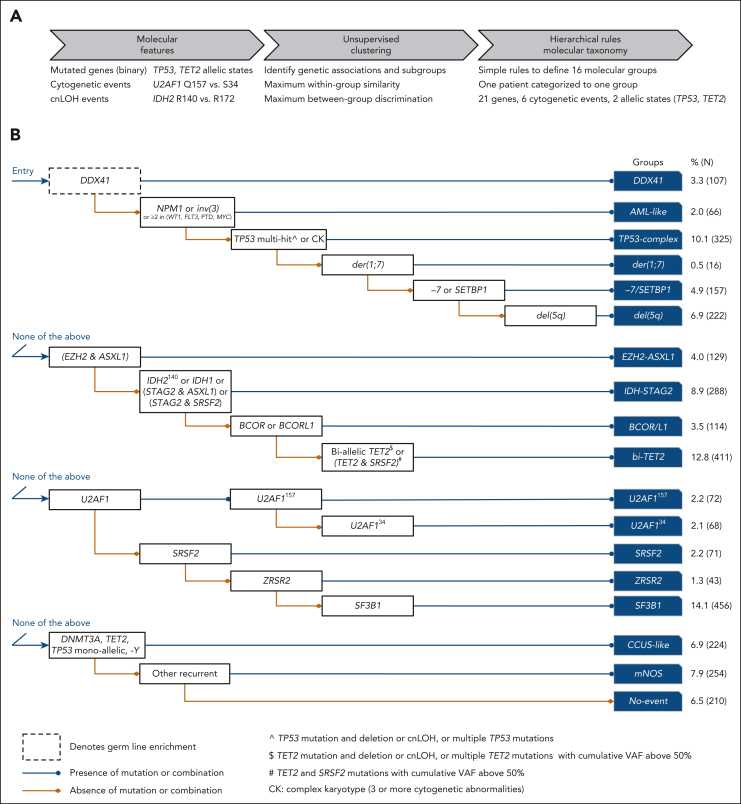
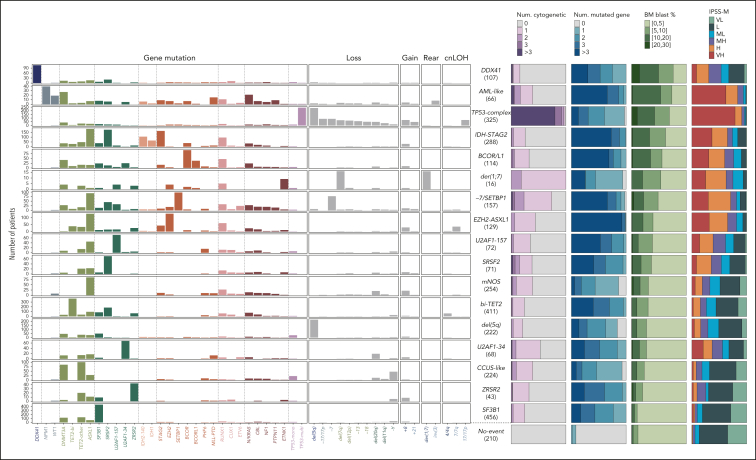
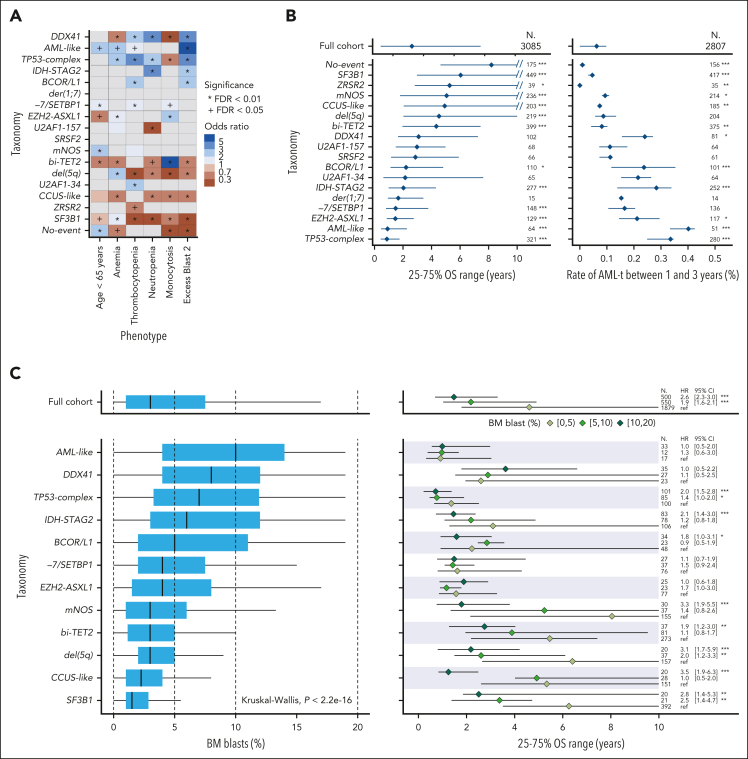
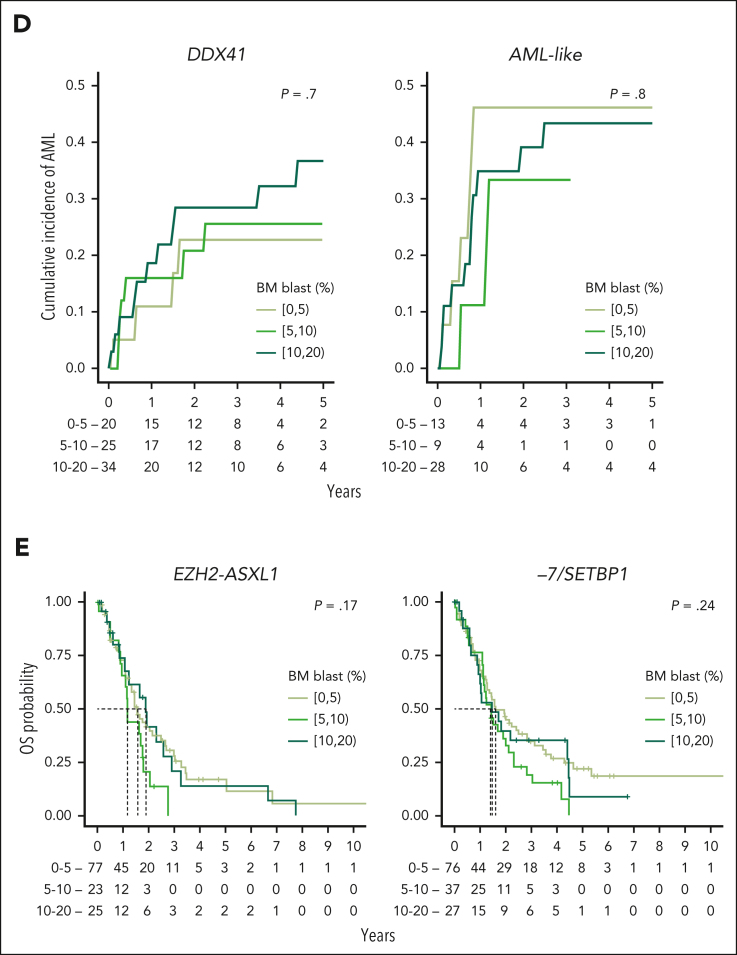
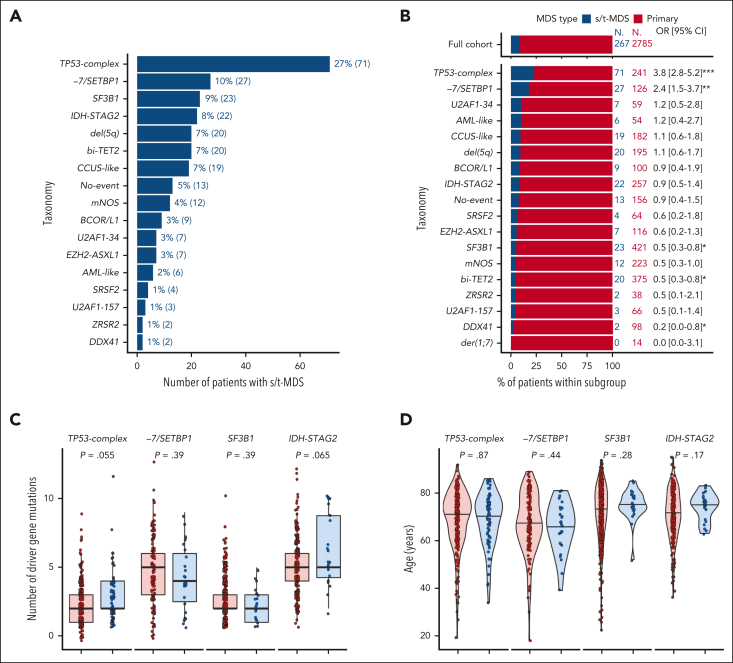
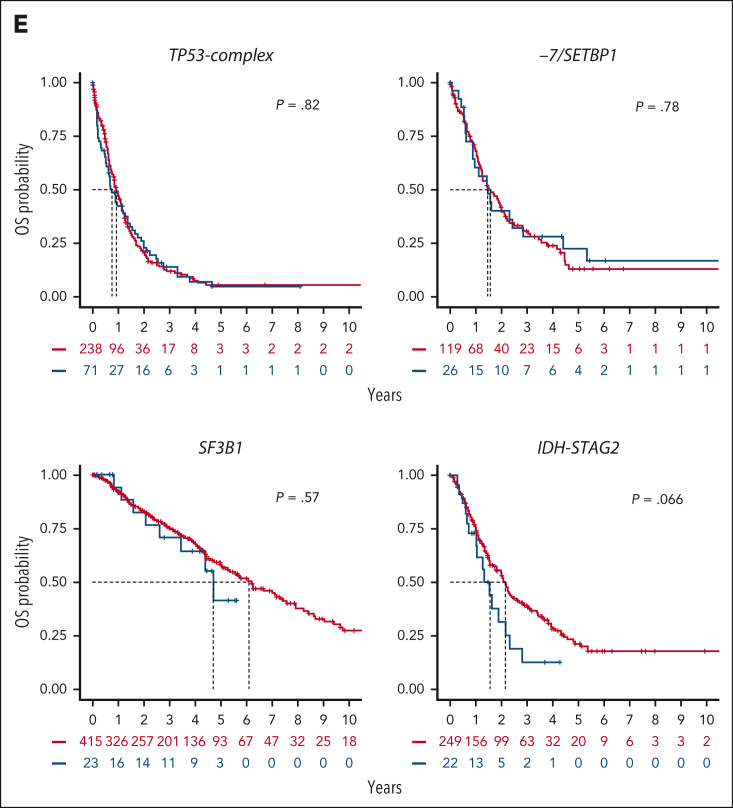
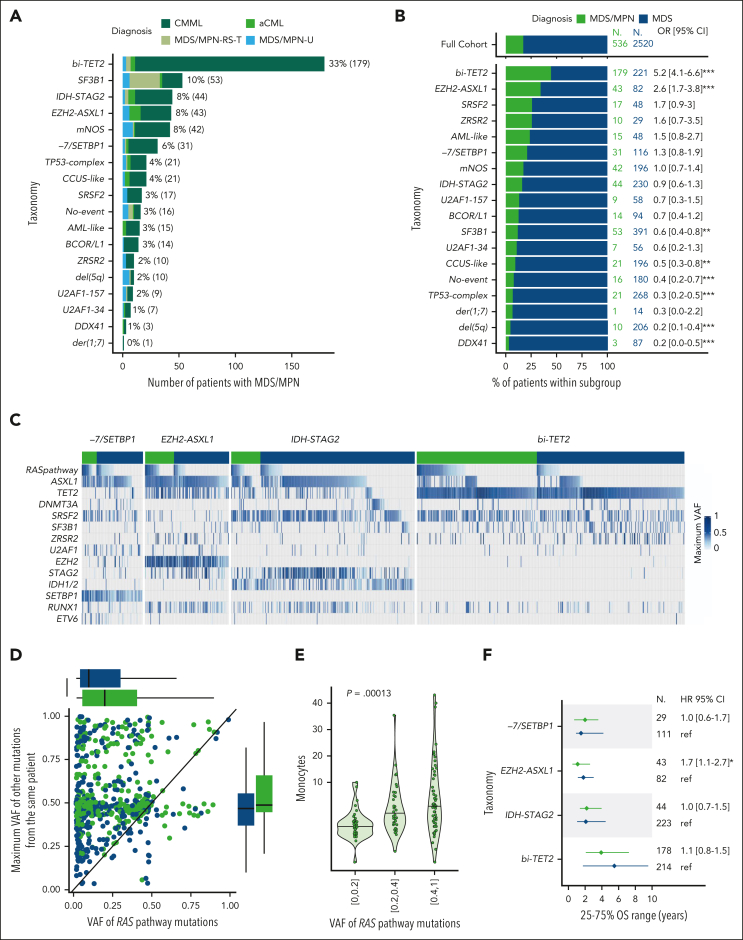
Myelodysplastic syndromes (MDS) are clonal hematologic disorders characterized by morphologic abnormalities of myeloid cells and peripheral cytopenias. Although genetic abnormalities underlie the pathogenesis of these disorders and their heterogeneity, current classifications of MDS rely predominantly on morphology. We performed genomic profiling of 3233 patients with MDS or related disorders to delineate molecular subtypes and define their clinical implications. Gene mutations, copy-number alterations, and copy-neutral loss of heterozygosity were derived from targeted sequencing of a 152-gene panel, with abnormalities identified in 91%, 43%, and 11% of patients, respectively. We characterized 16 molecular groups, encompassing 86% of patients, using information from 21 genes, 6 cytogenetic events, and loss of heterozygosity at the TP53 and TET2 loci. Two residual groups defined by negative findings (molecularly not otherwise specified, absence of recurrent drivers) comprised 14% of patients. The groups varied in size from 0.5% to 14% of patients and were associated with distinct clinical phenotypes and outcomes. The median bone marrow (BM) blast percentage across groups ranged from 1.5% to 10%, and the median overall survival ranged from 0.9 to 8.2 years. We validated 5 well-characterized entities, added further evidence to support 3 previously reported subsets, and described 8 novel groups. The prognostic influence of BM blasts depended on the genetic subtypes. Within genetic subgroups, therapy-related MDS and myelodysplastic/myeloproliferative neoplasms had comparable clinical and outcome profiles to primary MDS. In conclusion, genetically-derived subgroups of MDS are clinically relevant and might inform future classification schemas and translational therapeutic research.


Conflict of interest statement

Conflict-of-interest disclosure: A.A.v.d.L. reports research funding from Roche, Bristol Myers Squibb (BMS), and Celgene; and reports membership on the board of directors or advisory committees of BMS and Celgene. F.T. reports membership on the board of directors of Novartis and AbbVie. M.G.D.P. reports honoraria from, and membership on the board of directors or advisory committees of BMS. P.F. reports consultancy with, and honoraria from and research funding from Novartis, AbbVie, Janssen, Jazz Pharmaceuticals, and BMS; and reports honoraria from French MDS Group. M.R.S. reports membership on the board of directors or advisory committees of Savona, AbbVie Inc, BMS, Geron Corporation, Forma Therapeutics, CTI BioPharma Corp, Karyopharm Therapeutics Inc, Novartis, Sierra Oncology, Inc, Taiho, Takeda Pharmaceutical, and TG Therapeutics Inc; reports consultancy with Forma Therapeutics Inc, Karyopharm Therapeutics Inc, Ryvu Therapeutics; is a current equity holder in publicly traded companies, Karyopharm Therapeutics Inc and Ryvu Therapeutics; received research funding from Takeda Pharmaceutical, TG Therapeutics Inc, ALX Oncology, Astex Pharmaceuticals, Incyte Corporation; and reports patents with, and royalties from, Boehringer Ingelheim. P.V. reports honoraria from BMS, Novartis, Pfizer, Incyte, Blueprint, and Stemline. I.K. reports consultancy with Novartis, BMS, Genesis, and AbbVie; received research funding from Novartis; and received honoraria from Genesis and AbbVie. V.S. reports membership on the board of directors or advisory committees of Santini, BMS, AbbVie, Geron, Gilead, CTI BioPharma, Otsuka, Servier, Janssen, and Syros. U.P. received research funding from Janssen Biotech, Geron, Fibrogen, Silence Therapeutics, Takeda, Curis, Merck, Servier, Syros, Novartis, Celgene, BMS, Amgen, Roche, Jazz Pharmaceuticals, and BeiGene; serves in a consulting role for Janssen Biotech, Geron, Silence Therapeutics, Takeda, Curis, Servier, Jazz Pharmaceuticals, Syros, AbbVie, Novartis, BMS, and Amgen; received honoraria from Silence Therapeutics, Celgene, Takeda, Servier, Jazz Pharmaceuticals, Syros, Novartis, and BMS; reports membership on the board of directors or advisory committees of MDS Foundation and BMS; and received other support (travel support and medical writing) from BMS. M.H. reports consultancy with Pfizer, PinotBio, AbbVie, Servier, BMS, Glycostem, Jazz Pharmaceuticals, Amgen, and Delbert Lab; received honoraria from Pfizer, Novartis, Sobi, Certara, Janssen, and Jazz Pharmaceuticals; and received research funding from PinotBio, BerGenBio, Astellas, Agios, AbbVie, Loxo Oncology, BMS, Glycostem, Karyopharm, and Jazz Pharmaceuticals. M.T.V. serves on the advisory board of Jazz Pharmaceuticals, Celgene/BMS, and Syros; received research funding from Novartis and Celgene/BMS; and is a member of the speakers bureau of AstraZeneca, Novartis, AbbVie, Jazz Pharmaceuticals, Astellas, and Celgene/BMS. B.L.E. is a current equity holder in private company, Skyhawk Therapeutics, Exo Therapeutics, TenSixteen Bio, and Neomorph Inc; reports membership on the board of directors or advisory committees of Skyhawk Therapeutics, Exo Therapeutics, TenSixteen Bio, and Neomorph Inc; serves in a consulting role for AbbVie; and received research funding from Calico and Novartis. P.L.G. reports consultancy with, and research funding from BMS, Novartis, and Gilead. N.G. received research funding from Takeda; and honoraria from Novartis and BMS. E.P. is cofounder of, and holds a fiduciary role in a private company, Isabl Inc; and holds stock options in a private company, TenSixteen Bio. The remaining authors declare no competing financial interests.

Figures

None
Graphical abstract
Figure 1.
Figure 1.
Integrative comutation patterns in MDS and implications for genotype-phenotype analysis. (A) Proportion and number of patients with or without gene mutations (mut.), cytogenetic alterations, and cnLOH events. (B) Number of patients with cnLOH at the most recurrent loci and co-occurrence of gene mutations in cis. The most recurrent cnLOH loci were 4/4q (2.6%), 17/17p (2.3%), and 7/7q (1.6%). Mutations in TET2, TP53, and EZH2 occurred in 94% (78/83), 96% (75/78), and 79% (42/53) of cases with cnLOH at the 4/4q, 17/17p, and 7/7q loci, respectively. (C) Heat map representing mutual exclusivity (brown) or co-occurrence (green) between gene mutations and loci with haploid LOH or cnLOH. Apart from the strong cnLOH–gene mutation interaction in cis (black thick line), focal deletions at the TET2 locus (4q24) also co-occurred with TET2 mutations (OR, 2.4; P = .0007). P values are from Fisher exact test with Benjamini-Hochberg (BH) multiple testing correction. (D) Comparison of comutation frequencies between cases with cnLOH (blue) or haploid LOH (gold) at 7/7q in the absence of CK. For example, mutations in EZH2 were enriched in the 53 cases with cnLOH at 7/7q (79%) compared with the 125 cases with isolated haploid LOH at 7/7q (10%). Conversely, haploid LOH at 7/7q was significantly enriched for U2AF1 and DNMT3A mutations (28% and 20%) compared with cnLOH at 7/7q (9% and 2%). P values are from Fisher exact test with BH multiple testing correction. ∗∗∗P < .001; ∗∗P < .01; ∗P < .05. (E) Comparison of the distributions of blood counts and of the percentage of BM blasts between cases classified as TET2 biallelic (blue) or TET2 other (ie, likely monoallelic, gold). P values are from the Wilcoxon rank-sum test. ∗∗∗∗P < .0001; ∗∗∗P < .001. (F) Comparison of comutation frequencies between cases with U2AF1 Q157 or S34 hot spot mutations. For example, ASXL1 mutations were present in 65% and 20% of patients with U2AF1 Q157 and S34 mutations, respectively (OR, 7.3; P < .0001). Mutations in CUX1, EZH2, PHF6, SETBP1, TP53, and monosomy 7 were also significantly more frequent in the Q157 subset. Conversely, BCOR mutations and del(20q) were more common in patients with S34 (26%) compared with Q157 (3%) mutations (P < .0001). P values are from Fisher exact test with BH multiple testing correction. ∗∗∗P < .001; ∗∗P < .01. FDR, false discovery rate; PTD, partial tandem duplication.
Figure 2.
Figure 2.
Derivation of 16 MDS molecular groups. (A) Schematic of the analytical workflow to identify molecular groups. Features were based on the presence or absence of genetic alterations (gene mutations, cytogenetic, and cnLOH events). Distinct allelic states or hot spots were also included based on prior knowledge (TP53 allelic state, IDH2 hot spots) or univariate comutation analysis (TET2 allelic state, U2AF1 hot spots). (B) Rules of co-occurrence and mutual exclusivity of genetic alterations organized in a hierarchical classification tree.
Figure 3.
Figure 3.
Molecular composition and main characteristics of MDS molecular groups. Each row represents a molecular subgroup, and molecular features are ordered by blocks of gene mutations, chromosomal losses, gains, rearrangements, and cnLOH events. For each subgroup, the relative proportions of (1) the number of mutated genes per patient, (2) the number of cytogenetic alterations per patients, (3) the proportion of BM blasts, and (4) IPSS-M risk category are indicated as stacked bar plots. H, high; L, low; MH, moderate high; ML, moderate low; VH, very high; VL, very low.
Figure 4.
Figure 4.
Associations between MDS molecular groups, clinical phenotypes, and outcomes. (A) Association between molecular groups and clinical phenotypes. Darker blue indicates co-occurrence, and darker red indicates mutual exclusivity. (B) Association between molecular groups and outcomes, for OS (left) and AML transformation (AML-t, right). Dots indicate median OS and lines extend to the interquartile range (left). Dots indicate the 2-year incidence of AML-t and lines extend to the 1-year and 3-year incidences (right). The outcome metrics on the full cohort are provided on top for comparison. P values are from the log-rank test (OS) and the Gray test (AML-t). ∗∗∗P < .001; ∗∗P < .01; ∗P < .05. (C) Distribution of the percentage of BM blast for 12 molecular groups with at least 10 patients within each subset of BM blast, that is, 0% to 5%, 5% to 10%, and 10% to 20% (left). Median survival (dots) and interquartile range (lines) for each blast subset within each molecular group (right). P values are from a univariate Cox model with the 0% to 5% blast subset used as the reference level. The distributions of the full cohort are provided on top for comparison. (D) Cumulative incidence curves of AML-t stratified with the range of percentage of BM blast within the DDX41 and AML-like subgroups. P values are from the Gray test. (E) Kaplan-Meier probability estimates of OS stratified with the range of percentage of BM blast within the EZH2-ASXL1 and −7/SETBP1 subgroups. P values are from the log-rank test. CI, confidence interval; HR, hazard ratio; ref, reference level.
Figure 4.
Figure 4.
Associations between MDS molecular groups, clinical phenotypes, and outcomes. (A) Association between molecular groups and clinical phenotypes. Darker blue indicates co-occurrence, and darker red indicates mutual exclusivity. (B) Association between molecular groups and outcomes, for OS (left) and AML transformation (AML-t, right). Dots indicate median OS and lines extend to the interquartile range (left). Dots indicate the 2-year incidence of AML-t and lines extend to the 1-year and 3-year incidences (right). The outcome metrics on the full cohort are provided on top for comparison. P values are from the log-rank test (OS) and the Gray test (AML-t). ∗∗∗P < .001; ∗∗P < .01; ∗P < .05. (C) Distribution of the percentage of BM blast for 12 molecular groups with at least 10 patients within each subset of BM blast, that is, 0% to 5%, 5% to 10%, and 10% to 20% (left). Median survival (dots) and interquartile range (lines) for each blast subset within each molecular group (right). P values are from a univariate Cox model with the 0% to 5% blast subset used as the reference level. The distributions of the full cohort are provided on top for comparison. (D) Cumulative incidence curves of AML-t stratified with the range of percentage of BM blast within the DDX41 and AML-like subgroups. P values are from the Gray test. (E) Kaplan-Meier probability estimates of OS stratified with the range of percentage of BM blast within the EZH2-ASXL1 and −7/SETBP1 subgroups. P values are from the log-rank test. CI, confidence interval; HR, hazard ratio; ref, reference level.
Figure 5.
Figure 5.
Genetic heterogeneity of s/t-MDS. (A) Prevalence of molecular groups in 267 patients with s/t-MDS. (B) Proportion of primary (red) and s/t-MDS (blue) within each molecular group and comparison with the full cohort (top). (C) Distribution of the number of mutated genes per patient in primary or s/t-MDS within each molecular group (TP53-complex, −7/SETBP1, SF3B1, and IDH-STAG2), showing similar molecular complexity of the 2 disease subsets. For example, the median number of mutated genes per patient was equal to 2 for both primary and s/t-MDS within TP53-complex, whereas it was equal to 5 for both subsets within IDH-STAG2. (D) Age distribution in primary or s/t-MDS within each molecular group. (E) Kaplan-Meier probability estimates of OS for primary or s/t-MDS within each molecular group. P values are from the log-rank test.
Figure 5.
Figure 5.
Genetic heterogeneity of s/t-MDS. (A) Prevalence of molecular groups in 267 patients with s/t-MDS. (B) Proportion of primary (red) and s/t-MDS (blue) within each molecular group and comparison with the full cohort (top). (C) Distribution of the number of mutated genes per patient in primary or s/t-MDS within each molecular group (TP53-complex, −7/SETBP1, SF3B1, and IDH-STAG2), showing similar molecular complexity of the 2 disease subsets. For example, the median number of mutated genes per patient was equal to 2 for both primary and s/t-MDS within TP53-complex, whereas it was equal to 5 for both subsets within IDH-STAG2. (D) Age distribution in primary or s/t-MDS within each molecular group. (E) Kaplan-Meier probability estimates of OS for primary or s/t-MDS within each molecular group. P values are from the log-rank test.
Figure 6.
Figure 6.
Genetic heterogeneity of MDS/MPN with ubiquitous RAS pathway mutations enrichment. (A) Prevalence of molecular groups in 536 patients with MDS/MPN color-coded by specific subtypes. The bi-TET2 group accounted for 33% of MDS/MPN cases and 42% (168/399) of CMML cases. The EZH2-ASXL1 group comprised 8% of MDS/MPN cases and 26% (10/38) of atypical chronic myeloid leukemia (aCML) cases. The majority of MDS/MPN with ring sideroblasts and thrombocytosis (MDS/MPN-RS-T) cases (63%, 27/43) were part of the SF3B1 group. (B) Proportion of MDS/MPN (green) and MDS (blue) within each molecular group and comparison with the full cohort (top). (C) Oncoplots for each molecular group (−7/SETBP1, EZH2-ASXL1, IDH-STAG2, and bi-TET2) separating MDS/MPN (green) and MDS (blue). Each column corresponds to a patient. The presence of a mutation in each gene for each patient is color-coded by the VAF (maximum VAF if several mutations within the same gene). RAS pathway mutations include mutations in N/KRAS, CBL, NF1, and PTPN11. They were observed in 68%, 51%, 45%, and 40% of patients with MDS/MPN within groups −7/SETBP1, EZH2-ASXL1, IDH-STAG2, and bi-TET2, respectively, compared with 33%, 21%, 14%, and 15% of patients with MDS within the same groups. (D) Scatterplot representing 1 dot per patients with RAS pathway mutation, with the VAF of RAS pathway mutations on the x-axis and the maximum VAF of all other mutations in the same patient on the y-axis. (E) Monocyte level in 109/L as a function of the VAF of RAS pathway mutations in the subset of 297 patients with MDS/MPN from the same molecular groups as in panel C. (F) Median survival (dots) and interquartile range (lines) for MDS/MPN (green) and MDS (blue) within each molecular group. Patients from the bi-TET2 group had favorable OS (median, 5.5 and 3.9 years for MDS and MDS/MPN, respectively). Conversely, patients from the IDH-STAG2, EZH2-ASXL1, and −7/SETBP1 groups had dismal OS in both subsets (median, 2.1, 1.8, and 1.5 years, respectively, in MDS and 2.2, 1.1, and 2.0 years, respectively, in MDS/MPN).

Comment in

References

    1. Cazzola M. Myelodysplastic syndromes. N Engl J Med. 2020;383(14):1358–1374. - PubMed
    1. Papaemmanuil E, Gerstung M, Malcovati L, et al. Clinical and biological implications of driver mutations in myelodysplastic syndromes. Blood. 2013;122(22):3616–3699. - PMC - PubMed
    1. Haferlach T, Nagata Y, Grossmann V, et al. Landscape of genetic lesions in 944 patients with myelodysplastic syndromes. Leukemia. 2014;28(2):241–247. - PMC - PubMed
    1. Nazha A, Komrokji R, Meggendorfer M, et al. Personalized prediction model to risk stratify patients with myelodysplastic syndromes. J Clin Oncol. 2021;39(33):3737–3746. - PMC - PubMed
    1. Bersanelli M, Travaglino E, Meggendorfer M, et al. Classification and personalized prognostic assessment on the basis of clinical and genomic features in myelodysplastic syndromes. J Clin Oncol. 2021;39(11):1223–1233. - PMC - PubMed

Publication types