. 2024 Aug 22;144(8):873-887.
doi: 10.1182/blood.2024024499.

Efficacy of T-cell assays for the diagnosis of primary defects in cytotoxic lymphocyte exocytosis

Affiliations

Efficacy of T-cell assays for the diagnosis of primary defects in cytotoxic lymphocyte exocytosis

Samuel C C Chiang et al. Blood. .

Abstract

Primary hemophagocytic lymphohistiocytosis (HLH) is a life-threatening disorder associated with autosomal recessive variants in genes required for perforin-mediated lymphocyte cytotoxicity. A rapid diagnosis is crucial for successful treatment. Although defective cytotoxic T lymphocyte (CTL) function causes pathogenesis, quantification of natural killer (NK)-cell exocytosis triggered by K562 target cells currently represents a standard diagnostic procedure for primary HLH. We have prospectively evaluated different lymphocyte exocytosis assays in 213 patients referred for evaluation for suspected HLH and related hyperinflammatory syndromes. A total of 138 patients received a molecular diagnosis consistent with primary HLH. Assessment of Fc receptor-triggered NK-cell and T-cell receptor (TCR)-triggered CTL exocytosis displayed higher sensitivity and improved specificity for the diagnosis of primary HLH than routine K562 cell-based assays, with these assays combined providing a sensitivity of 100% and specificity of 98.3%. By comparison, NK-cell exocytosis after K562 target cell stimulation displayed a higher interindividual variability, in part explained by differences in NK-cell differentiation or large functional reductions after shipment. We thus recommend combined analysis of TCR-triggered CTL and Fc receptor-triggered NK-cell exocytosis for the diagnosis of patients with suspected familial HLH or atypical manifestations of congenital defects in lymphocyte exocytosis.


Conflict of interest statement

Conflict-of-interest disclosure: The authors declare no competing financial interests.

A complete list of all pHLH collaborators appears in “Appendix.”

Figures

None
Graphical abstract
Figure 1.
Figure 1.
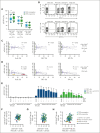
Analysis of experimental interassay variability in evaluation of cytotoxic lymphocyte exocytosis. (A) PBMCs from 198 healthy adult volunteers were incubated for 3 hours in medium or with target cells and monoclonal antibodies (mAbs) as indicated. Induced CD107a surface expression (ΔCD107a) values for distinct cytotoxic lymphocyte subsets and stimulations, as indicated, in 198 healthy adult volunteers. Graph depicts mean values with bars indicating standard deviation (SD). (B-F) Compiled induced CD107a surface expression values for distinct cytotoxic lymphocyte subsets and stimulations, as indicated, from 2 healthy adult volunteers run 17 (donor 1) and 23 times (donor 2) using multiple frozen PBMC vials thawed over a period of 3 months. Samples were run using the same exocytosis protocol. Shown are the ΔCD107a for CD3CD56dim NK cells after K562 or anti-CD16 stimulation and CD8+CD57+ T cells (CTL) after anti-CD3 stimulation. Results plotted against time for donor 1 (B) and donor 2 (C), displaying results of the 3 different exocytosis stimulations. The same data were normalized by dividing each value by respective mean and plotted against time for donor 1 (D) and donor 2 (E), demonstrating the range of deviation for each assay and donor. (F) Accumulated normalized data for each assay. Bars indicate SD.
Figure 2.
Figure 2.
Analysis of the variability in cytotoxic lymphocyte exocytosis in healthy adults. (A-H) PBMCs from 198 healthy adult volunteers were incubated for 3 hours in medium or with target cells and mAbs as indicated. (A) Graph displays levels of exocytosis in CD8+CD57+ T cells or CD3CD56dim NK cells stratified according to CMV serostatus. Boxes and whiskers display quartiles, limits, as well as outliers, with plus signs representing means. Pairs statistically different by Student t test are indicated. (B) Flow cytometry plots show CD3CD56dim NK-cell CD107a surface expression in relation to intracellular expression of FcεRγ or EAT-2, after indicated stimulations. The percentages of cells in each quadrant are indicated. Only 5.4% of FcεRγ NK cells exocytosed after K562 stimulation, compared with 21.7% of FcεRγ+ NK cells. Similarly, 6.7% of EAT-2 NK cells exocytosed when stimulated with K562, compared with 25% of EAT-2+ NK cells. (C-D) Graphs displaying the relationship between CD3CD56dim NK-cell–induced CD107a surface expression and frequencies of cells lacking expression of FcεRγ, EAT-2, or SYK after stimulation with P815 cells added anti-CD16 mAb (C) or K562 cells (D). Diagonal lines represent linear regression and with 95% confidence intervals in bold, whereas the dashed horizontal line indicates the cutoff percentage deemed abnormal in regard to K562 cell–induced NK-cell exocytosis. (E) The graph depicts frequencies of CD107a-expressing NK cells according to stimulation and expression of FcεRγ, SYK, and EAT-2 in CD3CD56dim NK-cell subsets, with bars representing SD. (F-H) Graphs correlating exocytic responses in cytotoxic lymphocyte subsets in healthy individuals, as specified. Donors with low CD107a response after K562 stimulation and expanded FcεRγ NK-cell populations are highlighted with red and orange dots, whereas donors with low CD107a responses to anti-CD3 and anti-CD16 are highlighted with blue dots.
Figure 3.
Figure 3.
Exocytosis is defective in cytotoxic lymphocytes of FHL3-5, CHS, and GS2 patients. (A-C) Percentages of CD8+CD57+ T cells (A) or CD3CD56dim NK cells (B-C) expressing surface CD107a after incubation with P815 cells with anti-CD3 antibody (A), P815 cells with anti-CD16 antibody (B), or K562 cells (C), shown for 5 different groups, as indicated. Values represent the difference in CD107a levels of stimulated against control unstimulated cells. Boxes display quartiles and whiskers display 2.5th and 97.5th percentiles, as well as outliers. Student t test comparing EXO against the other groups; ∗∗∗∗P < .0001. (D-E) Exocytosis data of specific patient categories from the “impaired exocytosis” and “other IEI patients” groups are shown individually. Each individual patient value is represented by a symbol, with violin plots indicating quartiles. Colored markings depict normal ranges from 198 healthy adults, with boxes displaying quartiles and whiskers displaying 2.5th and 97.5th percentiles. (E) Student t test comparing patients with 198 heathy adult controls; n.s., not significant; ∗P < .05; ∗∗P < .01; ∗∗∗∗P < .0001. CHS, Chediak-Higashi syndrome; FHL3, familial hemophagocytic lymphohistioccytosis type 3; XLP1, X-linked lymphoproliferative disease type 2.
Figure 4.
Figure 4.
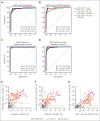
Combination receiver operating characteristic (ROC) curves from this study. (A-D) Combined ROC curves for different exocytosis stimulations (K562 cell stimulation for NK cells, anti-CD16 antibody for NK cells, and anti-CD3 antibody for CTL) when comparing 92 impaired exocytosis (EXO) patients against 4 other control groups consisting of 58 other IEI patients (A), 63 hyperinflammatory (HYPINF) patients (B), 198 healthy adults controls (C), or 84 healthy adults transport controls (D). Cutoff values with sensitivity and specificity are indicated in brackets for each comparison. (E-F) Plots show exocytosis values for different cytotoxic lymphocyte subsets and stimulations, as indicated. Each circle represents an individual patient color coded according to indicated key.
Figure 5.
Figure 5.
Proposed laboratory diagnostic algorithm for patients presenting with HLH. Because the spectrum and our understanding of primary diseases linked to HLH grow, laboratories would need to constantly update themselves with the latest diagnostic assays. It is recommended that individual laboratories conduct tests to determine local cutoff values for the respective assays. Functional XIAP assay should be considered in both males and females in light of recent findings,, reduced iNKT numbers a hallmark of ITK, but cautionary for SAP deficiency with highly variable levels in young children., Elevated α/β-DNT cells raise suspicion of ALPS. The total absence CD27 in all lymphocyte subgroups is indicative of its deficiency,, whereas absence of CD27 specifically in the B-cell compartment is characteristic of SAP deficiency. Although functional XIAP and NK/CTL exocytosis assays should be performed on heparinized blood, if EDTA blood is available, it is preferable for phenotyping tests (perforin, SAP, XIAP, CD27, and α/β-DNT) because it is more stable with transport, can be used for DNA extraction, and plasma collected for analyzing cytokine levels. ALPS, autoimmune lymphoproliferative syndrome; DNT, double negative T cells; iNKT, invariant NK T cells; ITK, interleukin-2–inducible T-cell kinase; SAP, SLAM-associating protein; XIAP, X-linked inhibitor of apoptosis protein.

Comment in

References

    1. Henter JI, Horne A, Arico M, et al. HLH-2004: diagnostic and therapeutic guidelines for hemophagocytic lymphohistiocytosis. Pediatr Blood Cancer. 2007;48(2):124–131. - PubMed
    1. Jordan MB, Allen CE, Greenberg J, et al. Challenges in the diagnosis of hemophagocytic lymphohistiocytosis: recommendations from the North American Consortium for Histiocytosis (NACHO) Pediatr Blood Cancer. 2019;66(11) - PMC - PubMed
    1. Canna SW, Marsh RA. Pediatric hemophagocytic lymphohistiocytosis. Blood. 2020;135(16):1332–1343. - PMC - PubMed
    1. Chinnici A, Beneforti L, Pegoraro F, et al. Approaching hemophagocytic lymphohistiocytosis. Front Immunol. 2023;14 - PMC - PubMed
    1. Chattopadhyay PK, Betts MR, Price DA, et al. The cytolytic enzymes granyzme A, granzyme B, and perforin: expression patterns, cell distribution, and their relationship to cell maturity and bright CD57 expression. J Leukoc Biol. 2009;85(1):88–97. - PMC - PubMed

Publication types

MeSH terms

Substances