. 2024 Jul;28(13):e18516.
doi: 10.1111/jcmm.18516.

Integrating machine learning and single-cell analysis to uncover lung adenocarcinoma progression and prognostic biomarkers

Affiliations

Integrating machine learning and single-cell analysis to uncover lung adenocarcinoma progression and prognostic biomarkers

Pengpeng Zhang et al. J Cell Mol Med. 2024 Jul.

Abstract

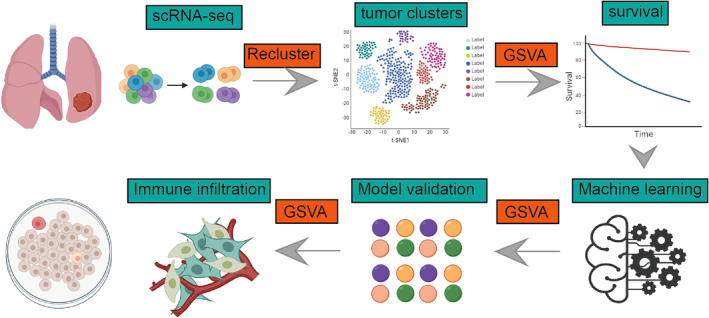
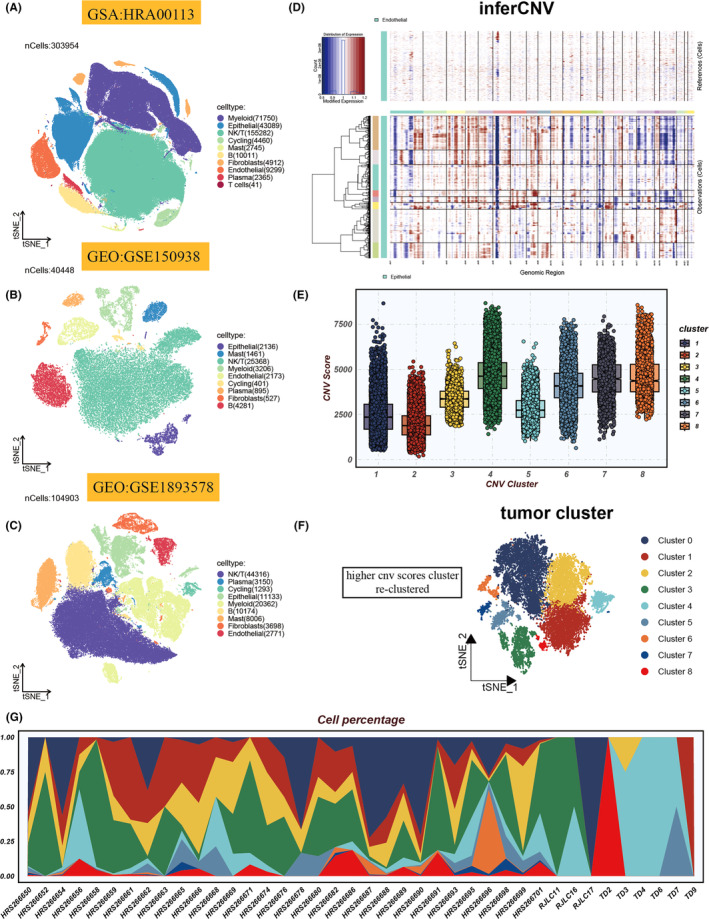
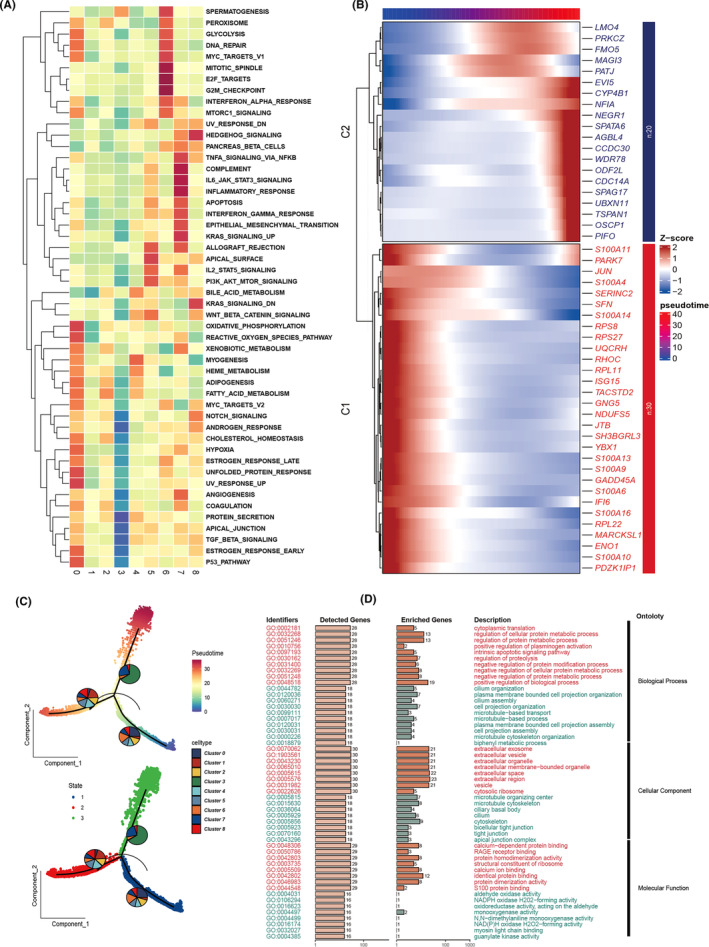
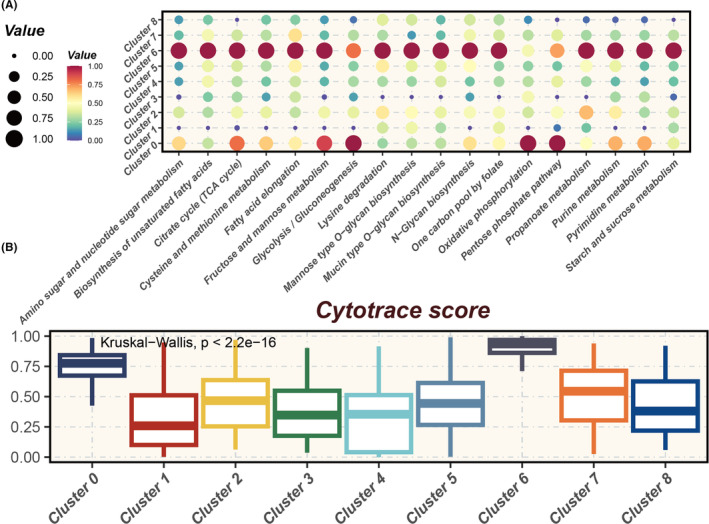
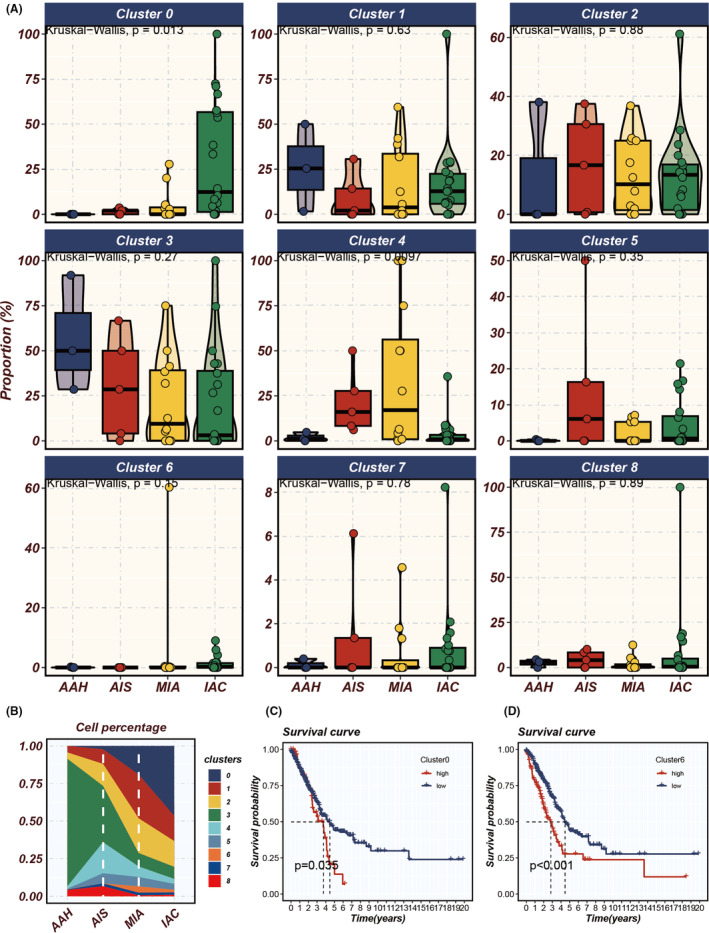
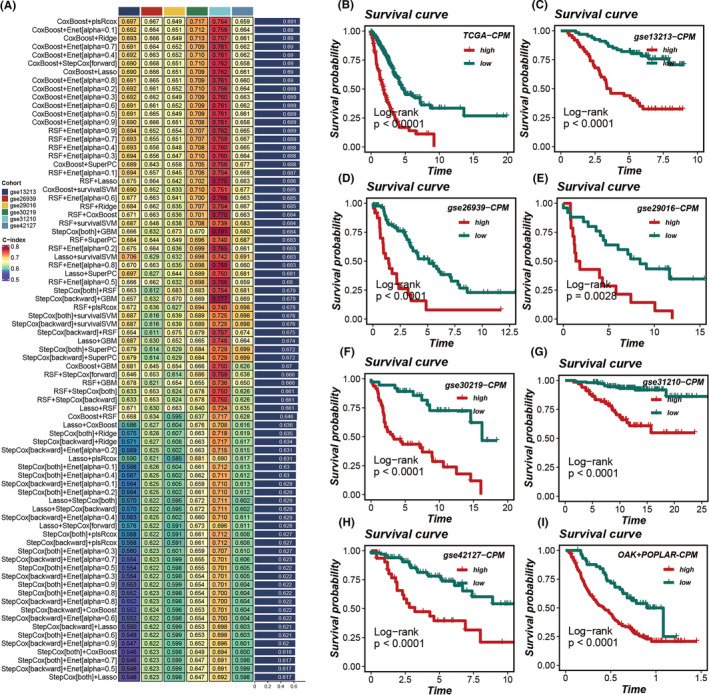
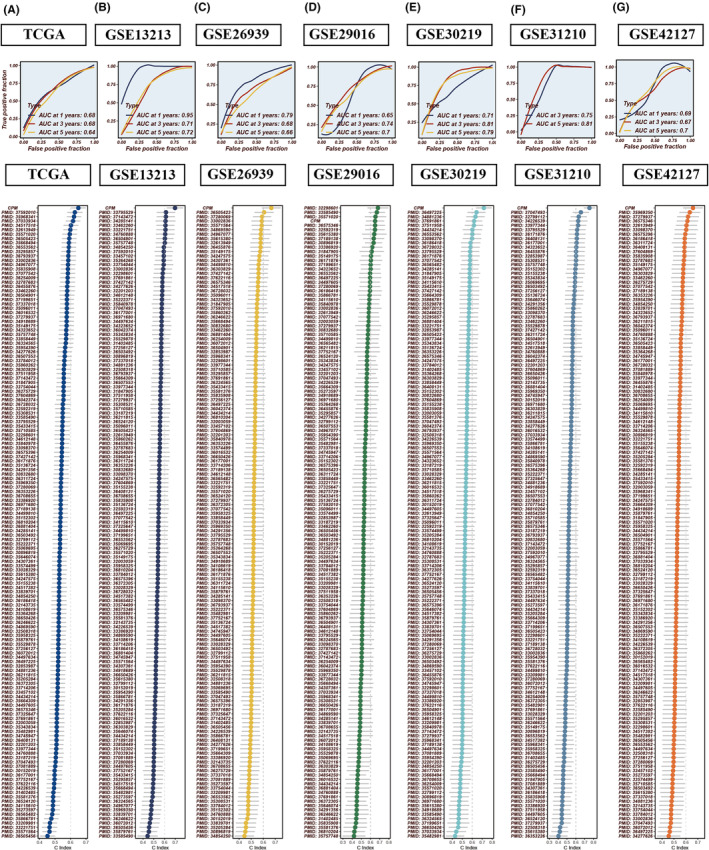
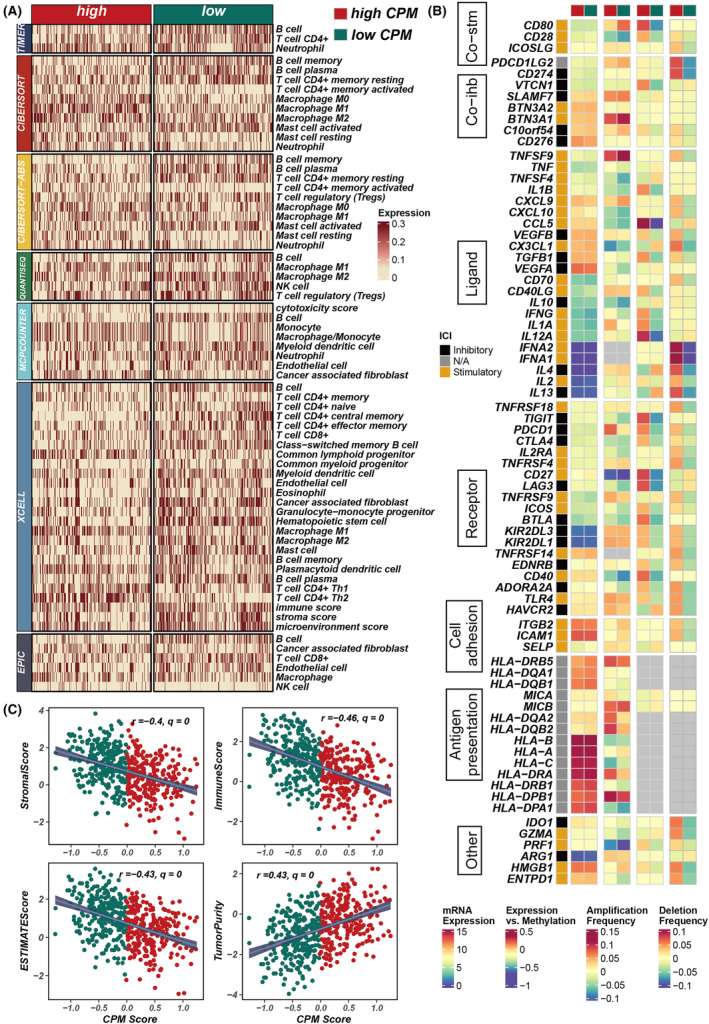
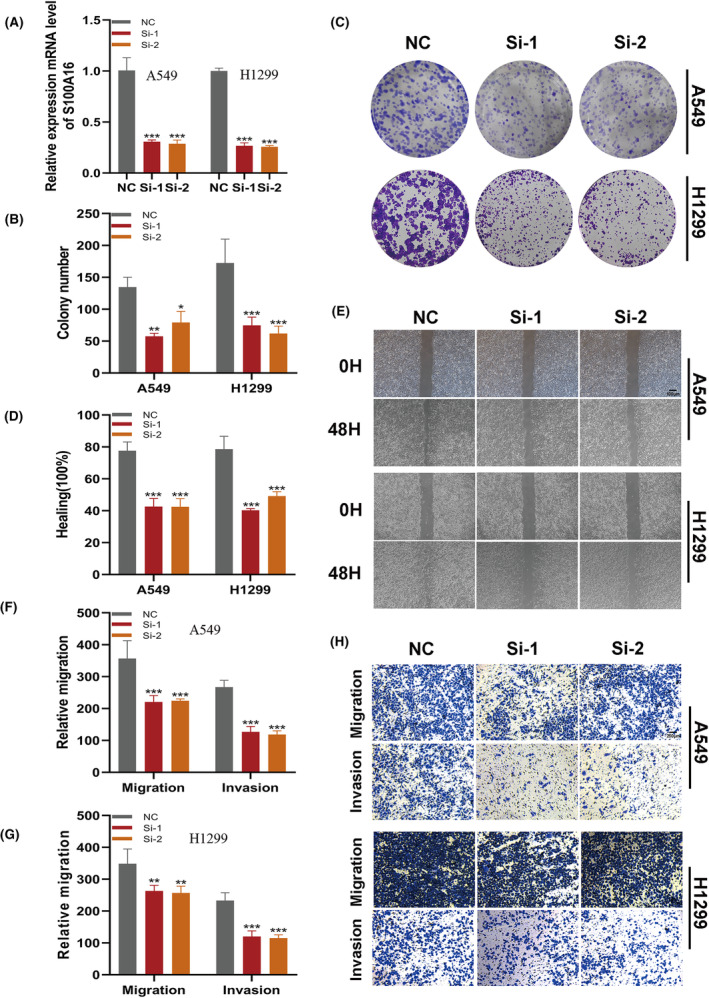
The progression of lung adenocarcinoma (LUAD) from atypical adenomatous hyperplasia (AAH) to invasive adenocarcinoma (IAC) involves a complex evolution of tumour cell clusters, the mechanisms of which remain largely unknown. By integrating single-cell datasets and using inferCNV, we identified and analysed tumour cell clusters to explore their heterogeneity and changes in abundance throughout LUAD progression. We applied gene set variation analysis (GSVA), pseudotime analysis, scMetabolism, and Cytotrace scores to study biological functions, metabolic profiles and stemness traits. A predictive model for prognosis, based on key cluster marker genes, was developed using CoxBoost and plsRcox (CPM), and validated across multiple cohorts for its prognostic prediction capabilities, tumour microenvironment characterization, mutation landscape and immunotherapy response. We identified nine distinct tumour cell clusters, with Cluster 6 indicating an early developmental stage, high stemness and proliferative potential. The abundance of Clusters 0 and 6 increased from AAH to IAC, correlating with prognosis. The CPM model effectively distinguished prognosis in immunotherapy cohorts and predicted genomic alterations, chemotherapy drug sensitivity, and immunotherapy responsiveness. Key gene S100A16 in the CPM model was validated as an oncogene, enhancing LUAD cell proliferation, invasion and migration. The CPM model emerges as a novel biomarker for predicting prognosis and immunotherapy response in LUAD patients, with S100A16 identified as a potential therapeutic target.

Keywords: S100A16; immunotherapy response; lung adenocarcinoma; machine learning; single‐cell analysis.


Conflict of interest statement

It is hereby declared by the authors that the research was carried out without the presence of any potential conflict of interest arising from commercial or financial relationships.

Figures

FIGURE 1
FIGURE 1
Utilizing single‐cell data, we analysed the heterogeneity of different subgroups of tumour cells in lung adenocarcinoma and constructed a model using machine learning. Ultimately, through experimental validation, S100A16 was identified as a potential therapeutic target for lung adenocarcinoma.
FIGURE 2
FIGURE 2
Cellular heterogeneity and genomic alterations in single‐cell analyses. (A–C) t‐distributed stochastic neighbour embedding (tSNE) visualizations highlight cell type distributions within HRA00113, GSE150938 and GSE189357 scRNA‐seq cohorts. (D) A heatmap delineates cell‐wise genomic copy number variations (CNVs), calculated from gene expression proximal to chromosomal loci, with amplifications in red and deletions in blue. (E) Box plots reveal CNV patterns across eight identified clusters. (F) tSNE plot illustrates the spatial distribution of tumour subgroups. (G) The relative abundance of nine tumour cell clusters across various samples is depicted.
FIGURE 3
FIGURE 3
Decoding tumour cell cluster dynamics. (A) Enrichment analysis across distinct tumour cell clusters using Gene Set Variation Analysis (GSVA), visualized through a heatmap. (B) Expression dynamics across pseudotime are depicted in a heatmap, showcasing gene expression intensity variations. (C) Developmental trajectories of various tumour cell clusters are illustrated via pseudotime analysis, with cells colour‐coded based on tumour clusters or progression through pseudotime. (D) Gene ontology (GO) enrichment analysis identifies and highlights enriched pathways in genes from Clusters 1 and 2 as shown in (B), covering aspects of biological process (BP), cellular component (CC) and molecular function (MF).
FIGURE 4
FIGURE 4
Metabolic heterogeneity and stemness potential across tumour clusters. (A) Bubble chart illustrating metabolic heterogeneity across various tumour clusters, highlighting differential metabolic activity within the tumour microenvironment. (B) Cytotrace analysis depicting Cytotrace scores for different tumour clusters, where higher scores indicate cells with greater stemness and differentiation potential.
FIGURE 5
FIGURE 5
Analysing tumour cluster dynamics and survival impact in LUAD progression. (A) Proportional variations of different tumour clusters throughout the progression of LUAD (from atypical adenomatous hyperplasia [AAH] to adenocarcinoma in situ [AIS], minimally invasive adenocarcinoma [MIA] and finally to invasive adenocarcinoma [IAC]). (B) The prevalence of distinct tumour cell clusters during the progression stages. (C, D) Single‐sample Gene Set Enrichment Analysis (ssGSEA) assessing the impact of the abundance of Clusters 0 and 6 on the survival of patients with LUAD, where higher abundance indicates poorer prognosis.
FIGURE 6
FIGURE 6
Construction and validation of the prognostic model. (A) Development of the prognostic model utilizing 10 machine learning approaches, with the concordance index (C‐index) serving as the evaluation metric; the CoxBoost and plsRcox algorithms were identified as the superior composite prognostic model (CPM). (B–H) Survival curves for patients categorized into high versus low CPM groups across seven cohorts, with p‐values determined using the log‐rank method to assess statistical significance. (I) Calculation of CPM scores within the immunotherapy cohort using the model's formula, followed by an assessment of their prognostic relevance.
FIGURE 7
FIGURE 7
Comparative prognostic performance of CPM against established models. (A–G) receiver operating characteristic (ROC) curves evaluating the CPM within the TCGA, GSE13213, GSE26939, GSE29016, GSE30219, GSE31210 and GSE42127 LUAD datasets. When benchmarked against 144 previously published prognostic models for LUAD, the CPM showcases enhanced prognostic accuracy.
FIGURE 8
FIGURE 8
Assessment of immune infiltration and correlation with CPM scores in LUAD. (A) A heatmap illustrating the variance in immune infiltration scores between groups with high and low CPM scores. (B) Analysis depicting the relationship between CPM scores and the expression of immune‐related genes. (C) Scatter plots revealing the associations between CPM scores and various tumour microenvironment metrics, including stromal scores, immune scores, ESTIMATE scores and tumour purity.
FIGURE 9
FIGURE 9
Validation of S100A16's oncogenic role in LUAD through targeted knockdown. (A) Reduction in S100A16 expression in A549 and H1299 cells post‐S100A16 knockdown. (B, C) Colony formation assays demonstrating that S100A16 knockdown notably inhibits LUAD cell proliferation. (D, E) Wound healing assays assess the migratory potential of A549 and H1299 cells following si‐S100A16 transfection. (F‐H) Transwell assays evaluate the migration and invasion capabilities of S100A16‐knockdown A549 and H1299 cells.

References

    1. Sung H, Ferlay J, Siegel RL, et al. Global cancer statistics 2020: GLOBOCAN estimates of incidence and mortality worldwide for 36 cancers in 185 countries. CA Cancer J Clin. 2021;3:209‐249. - PubMed
    1. Thai AA, Solomon BJ, Sequist LV, Gainor JF, Heist RS. Lung cancer. Lancet. 2021;398(10299):535‐554. - PubMed
    1. Schabath MB, Cote ML. Cancer progress and priorities: lung cancer. Cancer Epidemiol Biomarkers Prev. 2019;28(10):1563‐1579. - PMC - PubMed
    1. Yoshizawa A, Motoi N, Riely GJ, et al. Impact of proposed IASLC/ATS/ERS classification of lung adenocarcinoma: prognostic subgroups and implications for further revision of staging based on analysis of 514 stage I cases. Mod Pathol. 2011;24(5):653‐664. - PubMed
    1. Travis WD, Brambilla E, Noguchi M, et al. International association for the study of lung cancer/american thoracic society/european respiratory society international multidisciplinary classification of lung adenocarcinoma. J Thorac Oncol. 2011;6(2):244‐285. - PMC - PubMed

Substances