. 2025 Jan;62(1):1094-1111.
doi: 10.1007/s12035-024-04306-1. Epub 2024 Jul 3.

Morphological and Molecular Characteristics of Perineuronal Nets in the Human Prefrontal Cortex-A Possible Link to Microcircuitry Specialization

Affiliations

Morphological and Molecular Characteristics of Perineuronal Nets in the Human Prefrontal Cortex-A Possible Link to Microcircuitry Specialization

Ivan Banovac et al. Mol Neurobiol. 2025 Jan.

Abstract

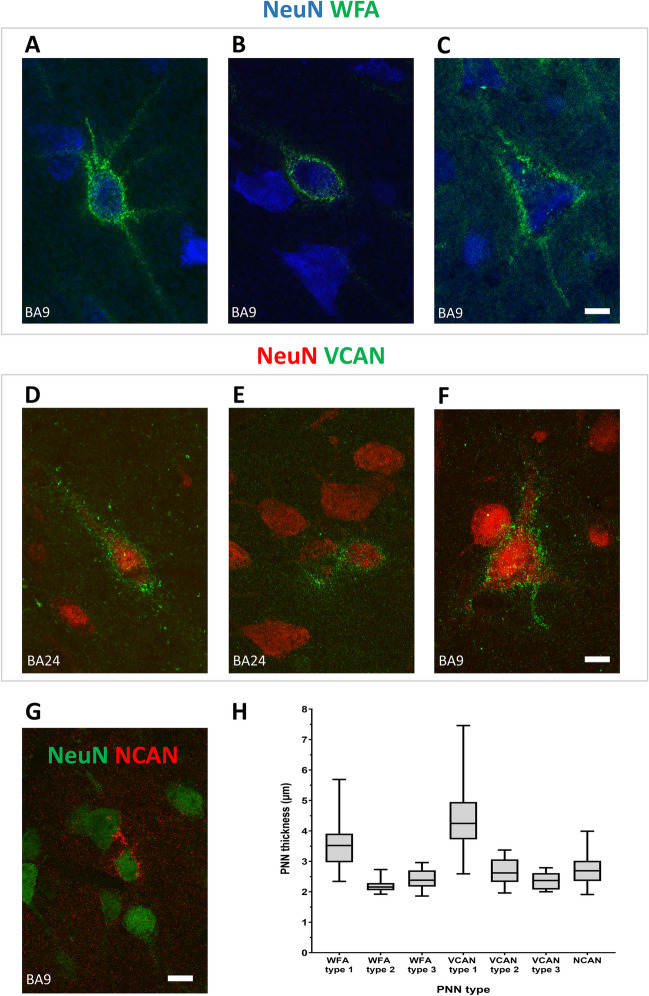
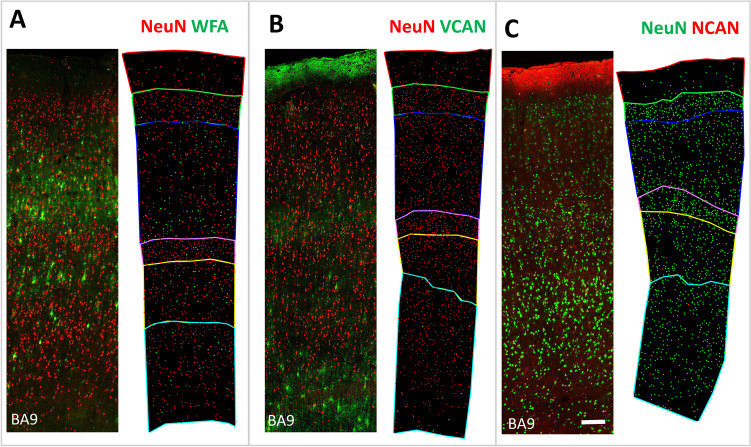
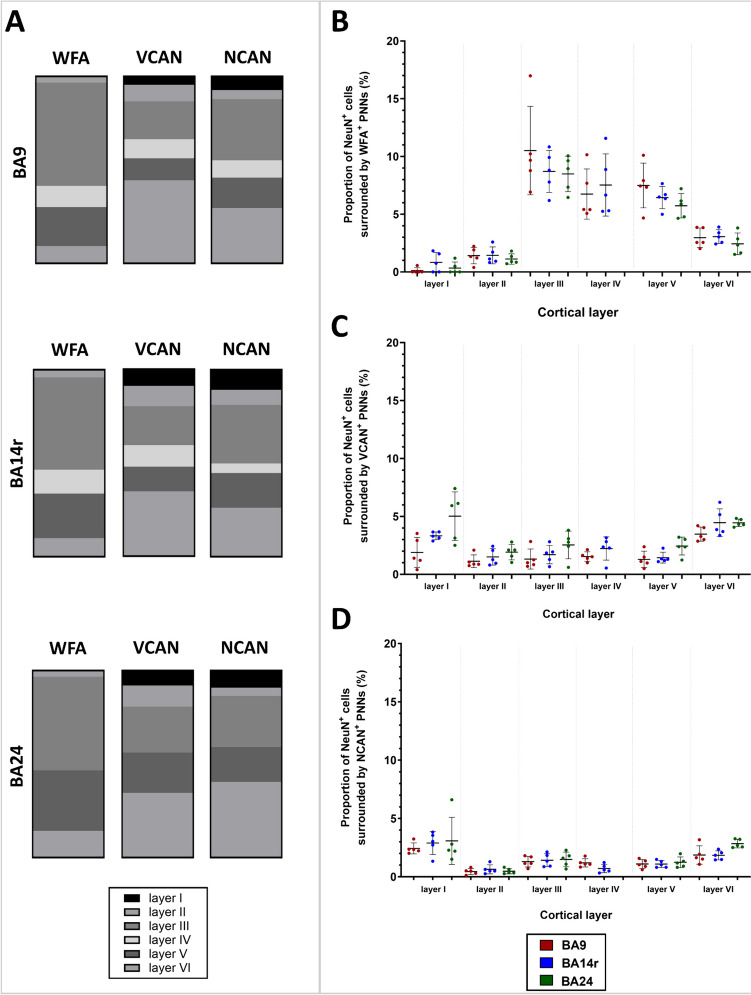
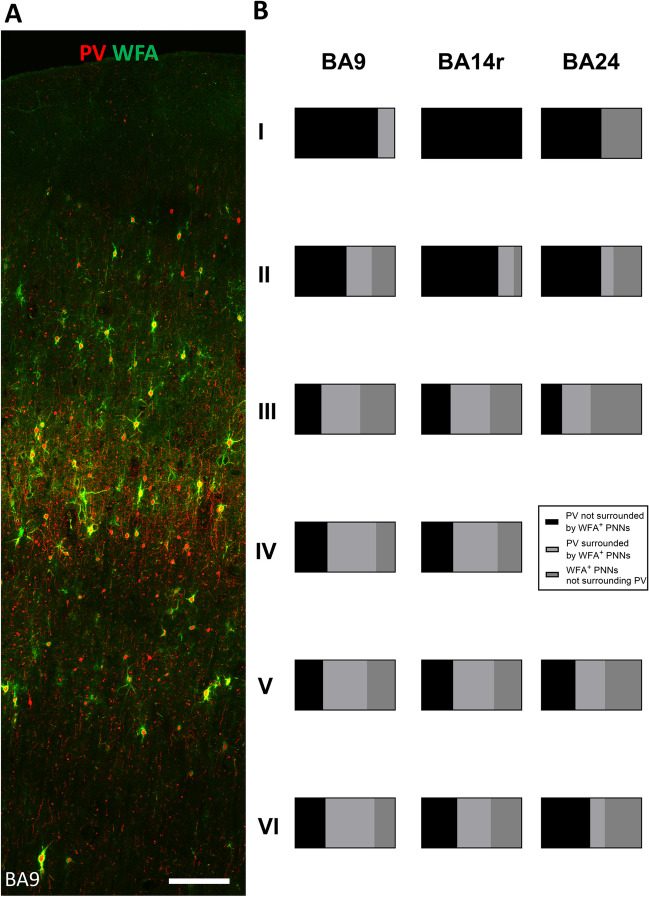
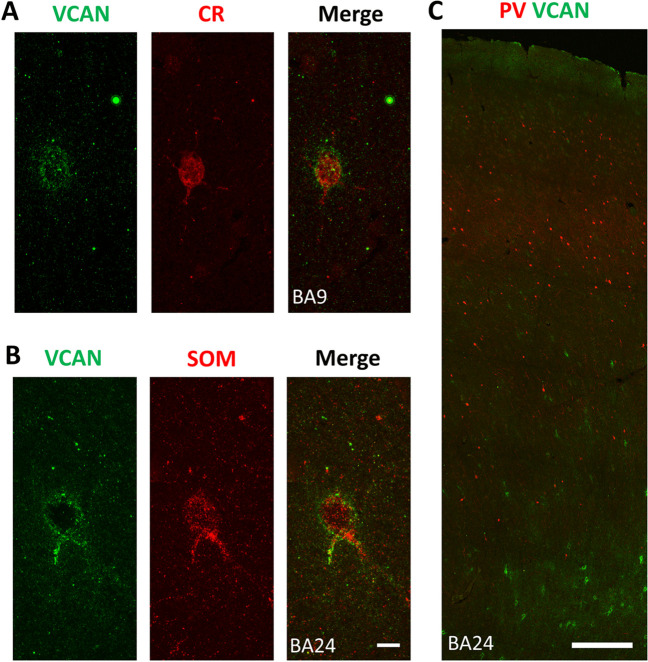
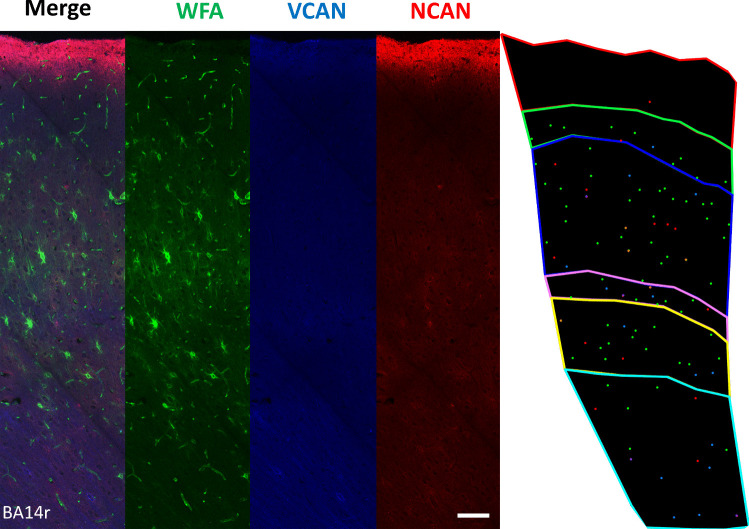
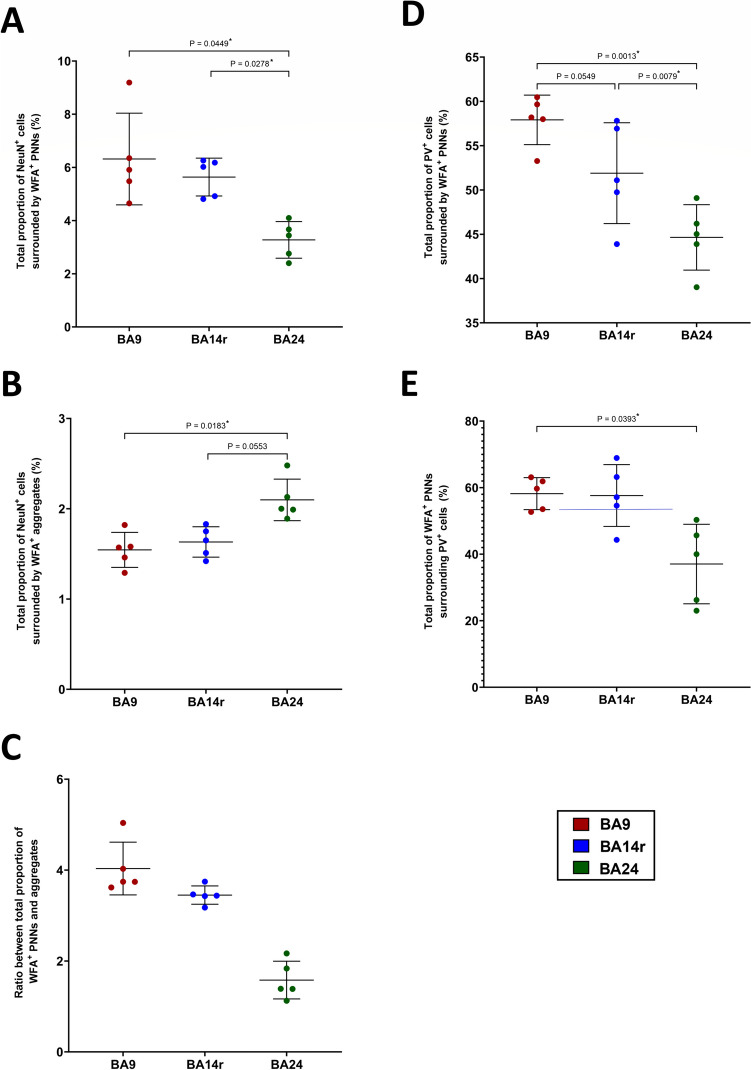
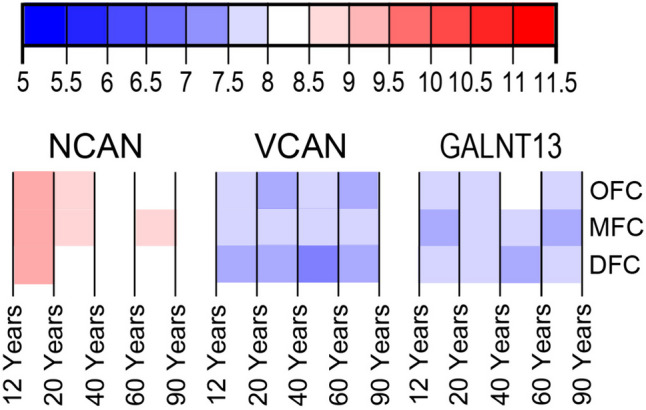
Perineuronal nets (PNNs) are a type of extracellular matrix (ECM) that play a significant role in synaptic activity and plasticity of interneurons in health and disease. We researched PNNs' regional and laminar representation and molecular composition using immunohistochemistry and transcriptome analysis of Brodmann areas (BA) 9, 14r, and 24 in 25 human postmortem brains aged 13-82 years. The numbers of VCAN- and NCAN-expressing PNNs, relative to the total number of neurons, were highest in cortical layers I and VI while WFA-binding (WFA+) PNNs were most abundant in layers III-V. The ECM glycosylation pattern was the most pronounced regional difference, shown by a significantly lower proportion of WFA+ PNNs in BA24 (3.27 ± 0.69%) compared to BA9 (6.32 ± 1.73%; P = 0.0449) and BA14 (5.64 ± 0.71%; P = 0.0278). The transcriptome of late developmental and mature stages revealed a relatively stable expression of PNN-related transcripts (log2-transformed expression values: 6.5-8.5 for VCAN and 8.0-9.5 for NCAN). Finally, we propose a classification of PNNs that envelop GABAergic neurons in the human cortex. The significant differences in PNNs' morphology, distribution, and molecular composition strongly suggest an involvement of PNNs in specifying distinct microcircuits in particular cortical regions and layers.

Keywords: Extracellular matrix; GABA; Interneurons; Neurocan; Versican.


Conflict of interest statement

Declarations. Ethics Approval: This study was approved by the Ethics Committee of Zagreb University School of Medicine (380-59-10106-14-55/152). Consent to Participate: Not applicable. Consent for Publication: Not applicable. Competing Interests: The authors declare no competing interests.

Figures

Fig. 1
Fig. 1
Morphological types of PNNs in the human PFC. A WFA+ type 1 PNN surrounding a circular NeuN+ cell in layer III of BA9. This PNN type envelops the cell body and the cellular processes beyond the first branching point. B WFA+ type 2 PNN surrounding a circular NeuN+ cell in layer III of BA9. This PNN type is thinner and envelops only the cell body and the most proximal parts of the cellular processes before the first branching point. C WFA+ type 3 PNN surrounding a pyramidal NeuN+ cell in layer III of BA9. This PNN type, similar to type 2, envelops only the cell body and the most proximal parts of the cellular processes. D VCAN+ type 1 PNN surrounding a fusiform NeuN+ cell in layer VI of BA24. As with all VCAN+ PNNs, the PNN envelops only the cell body and the most proximal parts of the cellular processes. This PNN type is the thickest type of VCAN+ PNNs and is present predominantly in the infragranular cortical layers. E VCAN+ type 2 PNN surrounding a circular NeuN+ cell in layer III of BA24. This PNN type is thinner and present predominantly in the granular and supragranular cortical layers. F VCAN+ type 3 PNN surrounding a pyramidal NeuN+ cell in layer V of BA9. This PNN type was rather scarce and found only in infragranular layers. G NCAN+ PNN in layer III of BA9. NCAN+ PNNs were thin and enveloped only the cell body and the most proximal parts of the cellular processes. Scale bar for all panels: 10 μm. H Box plots displaying the measured thickness of different types of PNNs. Error bars represent the maximum and minimum values
Fig. 2
Fig. 2
Laminar distribution of different types of ECM markers in the human PFC. A NeuN/WFA, B NeuN/VCAN, and C NeuN/NCAN double labeling in BA9 with corresponding dot plots showing the distribution of NeuN+ cells and PNNs in different cortical layers. It is visible that WFA+ PNNs were the most numerous and that they are present in all cortical layers, including sporadically in layer I. Most WFA+ PNNs were located in layers III and V. VCAN+ and NCAN+ PNNs were less numerous and mostly located in layer VI. Scale bar: 100 μm
Fig. 3
Fig. 3
Laminar distribution of different types of PNNs in the human PFC. A Bar graphs represent the proportion of PNNs in specific cortical layers in relation to the total number of PNNs in the cortex. Note the specific laminar distribution patterns of each ECM constituent as well as the specific distributions in BA24 reflective of the cytoarchitectonic structure of this region. Scatter plots showing the proportion of NeuN+ neurons surrounded by B WFA+ PNNs, C VCAN+ PNNs, and D NCAN+ PNNs in different cortical layers. Data are presented as mean ± SD. Note that almost 10% of cortical neurons in layers III, IV, and V were surrounded by WFA+ PNNs, while up to 5% of cortical neurons in layers I and VI were surrounded by either VCAN+ or NCAN+ PNNs
Fig. 4
Fig. 4
Co-localization of PV and WFA in the human PFC. A PV/WFA double labeling, BA9. Scale bar: 50 μm. It is evident that WFA+ PNNs enveloped a substantial number of PV+ neurons. However, there were also PV+ neurons not surrounded by WFA+ PNNs and WFA+ PNNs that did not envelop PV+ neurons. B Bar graphs represent the relative proportions of cells expressing only PV, cells only surrounded by WFA+ PNNs, and cells expressing PV and surrounded by WFA+ PNNs. Note the layer-specific relative proportions as well as the regional differences, which were most pronounced in layers II and VI
Fig. 5
Fig. 5
Co-localization of VCAN with different interneuron markers in the human PFC. A CR/VCAN double labeling in layer III of BA9, and B SOM/VCAN double labeling in layer V of BA24, showing co-localization. Scale bar for both panels: 10 μm. C PV/VCAN double labeling in BA24 showing no co-localization. Scale bar: 100 μm
Fig. 6
Fig. 6
Co-localization of NCAN with different interneuron markers in the human PFC. A SOM/NCAN double labeling in layer V of BA24, B CR/NCAN double labeling in layer V of BA9, and C PV/NCAN double labeling in layer III of BA9 showing co-localization. Scale bar for all panels: 10 μm
Fig. 7
Fig. 7
WFA/VCAN/NCAN triple-labeling immunofluorescence in BA14r with corresponding dot plot. Green markers on the dot plot represent WFA+ PNNs, blue markers represent VCAN+ PNNs, and red markers represent NCAN+ PNNs. Orange markers represent WFA/NCAN co-localization, while purple markers represent VCAN/NCAN co-localization. No WFA/VCAN co-localization was found. Scale bar: 100 μm
Fig. 8
Fig. 8
Regional differences in the expression of WFA. Scatter plots representing the A proportion of NeuN+ cells surrounded by WFA+ PNNs, B proportion of NeuN+ cells surrounded by WFA+ aggregates, C ratio between WFA+ PNNs and WFA+ aggregates, D proportion of PV+ cells surrounded by WFA+ PNNs, and E WFA+ PNNs surrounding PV+ cells. Data are presented as mean ± SD, P-values shown from RM one-way ANOVA. Note the significantly lower proportion of WFA+ PNNs, significantly higher proportion of WFA+ aggregates, and significantly lower degree of PV/WFA co-localization in BA24
Fig. 9
Fig. 9
Heat map matrix displaying the log2-transformed signal intensity of NCAN, VCAN, and GALNT13 expression across three regions (DFC, MFC, and OFC) during the period from 12 to 90 years of age. The heat map color scale ranges from low (blue) to high (red). NCAN had the highest expression (ranging from 8.0 to 9.5 log2-transformed signal intensity) during adolescence, decreasing the fastest in the DFC and slowest in the MFC. VCAN expression was relatively stable (from 6.5 to 8.0 log2-transformed signal intensity), with the highest expression in the MFC and the lowest in the DFC. GALNT13 had the highest expression (from 7.0 to 8.5 log2-transformed signal intensity) out of all the GALNT genes (see Figure S5), particularly in the OFC

References

    1. Syková E, Nicholson C (2008) Diffusion in brain extracellular space. Physiol Rev 88:1277–1340. 10.1152/physrev.00027.2007 - PMC - PubMed
    1. Benarroch EE (2015) Extracellular matrix in the CNS: dynamic structure and clinical correlations. Neurology 85:1417–1427. 10.1212/WNL.0000000000002044 - PubMed
    1. Carulli D, Verhaagen J (2021) An extracellular perspective on CNS maturation: perineuronal nets and the control of plasticity. Int J Mol Sci 22. 10.3390/ijms22052434 - PMC - PubMed
    1. Jovanov Milošević N, Judaš M, Aronica E et al (2014) Neural ECM in laminar organization and connectivity development in healthy and diseased human brain. Prog Brain Res 214:159–178. 10.1016/B978-0-444-63486-3.00007-4 - PubMed
    1. Rauch U (2004) Extracellular matrix components associated with remodeling processes in the brain. Cell Mol Life Sci 61:2031–2045. 10.1007/s00018-004-4043-x - PMC - PubMed

LinkOut - more resources