. 2024 Jul 3;16(754):eadk3295.
doi: 10.1126/scitranslmed.adk3295. Epub 2024 Jul 3.

Tissue-based T cell activation and viral RNA persist for up to 2 years after SARS-CoV-2 infection

Affiliations

Tissue-based T cell activation and viral RNA persist for up to 2 years after SARS-CoV-2 infection

Michael J Peluso et al. Sci Transl Med. .

Abstract

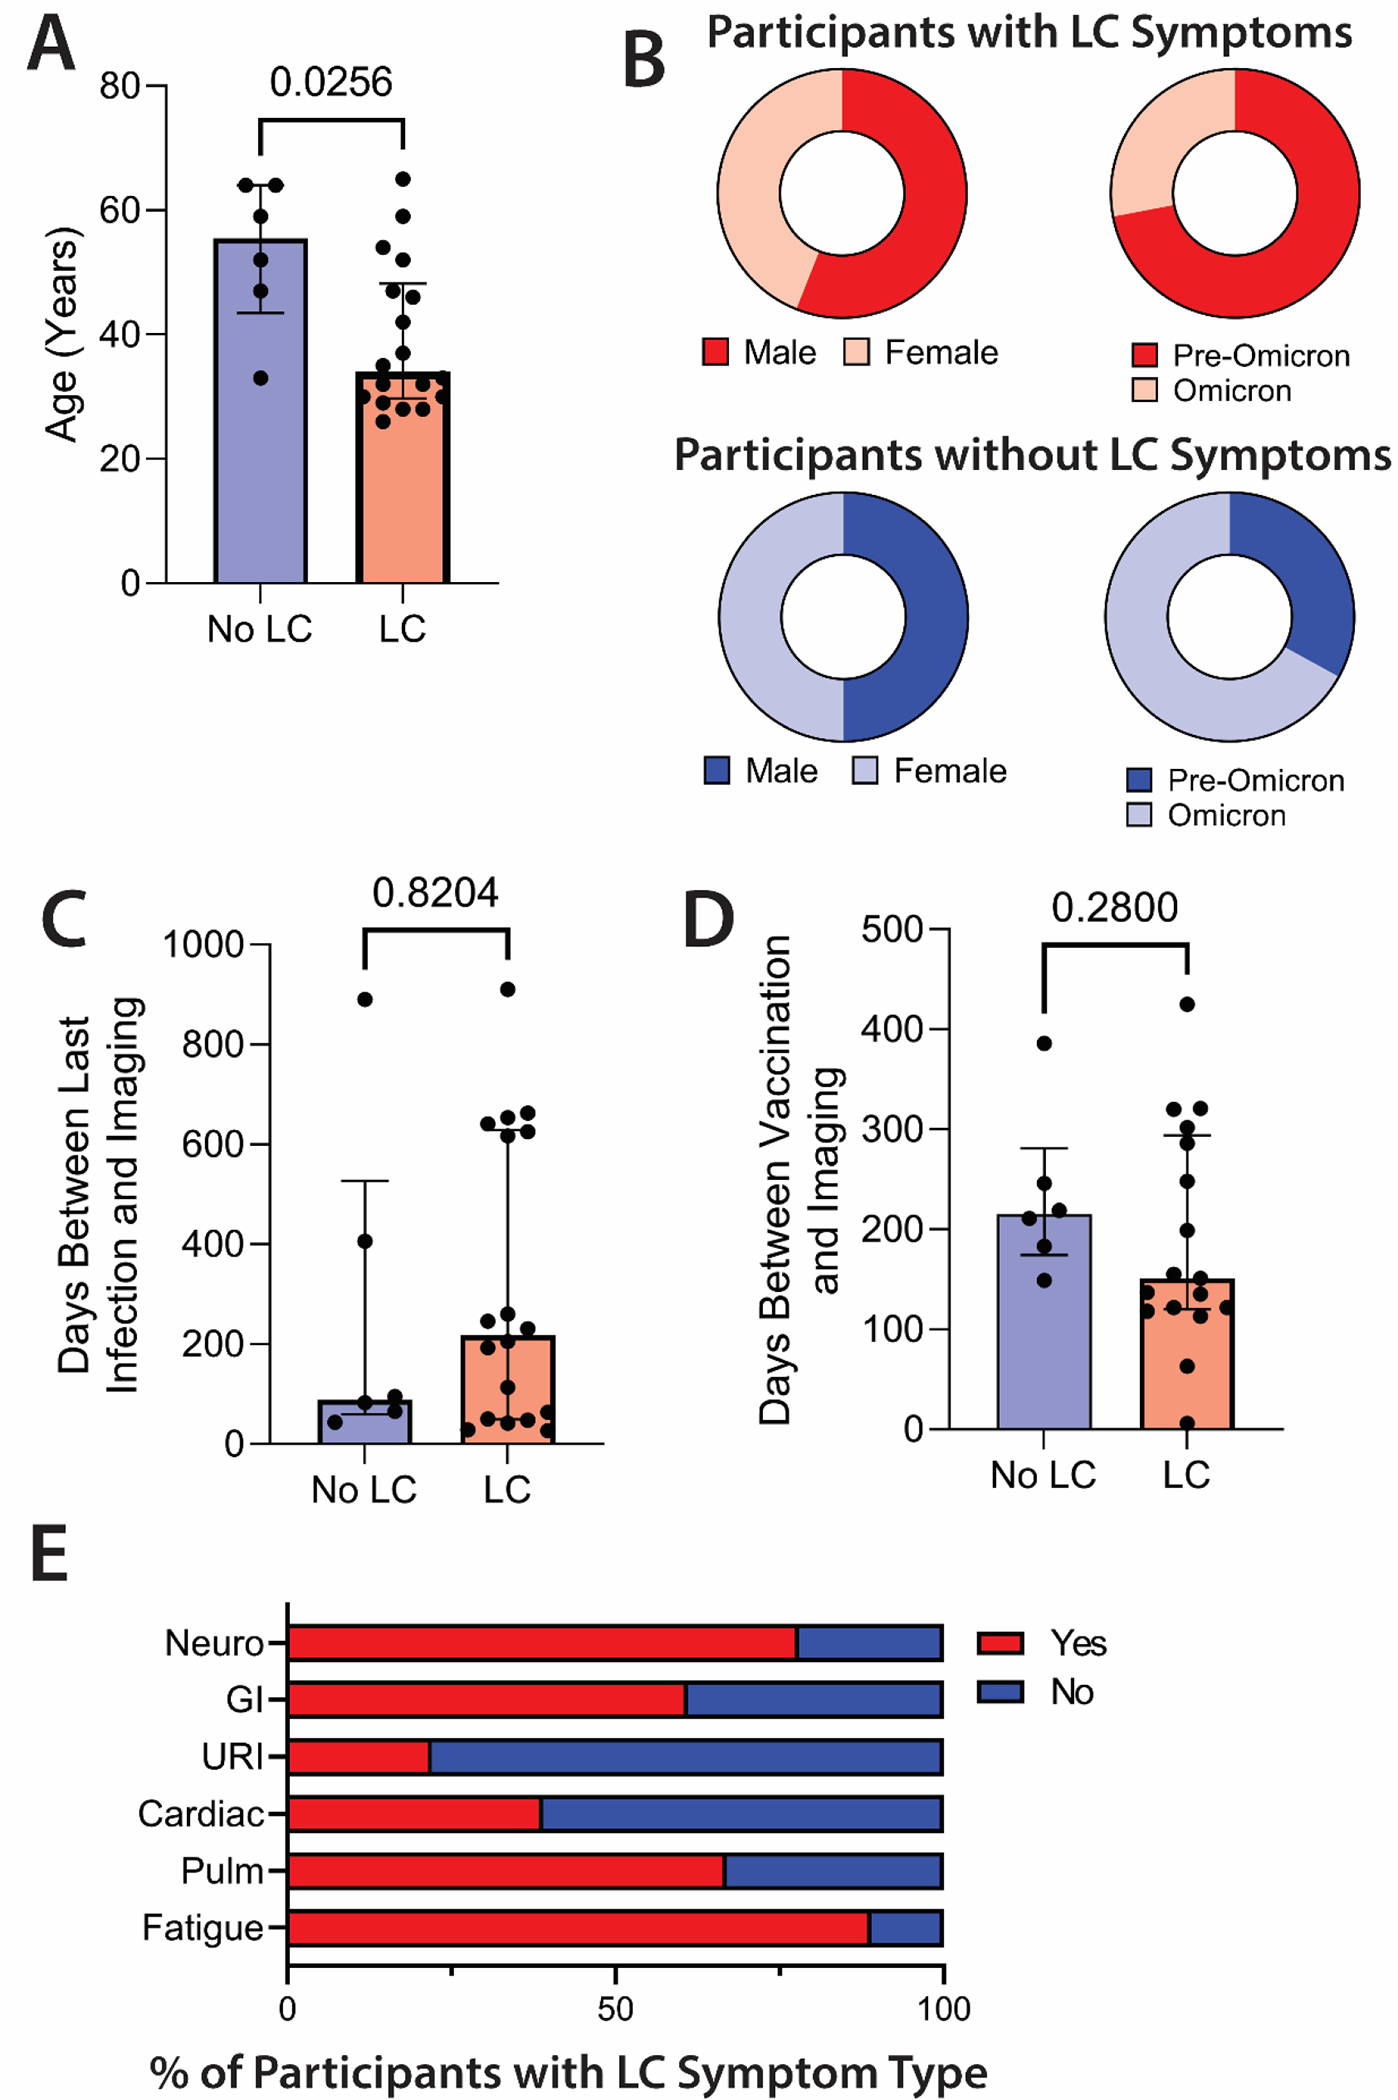
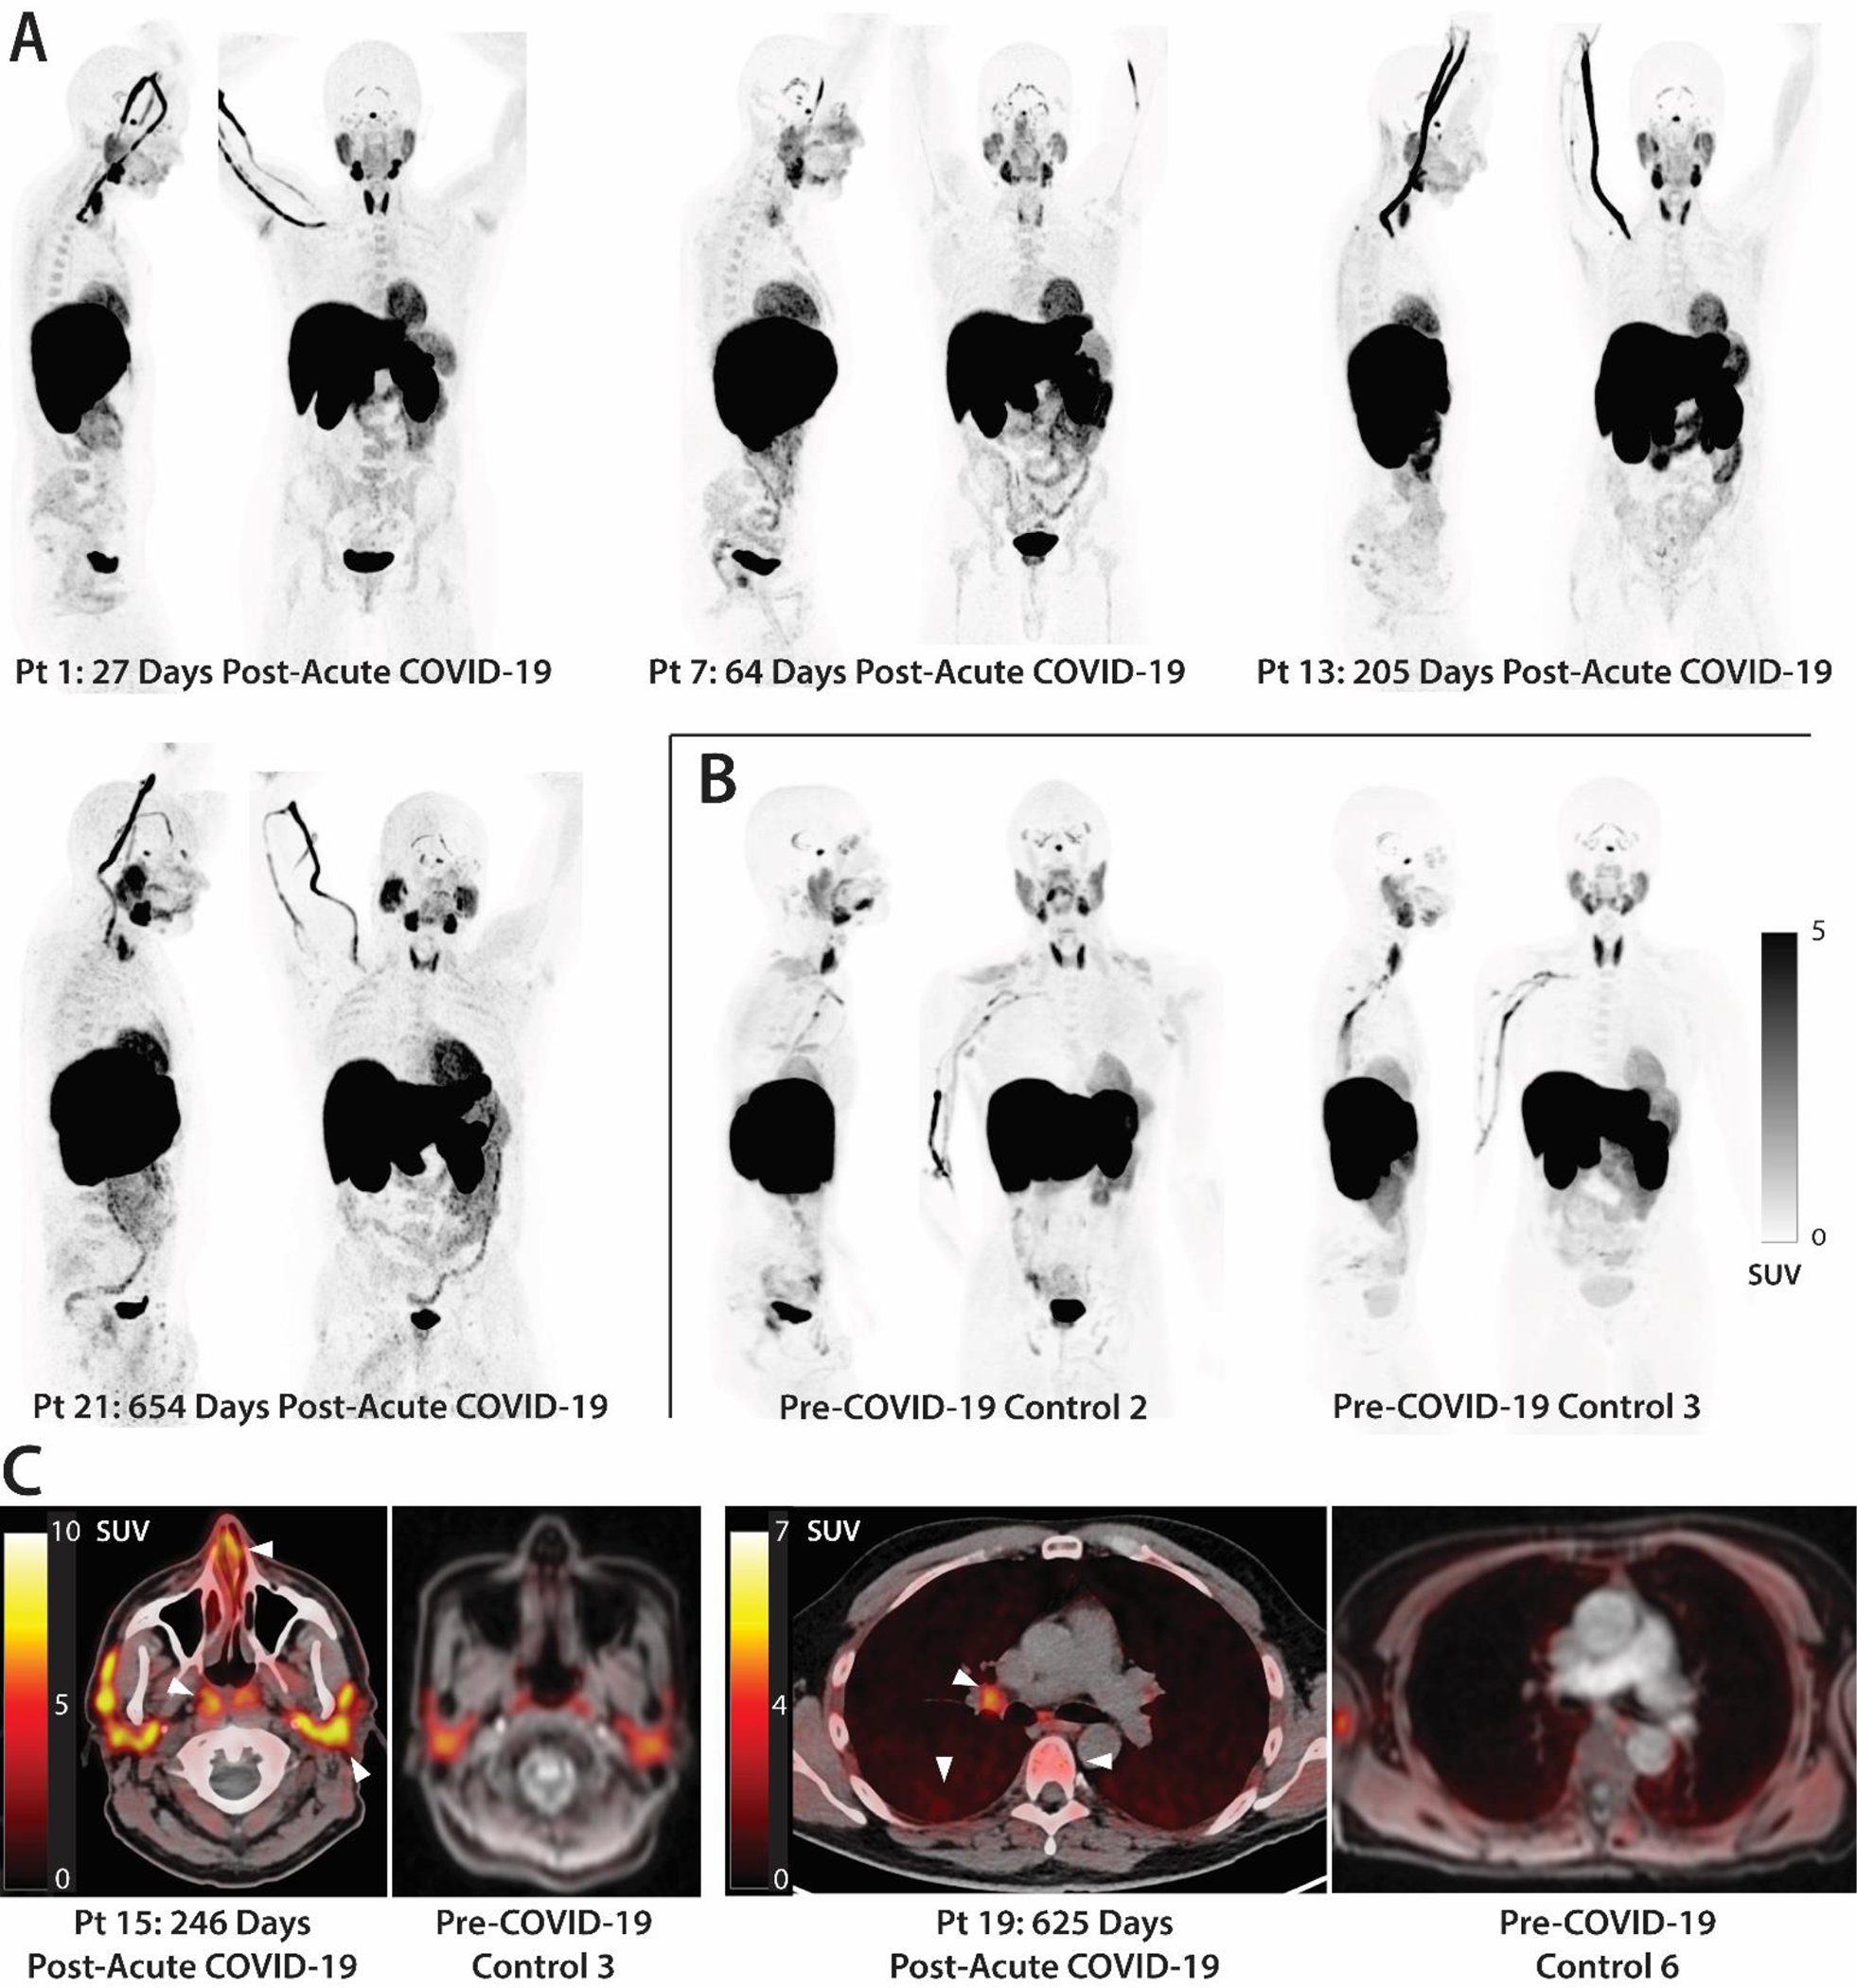
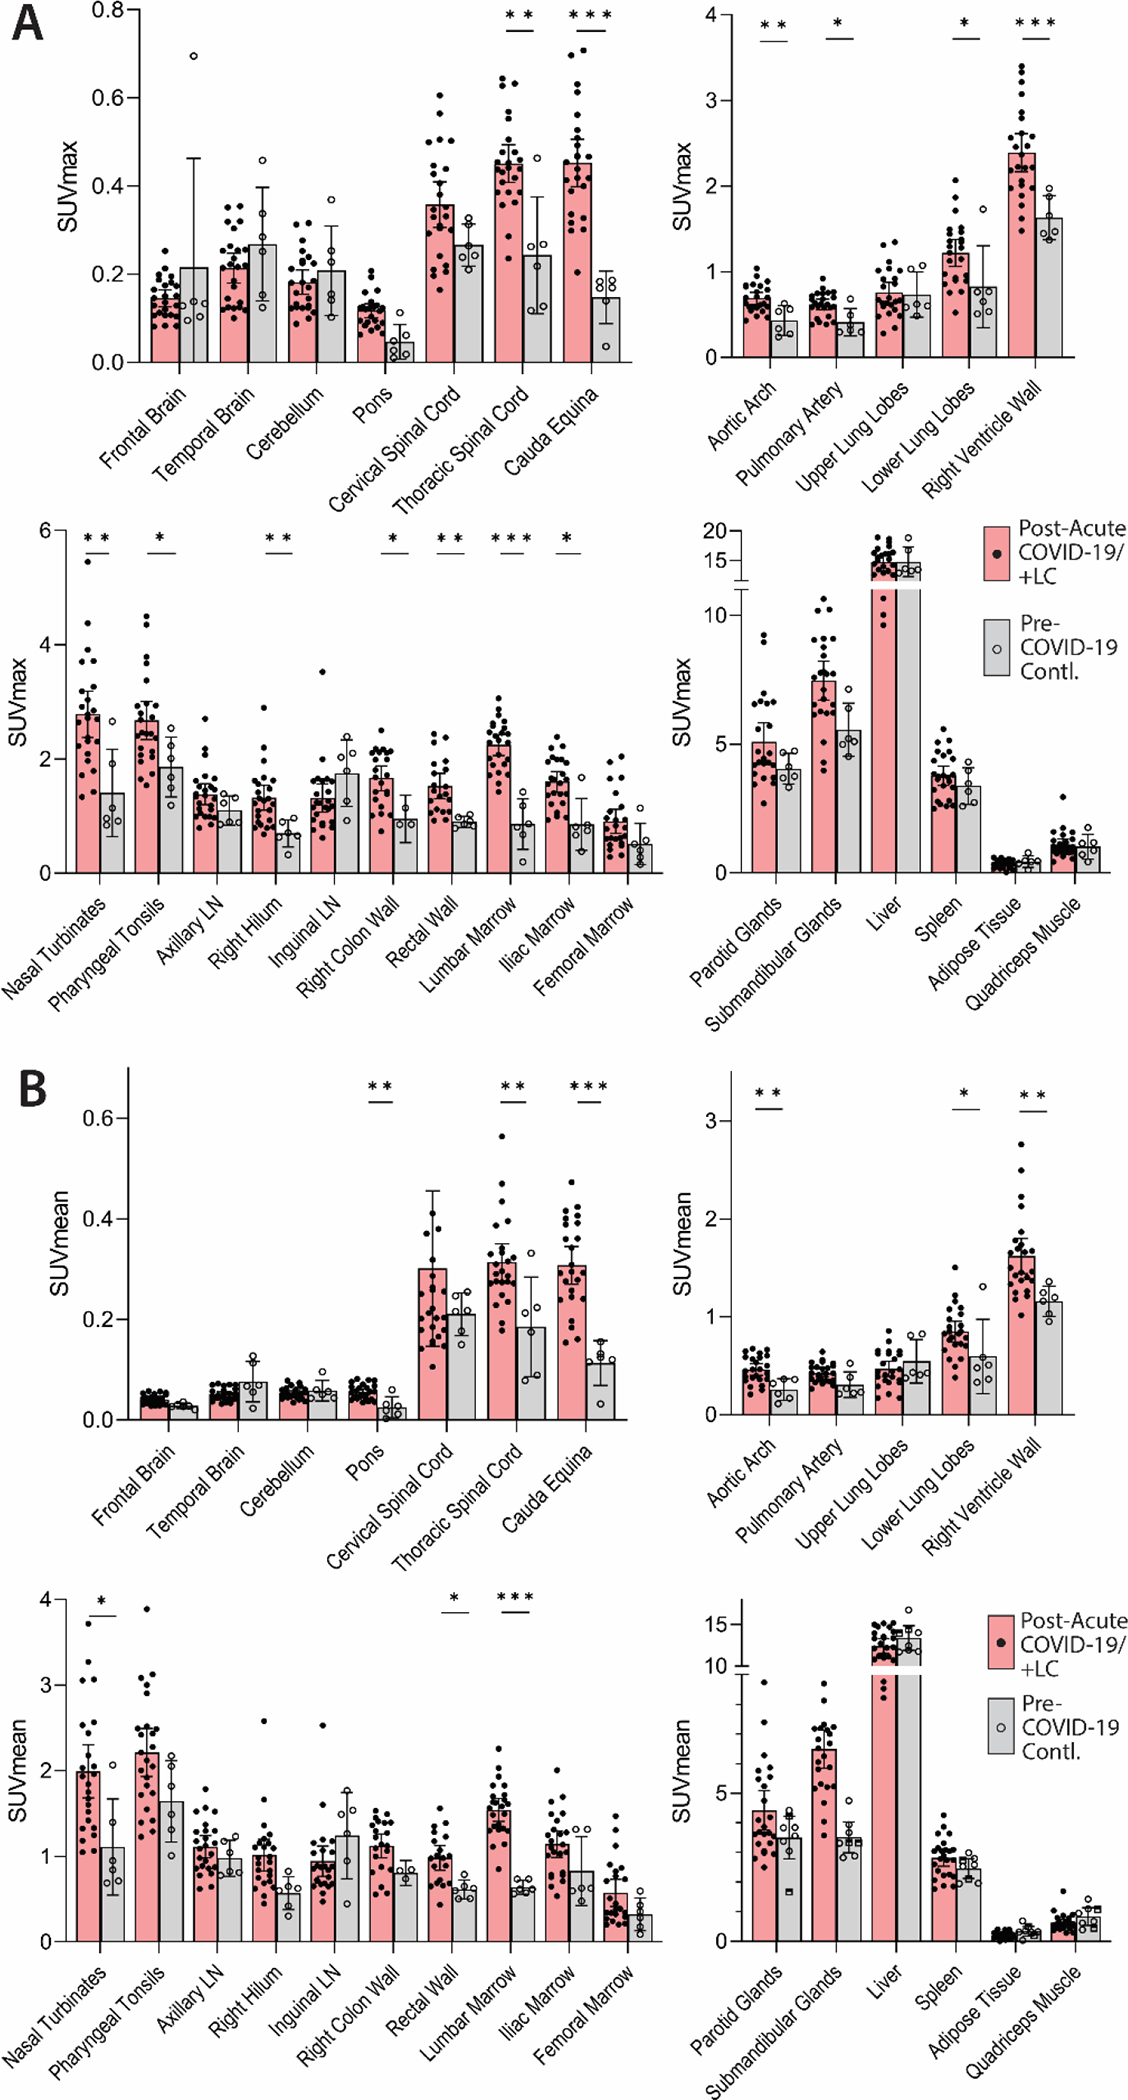
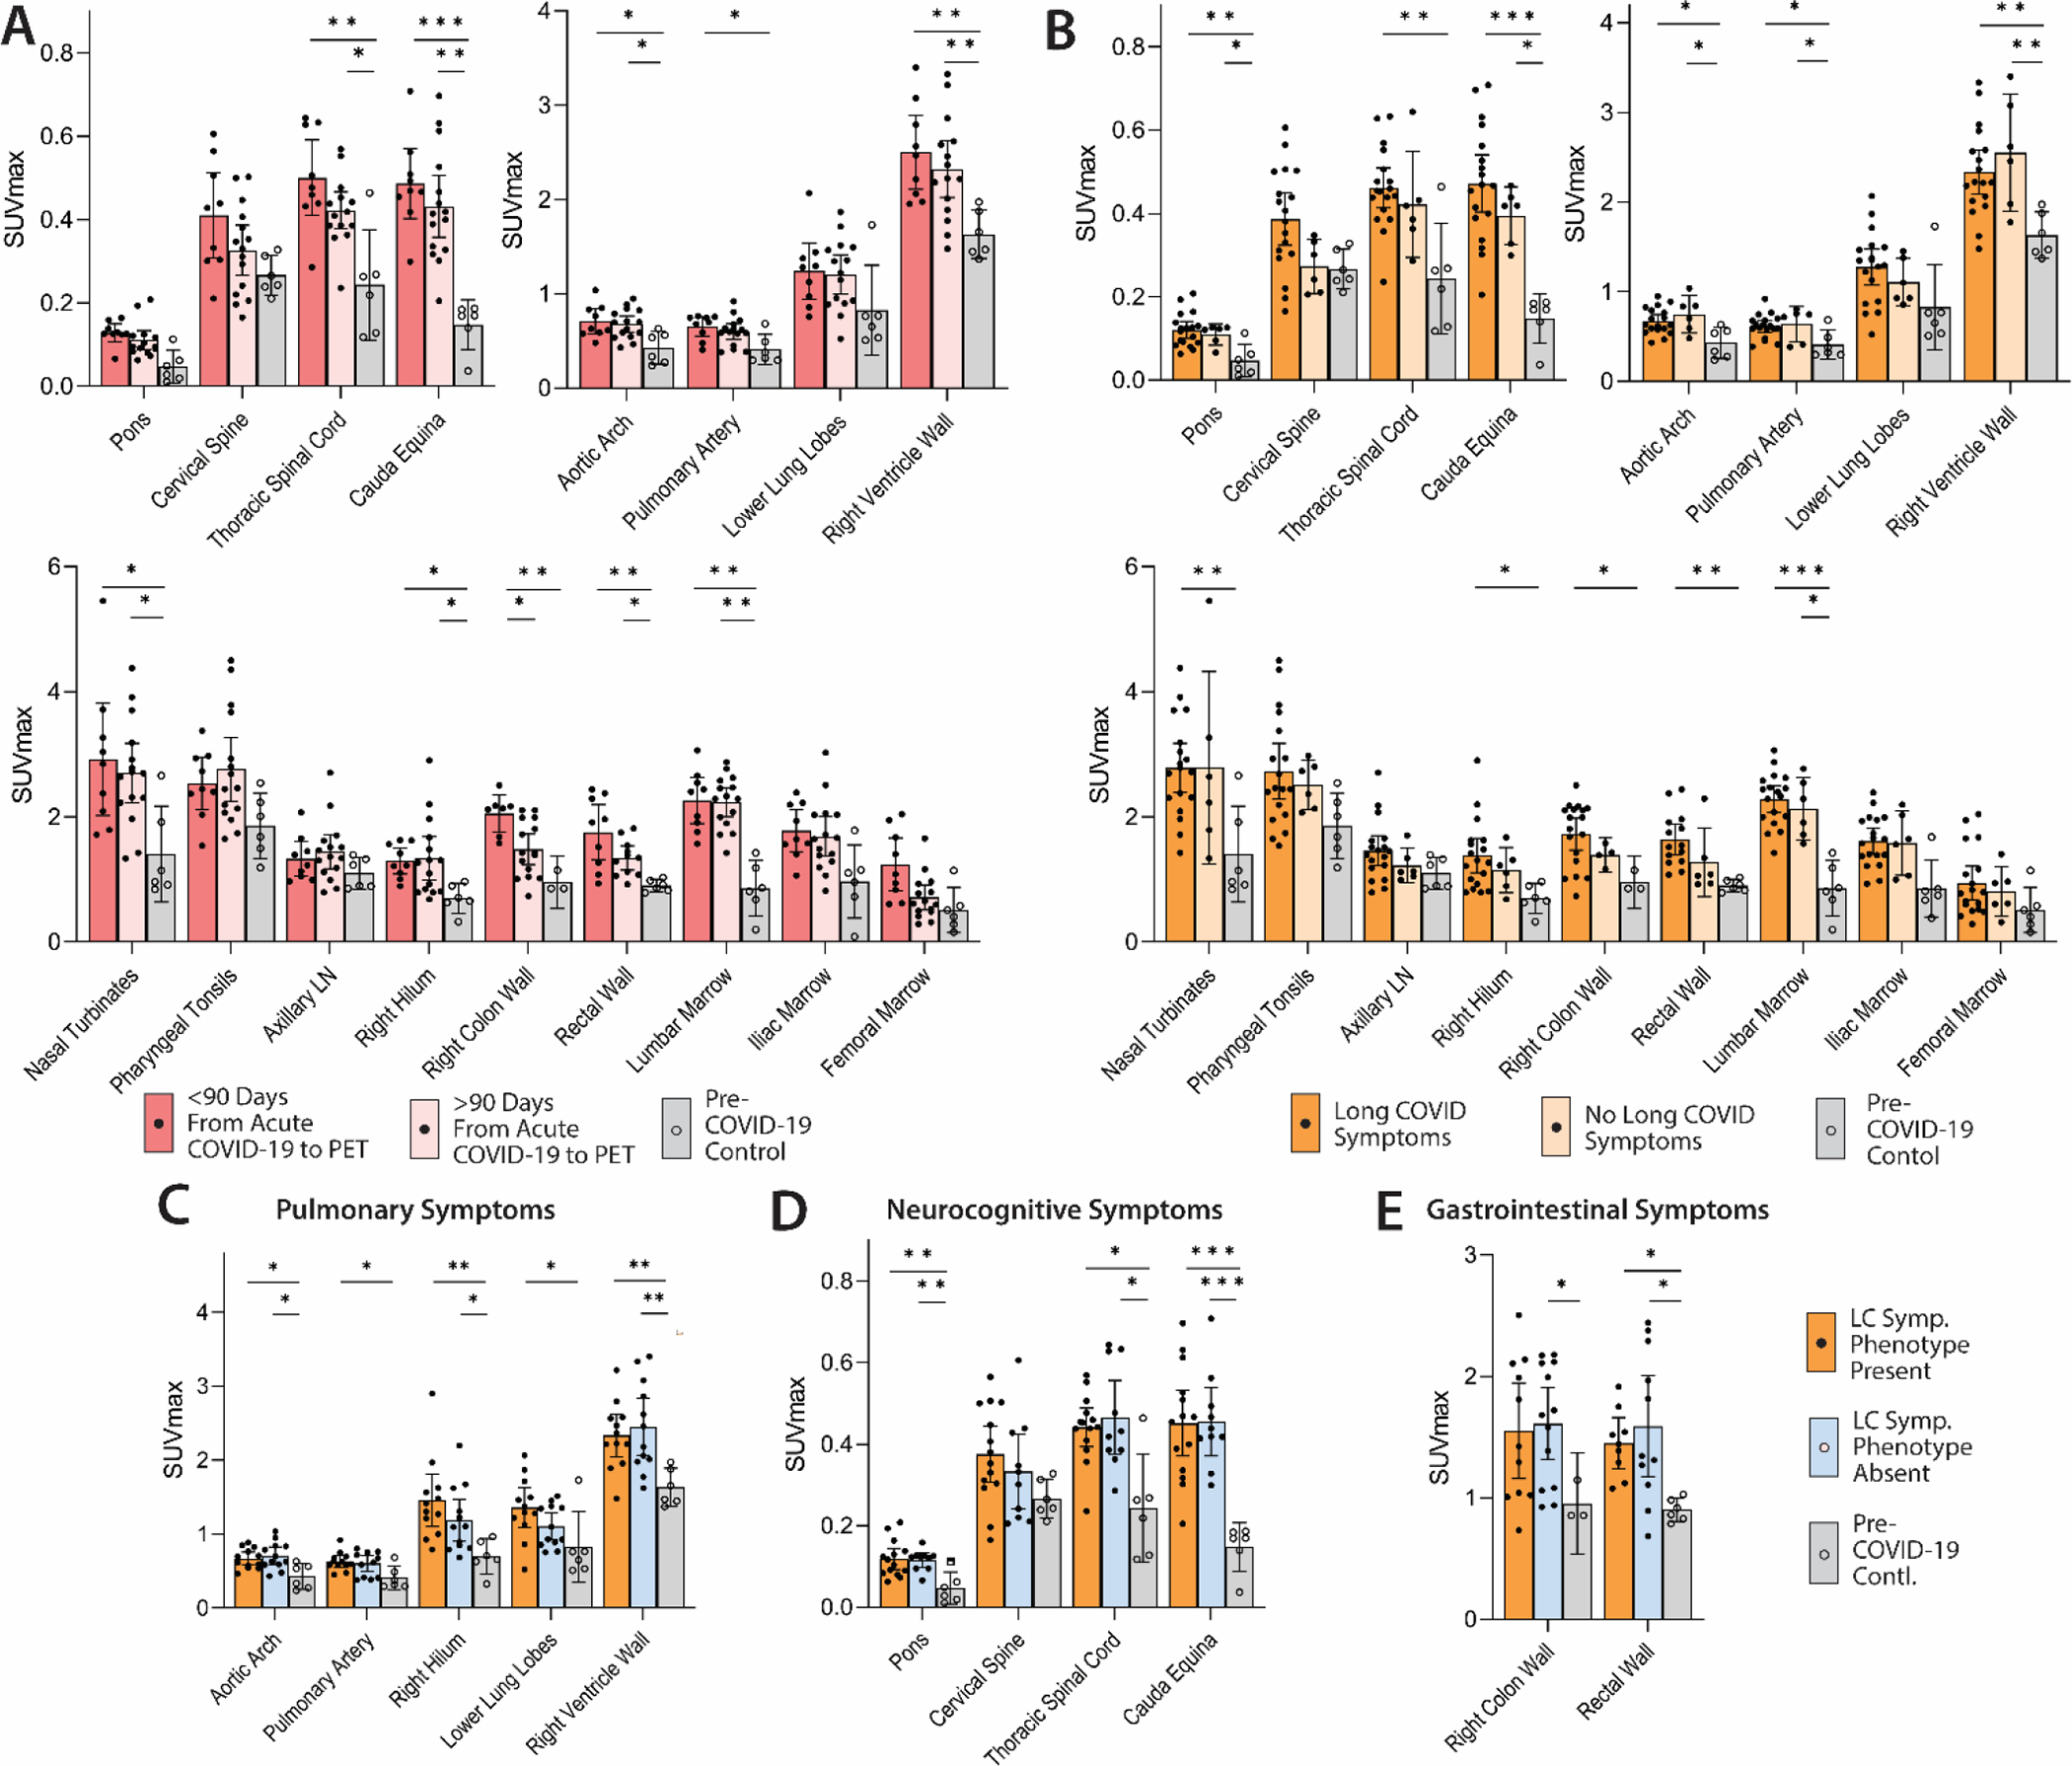
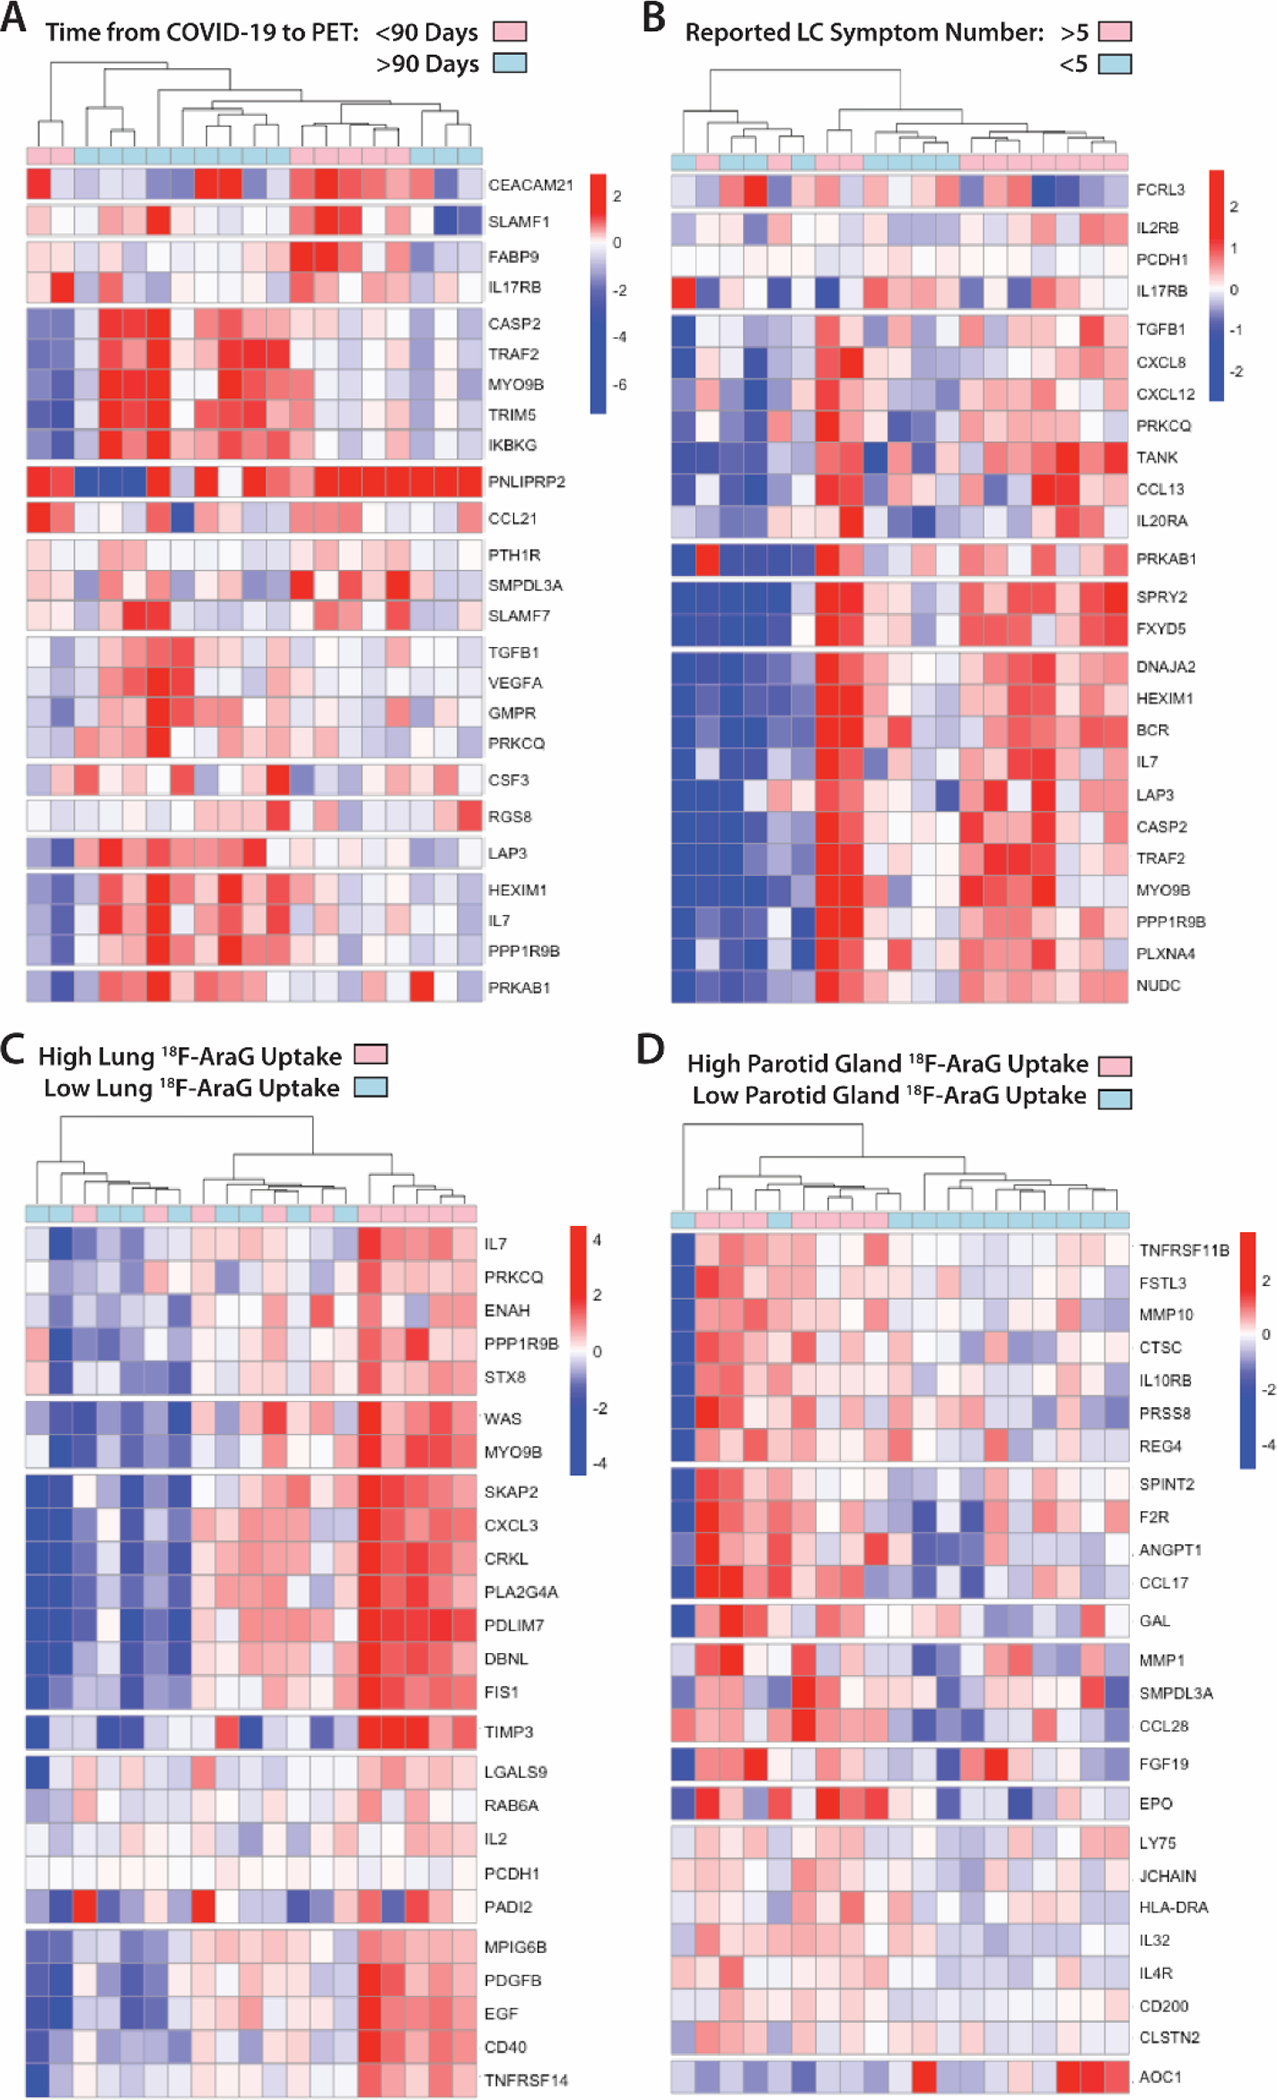
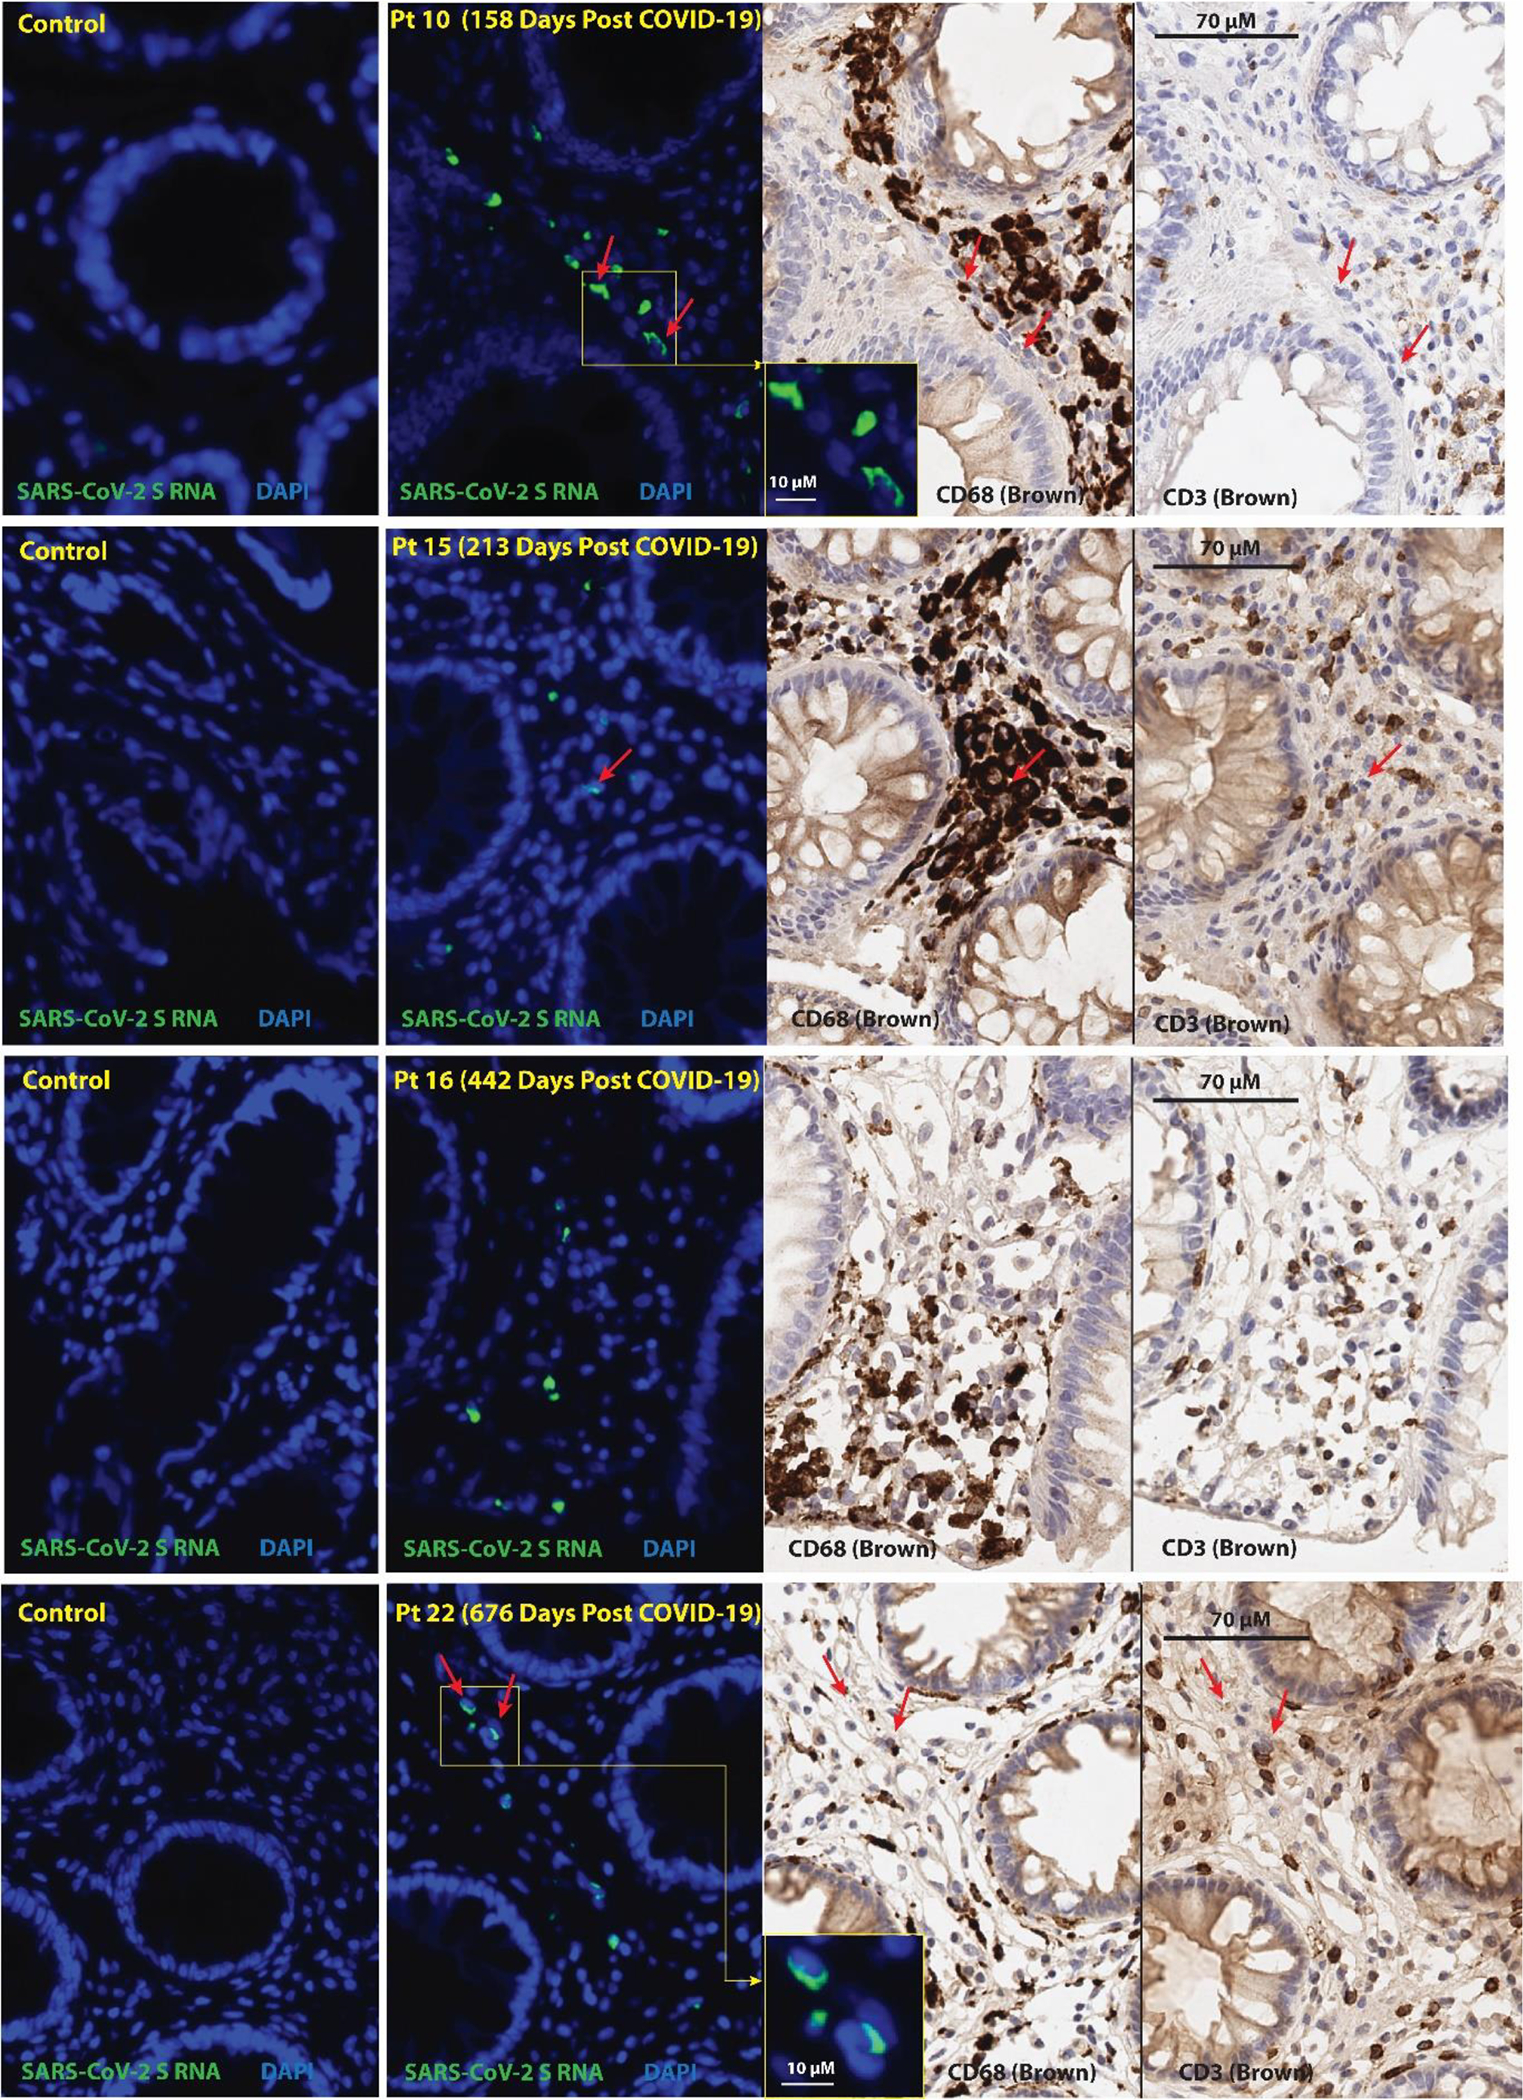
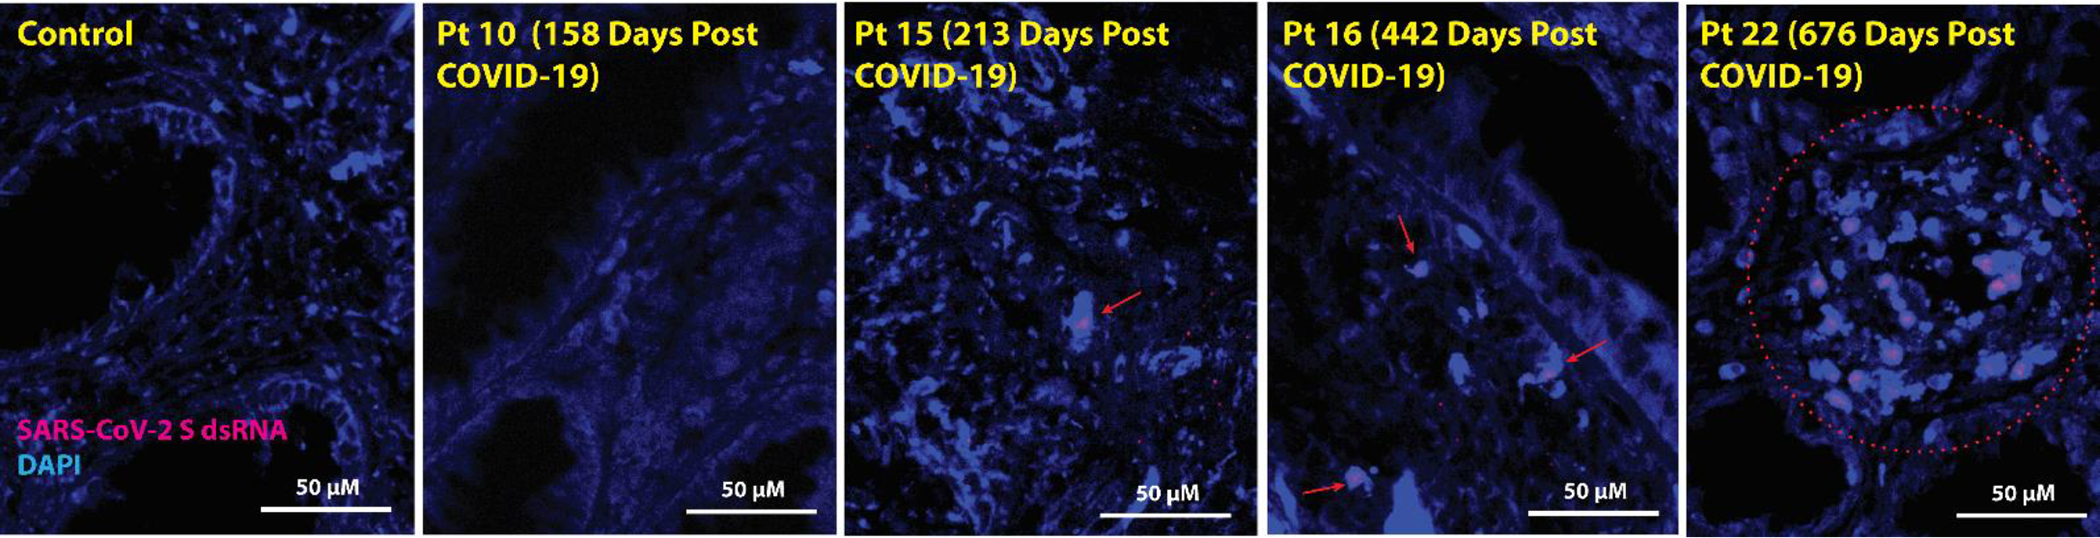
The mechanisms of postacute medical conditions and unexplained symptoms after SARS-CoV-2 infection [Long Covid (LC)] are incompletely understood. There is growing evidence that viral persistence, immune dysregulation, and T cell dysfunction may play major roles. We performed whole-body positron emission tomography imaging in a well-characterized cohort of 24 participants at time points ranging from 27 to 910 days after acute SARS-CoV-2 infection using the radiopharmaceutical agent [18F]F-AraG, a selective tracer that allows for anatomical quantitation of activated T lymphocytes. Tracer uptake in the postacute COVID-19 group, which included those with and without continuing symptoms, was higher compared with prepandemic controls in many regions, including the brain stem, spinal cord, bone marrow, nasopharyngeal and hilar lymphoid tissue, cardiopulmonary tissues, and gut wall. T cell activation in the spinal cord and gut wall was associated with the presence of LC symptoms. In addition, tracer uptake in lung tissue was higher in those with persistent pulmonary symptoms specifically. Increased T cell activation in these tissues was also observed in many individuals without LC. Given the high [18F]F-AraG uptake detected in the gut, we obtained colorectal tissue for in situ hybridization of SARS-CoV-2 RNA and immunohistochemical studies in a subset of five participants with LC symptoms. We identified intracellular SARS-CoV-2 single-stranded spike protein-encoding RNA in rectosigmoid lamina propria tissue in all five participants and double-stranded spike protein-encoding RNA in three participants up to 676 days after initial COVID-19, suggesting that tissue viral persistence could be associated with long-term immunologic perturbations.


Conflict of interest statement

Conflicts of Interest

MJP reports consulting fees for Gilead Sciences and AstraZeneca and research support from Aerium Therapeutics, outside the submitted work. SGD reports consulting for Enanta Pharmaceuticals and Pfizer and research support from Aerium Therapeutics, outside the submitted work. TJH reports consulting fees for Roche and Regeneron outside the submitted work. JL is employed by CellSight Technologies, holds CellSight stock options, and holds patents relating to [18F]F-AraG (Methods and Materials for Making PET Radiotracers, US20220370648A1; Methods and Materials for Using [18F]F-AraG in Cardiac Imaging, US20230309833A1). AG was employed by CellSight Technologies.

Figures

Figure 1.
Figure 1.. COVID-19 PET imaging cohort demographics and clinical characteristics.
(A and B) Comparisons in age (A), sex assigned at birth, and variant wave (B) are shown in those with (n=18) and without LC (n=6). (C and D) The days between last documented SARS-CoV-2 infection and PET imaging (C) and last COVID-19 vaccine dose and PET imaging (D) are shown for participants with and without LC. (E) Shown are the percent of participants with and without specific LC symptoms phenotype. LC, Long COVID; GI, gastrointestinal; URI, upper respiratory infection symptoms; Pulm, pulmonary symptoms. Bars represent median values with all individual data points and interquartile ranges shown. P values were calculated by two-sided non-parametric Mann-Whitney tests.
Figure 2.
Figure 2.. Increased [18F]F-AraG uptake in participants following COVID-19 compared to pre-pandemic control volunteers.
(A and B) Maximum intensity projections (MIP; coronal and sagittal views of 3-dimesional reconstructions) are shown for four representative participants at various times following SARS-CoV-2 infection (A) and male and female uninfected controls (B). (C) Axial PET/CT overlay images show signal in nasal turbinates, parotid glands, tonsillar tissue, hilar lymph node, lung parenchyma, and lumbar bone marrow in representative post-acute COVID-19 and control participants (white arrows). MIPs for all participants are shown in fig. S1. Pt, patient. SUV, standardized uptake value.
Figure 3.
Figure 3.. Increased [18F]F-AraG in many tissues from post-acute COVID-19 cases compared to pre-pandemic control volunteers.
(A and B) Maximum standardized uptake values (SUVmax) (A) and mean SUV (SUVmean) (B) for various anatomical regions of interest (ROI) are shown for post-acute COVID-19 participants, including those with any number of Long COVID symptoms (Post-acute COVID-19/+LC; n=18), as well as pre-pandemic controls (n=6). Bars represent mean SUVmax or SUVmean and error bars represent 95% confidence interval. Adjusted P values <0.05, <0.01 and <0.001 represented by *, **, and *** respectively from two-sided non-parametric Kruskal–Wallis tests using a Benjamini-Hochberg adjustment for false discovery rates across multiple comparisons (q value = adjusted P value). All data points are shown on the graph. ROI determination was not possible in 3 and 5 post-acute COVID-19 participants for proximal colon and rectal wall ROIs, respectively, and 3 pre-pandemic control participants for proximal colon. LN, lymph node.
Figure 4.
Figure 4.. Differential [18F]F-AraG uptake in post-acute COVID-19 cases and control participants grouped by time from initial COVID-19 symptom onset to PET imaging and by Long COVID symptoms.
(A) SUVmax values in tissue ROIs in post-acute COVID-19 participants imaged <90 days or >90 days from acute infection onset and control volunteers are shown. (B) SUVmax values in tissue ROIs in post-acute COVID-19 participants with or without Long COVID symptoms reported at the time of imaging and control volunteers are shown in. (C to E) SUVmax values in tissue ROIs in post-acute COVID-19 participants with or without pulmonary symptoms (C), neurocognitive symptoms (D) and gastrointestinal symptoms (E) are also shown. Bars represent mean SUVmax and error bars represent 95% confidence interval. Adjusted P values <0.05, <0.01 and <0.001 represented by *, **, and *** respectively from two-sided non-parametric Kruskal–Wallis tests using a Benjamini-Hochberg adjustment for false discovery rates across multiple comparisons (q value = adjusted P). All data points are shown. SUVmean values are shown in fig. S4.
Figure 5.
Figure 5.. Modules of circulating markers of inflammation and immune activation are associated with reported Long COVID symptom number and [18F]F-AraG PET uptake in representative tissues.
(A to D) Clustered heat maps of the top 25 differentially expressed plasma proteins from Olink Proximity Extension Assay EXPLORE 384 panel based on unadjusted P values with markers grouped into k-clusters based on similarity are shown for participants imaged early (<90 days) or later (>90 days) after symptom onset (A), those reporting >5 or ≤5 Long COVID symptoms (out of a total of 32 surveyed across multiple organ systems) at the time of PET imaging (B), and in those with high lower lung lobe [18F]F-AraG uptake (C; defined as SUVmax >2 standard deviations [SD] above the average SUVmax value measured in Pre-pandemic control volunteers), and parotid gland tissue [18F]F-AraG uptake (D; defined as SUVmax >1 SD above the average SUVmax value measured in pre-pandemic control participants). Heat maps clustered by high uptake in other tissues ROIs are shown in fig. S8. Scale bars represent mean subtracted normalized log2 protein expression values.
Figure 6.
Figure 6.. SARS-CoV-2 single-stranded Spike protein-encoding RNA was identified in recto-sigmoid tissue of individuals with LC months to years following acute infection.
Panels represent from left to right: SARS-CoV-2 spike protein-encoding RNA staining by ISH in pre-pandemic tissue, SARS-CoV-2 spike protein-encoding RNA staining by ISH in post-acute COVID-19 participant sample, CD68 immunostaining, and CD3 immunostaining. Red arrows denote representative areas of RNA detection across images for each sample (not all RNA detection is marked). Spike single-stranded (ss)RNA was detected in all five of the post-acute COVID-19 participants that underwent biopsy from 158 to 676 days following initial COVID-19 symptom onset and signal was primarily observed in cells located within the lamina propria. Four participants with detectable ssRNA in three distinct gut regions are shown, a fifth participant had rare Spike ssRNA detected in only one of three regions imaged. A minority of SARS-CoV-2 ssRNA signal was localized in CD68+ cells and very rarely in CD3+ cells. No viral ssRNA was detected in control tissue from a pre-pandemic participant.
Figure 7.
Figure 7.. SARS-CoV-2 Spike protein-encoding double-stranded (ds)RNA was observed in recto-sigmoid tissue from individuals with LC months to years following acute infection.
Red arrows and the red circle denote representative areas of dsRNA detection in cells across images for each sample. Spike protein-encoding dsRNA was detected in three of the post-acute COVID-19 participants who underwent biopsy from 213 to 676 days following initial COVID-19 symptom onset, and the signal was primarily observed exclusively in cells located within the lamina propria. Four representative participants are shown. No viral dsRNA was detected in the control tissue from a pre-pandemic participant.

References

    1. Nalbandian A, Sehgal K, Gupta A, Madhavan MV, McGroder C, Stevens JS, Cook JR, Nordvig AS, Shalev D, Sehrawat TS, Ahluwalia N, Bikdeli B, Dietz D, Der-Nigoghossian C, Liyanage-Don N, Rosner GF, Bernstein EJ, Mohan S, Beckley AA, Seres DS, Choueiri TK, Uriel N, Ausiello JC, Accili D, Freedberg DE, Baldwin M, Schwartz A, Brodie D, Garcia CK, Elkind MSV, Connors JM, Bilezikian JP, Landry DW, Wan EY, Post-acute COVID-19 syndrome. Nat Med 27, 601–615 (2021). - PMC - PubMed
    1. Davis HE, McCorkell L, Vogel JM, Topol EJ, Long COVID: major findings, mechanisms and recommendations. Nat Rev Microbiol 21, 133–146 (2023). - PMC - PubMed
    1. Al-Aly Z, Xie Y, Bowe B, High-dimensional characterization of post-acute sequelae of COVID-19. Nature 594, 259–264 (2021). - PubMed
    1. Centers for Disease Control and Prevention COVID Data Tracker. US Department of Health and Human Services, CDC. (https://covid.cdc.gov/covid-data-tracker).
    1. Robertson MM, Qasmieh SA, Kulkarni SG, Teasdale CA, Jones HE, McNairy M, Borrell LN, Nash D, The Epidemiology of Long Coronavirus Disease in US Adults. Clin Infect Dis 76, 1636–1645 (2023). - PubMed

Publication types