. 2024 Jul 3;16(754):eadl3848.
doi: 10.1126/scitranslmed.adl3848. Epub 2024 Jul 3.

Lupus IgA1 autoantibodies synergize with IgG to enhance plasmacytoid dendritic cell responses to RNA-containing immune complexes

Affiliations

Lupus IgA1 autoantibodies synergize with IgG to enhance plasmacytoid dendritic cell responses to RNA-containing immune complexes

Hayley R Waterman et al. Sci Transl Med. .

Abstract

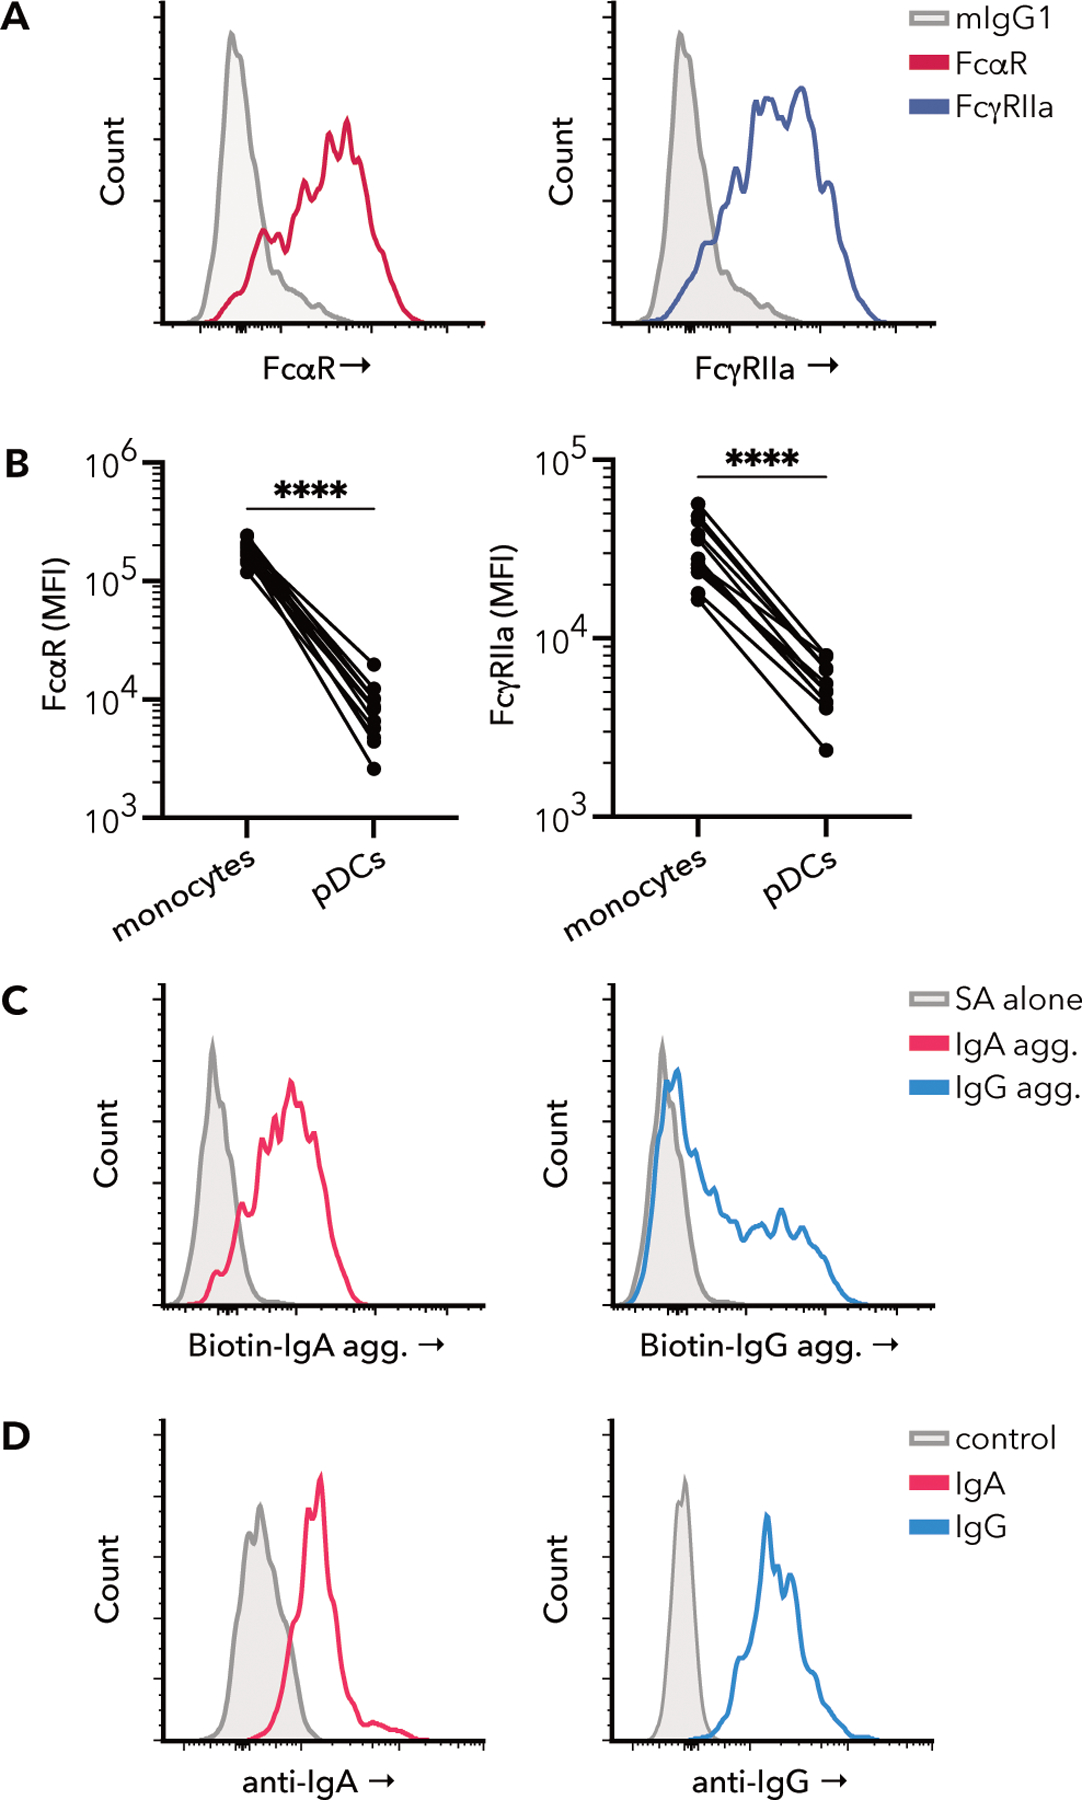
Autoantibodies to nuclear antigens are hallmarks of systemic lupus erythematosus (SLE) where they contribute to pathogenesis. However, there remains a gap in our knowledge regarding how different isotypes of autoantibodies contribute to this autoimmune disease, including the production of the critical type I interferon (IFN) cytokines by plasmacytoid dendritic cells (pDCs) in response to immune complexes (ICs). We focused on IgA, which is the second-most prevalent isotype in serum and, along with IgG, is deposited in glomeruli in individuals with lupus nephritis. We show that individuals with SLE have serum IgA autoantibodies against most nuclear antigens, correlating with IgG against the same antigen. We investigated whether IgA autoantibodies against a major SLE autoantigen, Smith ribonucleoprotein (Sm/RNP), played a role in IC activation of pDCs. We found that pDCs expressed the IgA-specific Fc receptor, FcαR, and IgA1 autoantibodies synergized with IgG in RNA-containing ICs to generate robust primary blood pDC IFN-α responses in vitro. pDC responses to these ICs required both FcαR and FcγRIIa, showing synergy between these Fc receptors. Sm/RNP IC binding to and internalization by pDCs were greater when ICs contained both IgA1 and IgG. Circulating pDCs from individuals with SLE had higher binding of IgA1-containing ICs and higher expression of FcαR than pDCs from healthy control individuals. Although pDC FcαR expression correlated with the blood IFN-stimulated gene signature in SLE, Toll-like receptor 7 agonists, but not IFN-α, up-regulated pDC FcαR expression in vitro. Together, we show a mechanism by which IgA1 autoantibodies contribute to SLE pathogenesis.


Conflict of interest statement

Competing interests: J.H.B. is a Scientific Co-Founder and Scientific Advisory Board member of GentiBio, a consultant for Bristol Myers Squibb, Neoleukin Therapeutics and Hotspot Therapeutics, and has past and current research projects sponsored by Amgen, Bristol Myers Squibb, Janssen, Novo Nordisk, and Pfizer. She is a member of the Type 1 Diabetes TrialNet Study Group, a partner of the Allen Institute for Immunology, and a member of the Scientific Advisory Boards for the La Jolla Institute for Allergy and Immunology, Oklahoma Medical Research Foundation, and BMS Immunology. J.H.B also has a patent for tenascin-C autoantigenic epitopes in rheumatoid arthritis. J.A.H. has been a consultant for aTyr Pharma. All other authors have no competing interests.

Figures

Figure 1.
Figure 1.. IgA and IgG RNA-associated anti-nuclear antibodies in SLE serum.
(A) Shown is a heatmap of autoantibody profiling of serum from 24 individuals with SLE. Heatmaps of log-scaled antibody binding for IgA (left) and IgG (right) isotype antibodies to 16 RNA-associated nuclear antigens are shown. Each row corresponds to an antigen and each column corresponds to an individual participant. The color bar on top indicates SLEDAI score for each donor at time of blood draw. Clustering of individuals and samples is based on similarity in scaled IgA amounts with the same clustering applied to the IgG heatmap (n=24). (B) A correlation plot between IgA and IgG for anti-Sm/RNP (left) and dsDNA (right) nuclear antigens is shown. Each dot represents an individual (n=24; left, r=0.78, Pearson’s correlation coefficient, p<0.0001, right r=0.82, Pearson’s correlation coefficient, p<0.0001). ln, natural log. (C) Serial dilution curves are shown of immune complexes (ICs) containing both IgA and IgG in serum from 26 individuals with SLE as measured by ELISA. Each line represents an individual (n=26). OD450, optical density at 450 nm. (D) Histology and immunofluorescence of representative glomeruli from class IV lupus nephritis show Jones silver staining (left), as well as IgA (middle) and IgG (right) staining of serial sections.
Figure 2.
Figure 2.. Human blood pDCs express FcαR and FcγRIIa and bind IgA and IgG.
(A) Shown are representative histograms of FcαR (red) and FcγRIIa (blue) expression on pDCs compared to mIgG1 isotype control (gray). (B) Paired analysis between monocyte and pDC FcαR (left) and FcγRIIa (right) surface staining is shown (n=12 HCs; ratio paired t-test, **** p<0.0001). (C) Shown are representative histograms of biotinylated IgA (red) and biotinylated IgG (blue) binding to pDCs with Streptavidin (SA) alone (gray) negative control. Agg., aggregated. (D) Representative histograms are shown of bound IgA (red) and IgG (blue) on pDCs directly ex vivo with no secondary (gray) as a negative control.
Figure 3.
Figure 3.. IgA1 in Sm/RNP immune complexes enhances IFN-α production by pDCs
(A) pDC IFN-α secretion (ng/mL) after incubation with Sm/RNPs alone or with Sm/RNP ICs generated with SLE serum, SLE serum ΔIgA1, or SLE IgA1 is shown. Each symbol shape represents a different pDC donor (mean and range; n=1 SLE serum donor, n=4 HC pDC donors; one-way ANOVA with Bonferroni correction, *** p<0.001, and **p< 0.01). (B) pDC IFN-α secretion (ng/mL) after incubation with Sm/RNP ICs generated with purified SLE IgG (135 mg) and purified SLE IgA1 (10 mg) or purified SLE IgG (135mg) alone (n=1 SLE serum donor, n=4 HC pDC donors; paired t-test, * p<0.05) is shown. (C) Shown is pDC IFN-α secretion (ng/mL) after incubation with Sm/RNP ICs generated with SLE serum or SLE serum ΔIgA1 (n=8 SLE serum donors, n=1 HC pDC donor; paired t-test, ** p<0.01). (D) pDC IFN-α secretion (ng/mL) is shown after incubation with Sm/RNP ICs generated with SLE serum or SLE serum ΔIgA1 repeated over time (n=1 SLE serum donor, n=1 HC pDC donor, N=4 experiments over 14 months; paired t-test, ** p<0.01). (E) pDC IFN-α2 (left) and TNF (right) secretion (ng/mL) after incubation with SLE serum or SLE serum ΔIgA1 ICs is shown (n=4 SLE serum donors, n = 1 HC pDC donor; paired t-test, * p<0.01, ** p<0.001). (F) pDC IFN-α secretion normalized to control is shown (raw data in fig. S4F) after pDCs were incubated with PBS, mIgG1 isotype control, anti-FcγRIIa, anti-FcαR, aggregated IgG or aggregated IgA for 2 hours prior to the addition ICs generated from SLE serum (mean and range; n=1 SLE serum donor, n=3 HC pDC donors; one-wayANOVA with Bonferroni correction, comparison to mIgG1 control, *** p<0.001).
Figure 4.
Figure 4.. IgA1 autoantibodies contribute to IC association with pDCs
(A) Representative flow cytometry plots showing the percent of Sm/RNP-AF647+ pDCs (black outline box with percent IC+ positive listed above) after incubation with Sm/RNP-AF647 alone (top row), Sm/RNP-AF647 ICs generated from SLE serum (middle row) or SLE serum ΔIgA1 (bottom row), for 3, 6, 12 and 20 hours are shown. (B) Percent IC+ pDCs at 12 hours after incubation with ICs generated with SLE serum or SLE serum ΔIgA1 are shown (n=4 SLE serum donors, n=1 HC pDC donor; paired t-test, * p<0.05). (C) Correlation between IC+ pDCs (%) at 12 hrs and IFN-α secretion at 20 hours (ng/mL) after incubation with Sm/RNP-AF647 ICs generated from SLE serum (solid lavender symbols) or SLE serum ΔIgA1 (open blue symbols) is shown. Each symbol shape corresponds to a SLE serum donor (same experiment as panel B, n=4 SLE serum donors, n=1 HC pD donor; Pearson’s correlation coefficient, r=0.96, p=0.00020). (D) Correlation of 12 hr IC+ pDCs (%) and normalized 20 hr IFN-α production (% max) for combined experiments in which pDCs were incubated with Sm/RNP-AF647 ICs generated with SLE serum or SLE serum ΔIgA1 is shown (n=4 SLE serum donors, n=4 HC pD donors; Pearson’s correlation coefficient, r =0.79, p <0.0001).
Figure 5:
Figure 5:. IgA1 autoantibodies enhance pDC internalization of immune complexes
(A) Representative composite collapsed z-stack confocal images of the three categories of staining observed with DAPI (blue), CD123 (green) and Sm/RNP-AF647 ICs (magenta) are shown with cells categorized as below. Group I (left), pDCs with no ICs bound or internalized. Group II (middle), pDCs with either small (top cell) or large (bottom cell) internalized ICs. Group III (right), pDCs with either small (top cell) or large (bottom cell) ICs that were bound but not internalized. Full z-stacks shown in fig. S6. (B) Donut plots with the proportion of pDCs in each group for each experimental condition: Sm/RNP-AF647 with no serum (left), Sm/RNP-AF647 ICs generated with SLE serum (middle), and Sm/RNP-AF647 ICs generated with SLE serum ΔIgA1 (right) are shown. The center of the donut plot shows the number of cells imaged and analyzed in each group. (Chi-squared, ** p<0.01, ** p<0.01).
Figure 6.
Figure 6.. SLE pDCs have increased binding to immune complexes and increased expression of FcαR
(A) Graph shows the percent of IC+ pDCs from HC (black outlined circles) and SLE (purple circles) donors after 3.5 hours of incubation with ICs generated with SLE serum (gating IC+ pDCs shown in fig. S7A; median and interquartile range; n=1 SLE serum donor, n=12 SLE and 12 HC PBMC donors age, race and sex matched; t-test, *** p<0.001). (B) Correlations between IC+ pDCs and FcαR (left) or FcγRIIa (right) are shown. Correlations shown include pDCs from both HC (black outlined circles) and SLE (purple circles) individuals (left, Pearson’s. correlation, r=0.56, p=0.0041; right, Pearson’s correlation, r=0.13, p=0.58). (C) MFI values for cell surface expression of FcαR (left) and FcγRIIa (right) on gated pDCs from HC (black outlined circles) and SLE (purple) individuals are shown (median and interquartile range; n=37 HC donors, n=36 SLE donors; t-test, * p<0.05) (D) MFI values for cell surface expression of FcαR on monocytes from the same HC (black outlined circles) and SLE (purple) individuals from C are shown (median and interquartile range; n=37 HC donors, n=36 SLE donors; t-test). ns, not significant.
Figure 7.
Figure 7.. pDC FcαR expression correlates with IFN signature in SLE and is induced by R848 treatment.
(A) Heatmap shows the top 50 genes positively correlated to pDC cell surface FcαR expression from SLE donors. Scales above the heatmap show surface FcαR MFI expression (red), FcγRIIa expression (blue) and SLEDAI score (pink). Genes that were found to be part of the Hallmark IFN-alpha response gene set from the Broad’s Molecular Signatures Database are indicated with an asterisk (n=18 SLE donors). (B) Correlation between pDC surface FcαR expression and ISG signature determined by RNA-seq performed on whole blood is shown (n=18 SLE donors from A; Pearson’s correlation, r = 0.5, p = 0.034). (C) Correlation between pDC surface FcγRIIa expression and ISG signature (n=18 SLE donors from A and B; Pearson’s correlation, r=0.2, p=0.42) is shown. (D) pDC FcαR expression (MFI) after 36 hr incubation with PBS control, TLR7 agonist R848, IFN-α or TNF is shown (n=4–5 HC pDC donors; one-way ANOVA, Fisher’s least significant difference test comparing R848, IFN-α or TNF conditions to PBS control, * p = 0.034).

Update of

References

    1. Dema B, Charles N, Autoantibodies in SLE: Specificities, Isotypes and Receptors. Antibodies 5, 2 (2016). - PMC - PubMed
    1. Ameer MA, Chaudhry H, Mushtaq J, Khan OS, Babar M, Hashim T, Zeb S, Tariq MA, Patlolla SR, Ali J, Hashim SN, Hashim S, Khan OS, An Overview of Systemic Lupus Erythematosus (SLE) Pathogenesis, Classification, and Management. Cureus 14, e30330 (2022). - PMC - PubMed
    1. Postal M, Vivaldo JF, Fernandez-Ruiz R, Paredes JL, Appenzeller S, Niewold TB, Type I interferon in the pathogenesis of systemic lupus erythematosus. Curr. Opin. Immunol 67, 87–94 (2020). - PMC - PubMed
    1. Pisetsky DS, Lipsky PE, New insights into the role of antinuclear antibodies in systemic lupus erythematosus. Nat. Rev. Rheumatol 16, 565–579 (2020). - PMC - PubMed
    1. Båve U, Magnusson M, Eloranta M-L, Perers A, Alm GV, Rönnblom L, FcγRIIa Is Expressed on Natural IFN-α-Producing Cells (Plasmacytoid Dendritic Cells) and Is Required for the IFN-α Production Induced by Apoptotic Cells Combined with Lupus IgG. J. Immunol 171, 3296–3302 (2003). - PubMed

Publication types

MeSH terms