An official website of the United States government
The .gov means it’s official.
Federal government websites often end in .gov or .mil. Before
sharing sensitive information, make sure you’re on a federal
government site.
The site is secure.
The https:// ensures that you are connecting to the
official website and that any information you provide is encrypted
and transmitted securely.
Chimeric antigen receptor (CAR) T-cell therapy has resulted in remarkable clinical success in the treatment of B-cell malignancies. However, its clinical efficacy in solid tumors is limited, primarily by target antigen heterogeneity. To overcome antigen heterogeneity, we developed CAR T cells that overexpress LIGHT, a ligand of both lymphotoxin-β receptor on cancer cells and herpes virus entry mediator on immune cells. LIGHT-expressing CAR T cells displayed both antigen-directed cytotoxicity mediated by the CAR and antigen-independent killing mediated through the interaction of LIGHT with lymphotoxin-β receptor on cancer cells. Moreover, CAR T cells expressing LIGHT had immunostimulatory properties that improved the cells' proliferation and cytolytic profile. These data indicate that LIGHT-expressing CAR T cells may provide a way to eliminate antigen-negative tumor cells to prevent antigen-negative disease relapse.
Figure 1.. LTβR is necessary for LIGHT-mediated tumor cytotoxicity.
(A) Schematic of CAR design with…
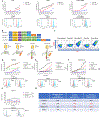
Figure 1.. LTβR is necessary for LIGHT-mediated tumor cytotoxicity.
(A) Schematic of CAR design with and without LIGHT. LTR, long terminal repeats; AML-targeting, Anti-CD371 ScFv. DEL construct serves as a negative control without the intracellular signaling domains. (B) Transgene expression of the CAR constructs after retroviral transduction of primary human T cells. (C) Healthy human donor-derived CD371-directed CAR T cells were cocultured with tumor cells expressing GFP and firefly luciferase at efferent effector: tumor ratios. 24 hours later, bioluminescence was measured and plotted as a percentage of the signal detected in a coculture of non-functional CD371-DEL CAR T cells. U937, CD371-expressing AML cell line transduced with GFP-firefly luciferase was used for tumor tracking. Plots represent 3 independent experiments with 3 different human donors. Data errors were analyzed with mean ± standard error of the mean (SEM). (D) In vitro cytotoxicity assay of CAR T cells with U937 CD371KO. Plots represent 3 independent experiments with 3 different human donors. Data errors were analyzed with mean ± standard error of the mean (SEM). (E) In vitro cytotoxicity assay of CAR T cells with OCI-AML3 (left) and SET2 (right). CD371-low/no expressing AML cell line transduced with GFP-firefly luciferase. Plots represent 3 independent experiments with 3 different human donors. Data errors were analyzed with mean ± standard error of the mean (SEM). (F) Flow plots of HVEM expression in HVEM KO in U937 CD371KO AML cell lines (top). Flow plots of LTβR expression in LTβR KO in U937 CD371KO AML cell lines (bottom) (G) In vitro cytotoxicity assay of CAR T cells with U937 CD371KO AML cancer cell lines expressing GFP, and firefly luciferase have either HVEM, LTβR, or HVEM and LTβR double KO. Plots represent 3 independent experiments with 3 different human donors. Data errors were analyzed with mean ± standard error of the mean (SEM).
Figure 2.. LIGHT-CAR T cells eliminate an…
Figure 2.. LIGHT-CAR T cells eliminate an antigen-heterogeneous population of PDAC.
(A) In vitro cytotoxicity…
Figure 2.. LIGHT-CAR T cells eliminate an antigen-heterogeneous population of PDAC.
(A) In vitro cytotoxicity of CAR T cells was assessed using a luciferase killing assay. Various solid tumor cancer cells lines (A375- melanoma; HT29 – colorectal; Patu_8988t – pancreatic ductal adenocarcinoma) were transduced with GFP and firefly-luciferase for tumor tracking. Plots represent 3 independent experiments with 3 different human donors. Data errors were analyzed with mean ± SEM. (B) Schematic of CAR design with and without LIGHT. LTR, long terminal repeats; mesothelin-directed CAR T cell, Anti-mesothelin ScFv. DEL construct serves as a negative control without the intracellular signaling domains. (C) Transgene expression of the CAR construct after retroviral transduction of primary T cells. (D) In vitro cytotoxicity assay of CAR T cells with CAPAN2 using luciferase killing assay. Plots represent 3 independent experiments with 3 different human donors. Data errors were analyzed with mean ± standard error of the mean (SEM). (E) In vitro cytotoxicity assay of CAR T cells with AsPC1 using luciferase killing assay. Plots represent 3 independent experiments with 3 different human donors. Data errors were analyzed with mean ± standard error of the mean (SEM). (F) In vitro cytotoxicity assay of CAR T cells with MIAPACA2 using luciferase killing assay. Plots represent 3 independent experiments with 3 different human donors. Data errors were analyzed with mean ± standard error of the mean (SEM). (G) In vitro cytotoxicity assay of CAR T cells with Panc1 using luciferase killing assay. Plots represent 3 independent experiments with 3 different human donors. Data errors were analyzed with mean ± standard error of the mean (SEM). (D-G) Expressions of mesothelin and LTβR with the corresponding PDAC cell lines are shown below. (H) Quantitative determination of cell surface antigen (mesothelin) of various PDAC cell lines are listed with the corresponding tumor lysis % of both second-generation CAR T cell (Meso-28z) and LIGHT-CAR T cell (Meso-28z-LIGHT) at 2:1 effector to tumor ratio.
Figure 3.. LIGHT overexpression improves CAR T…
Figure 3.. LIGHT overexpression improves CAR T cell proliferation and secretion of proinflammatory cytokines while…
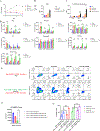
Figure 3.. LIGHT overexpression improves CAR T cell proliferation and secretion of proinflammatory cytokines while being able to eradicate antigen-negative tumor cells.
(A) Mesothelin-directed LIGHT-CAR T cells exhibited better proliferation in a repetitive antigen stimulation assay with low mesothelin expressing PDAC cell line, MIAPACA2. CAR T cells were cocultured with tumor cells at a 4:1 effector: tumor ratio for 5 days, and then CAR T cells were taken out and put onto new tumor cells at the original E:T ratio. The total fold expansion was quantified from multiplying each round of fold expansion every 5 days. Data is representative of 3 independent experiments of 3 different human donors and data errors were analyzed with mean ± SEM. (B) Flow cytometric analysis of activation marker, IL2RA (CD25), on various CAR T cell constructs after 15 days of coculture with MIAPACA2 PDAC cell line. (C) Flow cytometric analysis of co-inhibitory receptors (PD-1, TIM-3, LAG-3) of various CAR T cell constructs after 15 days of coculturing with MIAPACA2 PDAC cell line. (D) CAR T cells (1928z, Meso-28z, and Meso-28z-LIGHT) were co-cultured with 1:1 (25,000) with PDAC cancer cell lines (CAPAN2, AsPC1, MIAPACA2, and PANC1) in 200μL of media for 24 hours in 96well plates. Cells were pellet down and the supernatant was collected for multiplex cytokine profiling using the LUMINEX FLEXMAP 3D system. Data are representative of 4 separate human donors. Data errors were analyzed with mean ± SEM. (E) Panc1 PDAC cell line with hMSLN and LTβR overexpression was stained with CellTrace Far Red dye prior to coculture with Meso-DEL, Meso-28z, and Meso-28z-LIGHT CAR T cells at 4 to 1 effector to tumor ratio for 48 hours prior to flow cytometric analysis to assess for viable tumor cells. Panc1 wildtype without hMSLN were stained with CellTrace CSFE dye prior to mixing with the previously mentioned Panc1 cell line to assess for CAR T cell’s ability to eradicate antigen-negative tumor cells. CAR T cells at 4 to 1 effector to tumor ratio were cocultured with the mixed-antigen population for 48 hours prior to flow cytometric analysis to assess for viable tumor cells. (F) Quantification of the mesothelin negative population (Q1) from 3E. Data is representative of 3 independent experiments from cancer cells harvested after cocultured with CAR T cells from 3 different human donors. Data errors were analyzed with mean ± SEM. (G) In vitro cytotoxicity of CAR T cells was assessed using a luciferase killing assay. MDA-MB231 cancer cell line was co-cultured with 4 different CAR T cells conditions (Meso-DEL, Meso-DEL-LIGHT, Meso-28z, Meso-28z-LIGHT) with or without 100ng/mL IFNγ at 1 to 1 effector to tumor ratio for 48 hours. Plots represent 3 independent experiments with 3 different human donors. Data errors were analyzed with mean ± SEM.
Figure 4.. Single-cell multiomics profiling of LIGHT-CAR…
Figure 4.. Single-cell multiomics profiling of LIGHT-CAR T cells reveals more activated cell states with…
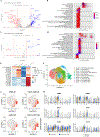
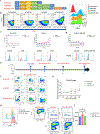
Figure 4.. Single-cell multiomics profiling of LIGHT-CAR T cells reveals more activated cell states with higher expression of cytotoxicity genes and cytokines/chemokines upon co-culture with cancer cells.
(A) Volcano plot depicting differentially expressed genes between LIGHT-CAR T cells (Meso-28z-LT, blue) and control CAR T cells (Meso-28z, red) at rest (t0). The x-axis indicates log fold-change of the average expression between the groups. The y-axis indicates negative log of the adjusted P-value based on Bonferroni correction using all features in the dataset. (B) Gene ontology (GO) terms enriched in differentially expressed genes in LIGHT-CAR T cells (Meso-28z-LT) compared to control CAR T cells (Meso-28z) at (t0). LIGHT-CAR T cells are enriched for expression of genes involved in T cell activation, signaling receptor binding, and cell secretion/export. (C) Volcano plot depicting differentially expressed genes between LIGHT-CAR T cells (Meso-28z-LT) and control CAR T cells (Meso-28z) 48 hours after co-culture with cancer cells (t48). (D) GO terms enriched in differentially expressed genes in LIGHT-CAR T cells (Meso-28z-LT) compared to control CAR T cells (Meso-28z) 48 hours after co-culture with cancer cells (t48). LIGHT-CAR T cells are enriched for expression of genes involved in receptor-ligand activity, cytokine activity, and T cells migration/chemotaxis. (E) Heatmap displaying differentially expressed surface protein in LIGHT-CAR T cells (Meso-28z-LT) compared to control CAR T cells (Meso-28z) at rest (t0) and 48 hours after co-culture with cancer cells (t48). LIGHT-CAR T cells show higher expression of activation markers at both timepoints. (F) Weighted-nearest neighbor (WNN) UMAP of single cells (n=28,855) integrated and clustered based on a weighted combination of RNA and antibody-derived tag (ADT). Clusters or shared cell states were annotated based on conserved gene and surface protein expression across conditions and previously known markers of T cell type, proliferation, activation, cytotoxicity, and cytokines. (G) Expression of a custom cytotoxicity gene set (GZMA, GZMH, GZMM, GZMK, NKG7, GNLY, PRF1) in LIGHT-CAR T cells (Meso-28z-LT) compared to control CAR T cells (Meso-28z) at rest (t0) and 48 hours after co-culture with cancer cells (t48) projected onto the WNN UMAP. (H) Violin plots comparing expression of indicated genes in distinct clusters of LIGHT-CAR T cells (Meso-28z-LT) compared to control CAR T cells (Meso-28z) 48 hours of co-culture with cancer cells (t48)
Figure 5.. LIGHT-CAR T cells limit PDAC…
Figure 5.. LIGHT-CAR T cells limit PDAC tumor outgrowth and confers survival benefit in subcutaneous…
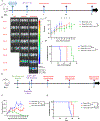
Figure 5.. LIGHT-CAR T cells limit PDAC tumor outgrowth and confers survival benefit in subcutaneous xenograft model of PDAC.
(A) Schematics of LIGHT-CAR T cell treating a mesothelin-expressing PDAC cell line, (AsPC1), in a xenograft flank model. (B) Tumor burden (mm3) quantified by caliper measurement ([L*W*W]/2) post-CAR T cell treatment (days). (C) Representative bioluminescent images (BLI) show tumor growth of PDAC in untreated and CAR T cell-treated groups (various constructs) at days (D) post-CAR T cell treatment. (D) Kaplan–Meyer plot showing mouse survival days post CAR T cell treatment (AsPC1). (E) NCG mice were subcutaneously injected with 2 × 10⁶ MIAPACA2 PDAC cell line. Mice were randomly assigned to groups 14 days later and were infused intravenously with 2 × 10⁶ CAR-T cells. Tumor growth was assessed weekly via BLI using in vivo imaging (IVIS). (F) Total flux (photons/second [p/s]) shows tumor burden in mice treated with various CAR T cell constructs at days post-CAR T cell treatment. Whole-body BLI via IVIS with standard error of the mean (SEM). (G) Representative BLI images show tumor growth of MIAPACA2 in CAR T cell treated groups (various constructs) at days (D) post treatment. (H) Kaplan–Meyer plot showing mouse survival days post-CAR T cell treatment (MIAPACA2).
Figure 6.. Anti-tumor response of LIGHT-CAR T…
Figure 6.. Anti-tumor response of LIGHT-CAR T cells in patient-derived orthotopic model of human PDAC.
(A) PDX PDAC2-Luc with Matrigel were engrafted into immunodeficient NCG mice via intra-pancreatic injection, followed by CAR T cell treatment 7 days later. Tumor growth was assessed weekly via bioluminescence imaging (BLI) using in vivo imaging (IVIS). (n=5 mice per group) (B) Representative BLI show tumor growth in untreated and CAR T cell-treated groups at various days post-CAR T cells treatment. (C) Total flux (photons/second [p/s]) shows tumor burden in mice treated with various CAR T cell constructs at various days post-CAR T cell treatment. Whole-body BLI via IVIS with mean ± SEM. (D) Kaplan–Meyer plot showing mouse survival days post CAR T cell treatment (PDAC2). (E) PDX PAAD_53a with Matrigel were engrafted into immunodeficient NSG mice via intra-pancreatic injection, followed by CAR T cell treatment 28 days days later. Tumor growth was assessed weekly via ultrasound and tumor volume was calculated with Vevo Lab software using the following equation. (F) Tumor burden of mice treated with CAR T cells measured with ultrasound and calculated using Vevo Labs software. (G) Kaplan–Meyer plot showing mouse survival days post CAR T cell treatment (PAAD_53a). (n=5) mice per treatment group.
Figure 7.. LIGHT-CAR T cells display no…
Figure 7.. LIGHT-CAR T cells display no significant toxicity in immunocompetent mouse models and non-cancerous…
Figure 7.. LIGHT-CAR T cells display no significant toxicity in immunocompetent mouse models and non-cancerous cell types.
(A) Schematics of CAR designs with or without LIGHT. Anti-mCD19 ScFv constructs for the syngeneic model are illustrated. m19mt-DEL construct serves as a negative CAR control without intracellular signaling upon antigen recognition. (B) Transgene expression of the CAR constructs after retroviral transduction of mouse T cells. (C) Mouse CD19-CAR T cells were cocultured with tumor cells expressing GFP and firefly luciferase at different effector to tumor cell ratios. 1928z-LIGHT CAR T cells exhibited better cytotoxicity against CD19-negative cancer cell lines. Expression of mesothelin and LTβR with the corresponding cell lines are shown. (D) Knockout (KO) of LTβR in the B16F10 melanoma cell line abolished the killing advantage of CD19-LIGHT CAR T cells. (E) mCD19-CAR T cells were engrafted into immunocompetent C57/BL6 mice followed by peripheral blood collection with retro-orbital eye bleed at days 7, 14, and 30. At the day 30 endpoint, the mice were sacrificed for full necropsy for analysis of potential toxicity in various organs and tissues. (F) Flow cytometry analysis of B cells, T cells, and myeloid cells from peripheral blood of C57/BL6 mice with CAR T cell infusion at D14. (G) Relative weight change (percent change in initial weight) in the days following injection of various mouse CAR T cell constructs. (H) Human CAR T cells expressing LIGHT were cocultured for 72 hours with HUVEC stained with Celltrace Far Red dye. Flow cytometry analysis displayed 2 distinct populations and no reduction in HUVEC cell number were observed with LIGHT-CAR T cells. (I) Quantification of HUVEC count after 72 hours of coculture with CAR T cells with and without LIGHT. Plots represent 3 independent experiments with 3 different human donors.
Brentjens RJ, Davila ML, Riviere I, Park J, Wang X, Cowell LG, et al. CD19-targeted T cells rapidly induce molecular remissions in adults with chemotherapy-refractory acute lymphoblastic leukemia. Sci Transl Med 2013;5(177):177ra38 doi 10.1126/scitranslmed.3005930.
-
DOI
-
PMC
-
PubMed
Shah NN, Fry TJ. Mechanisms of resistance to CAR T cell therapy. Nat Rev Clin Oncol 2019;16(6):372–85 doi 10.1038/s41571-019-0184-6.
-
DOI
-
PMC
-
PubMed
Yeku OO, Purdon TJ, Koneru M, Spriggs D, Brentjens RJ. Armored CAR T cells enhance antitumor efficacy and overcome the tumor microenvironment. Sci Rep 2017;7(1):10541 doi 10.1038/s41598-017-10940-8.
-
DOI
-
PMC
-
PubMed
Wang J, Lo JC, Foster A, Yu P, Chen HM, Wang Y, et al. The regulation of T cell homeostasis and autoimmunity by T cell-derived LIGHT. J Clin Invest 2001;108(12):1771–80 doi 10.1172/JCI13827.
-
DOI
-
PMC
-
PubMed
Mauri DN, Ebner R, Montgomery RI, Kochel KD, Cheung TC, Yu GL, et al. LIGHT, a new member of the TNF superfamily, and lymphotoxin alpha are ligands for herpesvirus entry mediator. Immunity 1998;8(1):21–30 doi 10.1016/s1074-7613(00)80455-0.
-
DOI
-
PubMed