. 2024 Jul 2;36(7):1619-1633.e5.
doi: 10.1016/j.cmet.2024.06.001.

Proteomic predictors of individualized nutrient-specific insulin secretion in health and disease

Affiliations

Proteomic predictors of individualized nutrient-specific insulin secretion in health and disease

Jelena Kolic et al. Cell Metab. .

Abstract

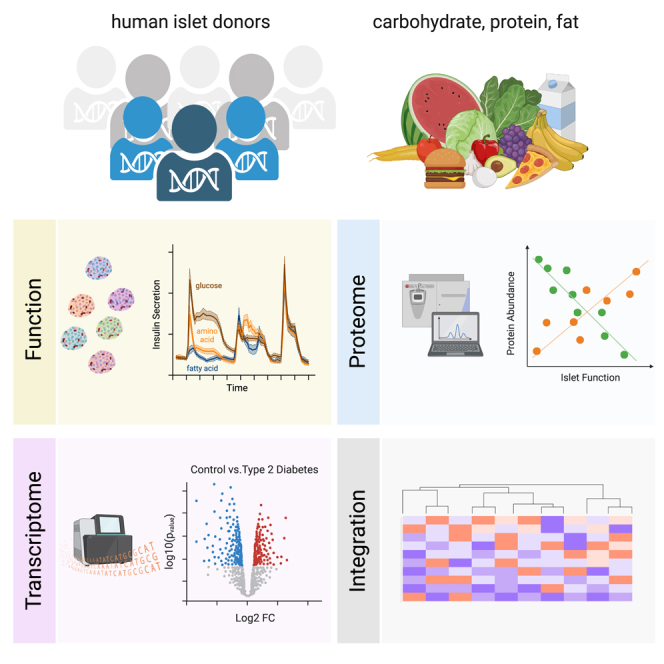
Population-level variation and mechanisms behind insulin secretion in response to carbohydrate, protein, and fat remain uncharacterized. We defined prototypical insulin secretion responses to three macronutrients in islets from 140 cadaveric donors, including those with type 2 diabetes. The majority of donors' islets exhibited the highest insulin response to glucose, moderate response to amino acid, and minimal response to fatty acid. However, 9% of donors' islets had amino acid responses, and 8% had fatty acid responses that were larger than their glucose-stimulated insulin responses. We leveraged this heterogeneity and used multi-omics to identify molecular correlates of nutrient responsiveness, as well as proteins and mRNAs altered in type 2 diabetes. We also examined nutrient-stimulated insulin release from stem cell-derived islets and observed responsiveness to fat but not carbohydrate or protein-potentially a hallmark of immaturity. Understanding the diversity of insulin responses to carbohydrate, protein, and fat lays the groundwork for personalized nutrition.

Keywords: RNA-seq; human islets; insulin secretion; macronutrients; proteomics; stem cell-derived islets; type 2 diabetes.


Conflict of interest statement

Declaration of interests A.L.G. declares that her spouse holds stock options in Roche and is an employee of Genentech.

Figures

None
Graphical abstract
Figure 1
Figure 1
Nutrient-stimulated insulin secretion, transcriptomes, and proteomes from ND and T2D islets (A) Histogram with trend line of ages for male (green, solid line) and female (yellow, dashed line) donors. Additional details of islet isolation parameters and donor characteristics are available in Table S1 and on www.humanislets.com. (B) Averaged traces of dynamic insulin secretion measurements in response to glucose (15 or 6 mM), leucine (5 mM), oleate and palmitate (1.5 mM, 1:1 mixture), or KCl (30 mM) in islets isolated from ND donors (n = 123) (left) and donors with T2D (n = 17) (right) are shown as indicated. Basal glucose was 3 mM. Error bars (SEM) are depicted by continuous shaded regions around the corresponding solid lines. (C) RNA-seq identified enriched mRNAs in islets from ND donors (n = 82), shown in teal, and enriched mRNAs in islets from donors with T2D (n = 8), shown in red. The top 40 significant differentially expressed transcripts are labeled with their gene names. (D) Mass-spectrometry-based proteomics identified enriched proteins in ND (n = 118) in teal and T2D (n = 16) in red. The top 40 significant differentially abundant proteins are highlighted by labeling with their gene names. (E) (Top) Venn diagrams show the overlap of differentially expressed mRNAs and abundant proteins, further depicted in the correlation plot (bottom). (F) Across-gene correlation between mRNAs and proteins. (G) Differentially abundant proteins (with a greater than 0.5 log2 fold change) between the ND and T2D donor islets were connected in a protein-protein interaction network (gold lines) using STRING and depicted in the context of their beta cell compartments and functions. The color of the nodes represents the fold change (ND/T2D), while the thickness of the line around the nodes represents the p value (adjusted).
Figure 2
Figure 2
Clustering heterogeneous insulin responses to macronutrients and donor proteomes (A) (Left) Individual traces of dynamic insulin secretion stimulated by glucose (15 or 6 mM) or KCl (30 mM). Basal glucose was 3 mM. Average responses from ND donors are illustrated with solid teal line, and average responses from donors with T2D are shown in the dashed salmon line. Floating dot plot inserts illustrate the heterogeneity in insulin AUC for the corresponding section of the perfusion curve (salmon dots illustrate the responses from donors with T2D). Middle panel shows islets stimulated with leucine (5 mM) alone or in combination with 6 mM glucose, as indicated. Right shows islets stimulated with oleate/palmitate (1.5 mM, 1:1 mix) alone or in combination with 6 mM glucose, as indicated. (B) Illustrates the same as (A) except in mouse islets (8 males, 9 females, 7–90 weeks of age). Floating box plots illustrate the variance of AUC responses between the mouse islet (brown, orange, or blue) and human islet (gray) responses. ∗∗∗ indicates p < 0.001 and ∗∗∗∗ indicates p < 0.0001. (C) Co-correlation analysis identified 18 distinct modules of proteins whose abundance shows similar patterns. Modules are annotated with KEGG pathways and GO terms. The Pearson correlation coefficients between the modules and the donor metadata or functional data (x axis) are shown in each rectangle, and the corresponding adjusted p value is shown in the brackets. Positive correlations are shown in shades of red and negative in shades of blue. Significant correlations are highlighted with black box outlines. (D) Illustrates the main connections in the co-expression network. The WGCNA adjacency matrix was filtered to remove: (1) any protein not in a module, (2) protein-protein adjacency distances less than 0.2, and (3) any protein without any connections after filters 1 and 2. The resulting network contained 1,600 protein nodes and 16,209 edges. Each protein node is colored according to its module (same color scheme as C).
Figure 3
Figure 3
Regression coefficients of individual proteins with insulin secretory responses (A–I) Volcano plots are shown depicting significant positive (red) and negative (blue) linear regression coefficients of proteins to continuous donor characteristics: (A) donor age and (B) HbA1c; or functional parameters in response to (C) 3 mM glucose, (D) 15 mM glucose, (E) 6 mM glucose, (F) 5 mM leucine, (G) 1.5 mM oleate/palmitate (1:1 mixture), (H) 1.5 mM oleate/palmitate + 6 mM glucose, and (I) 30 mM KCl. Protein abundances (log2) are depicted by size of circle, and the coefficient of variation (log10) is depicted by color gradient. (J) Venn diagram showing the overlap of the number of protein abundances that positively associate with the indicated nutrient stimuli following adjustment for T2D disease status diagnosis. (K) Heat map depicts the top 50 most positively associated proteins to the indicated stimuli. (L and M) Shows the same as (J) and (K), but for negative associations.
Figure 4
Figure 4
Prototypical responses and proteomic profiles of fat and protein hyper-responders (A) The average insulin secretion response from donors classified as fatty acid high responders is shown in dark blue (n = 11), and the average insulin secretion response from donors classified as “low responders” is shown in the light blue (n = 129). Error bars (SEM) are depicted by continuous shaded regions around the corresponding solid lines. (B) Principal component analysis (PCA) plot of protein abundances in the high (dark blue circles) vs. low (light blue circles) fatty acid responders. (C) Volcano plot showing differential protein abundances between high and low fatty acid responders. (D) The average insulin secretion response from donors classified as “high protein responders” is shown in orange (n = 13), and the average insulin secretion response from donors classified as “low protein responders” is shown in yellow (n = 127). Error bars (SEM) are depicted by continous shaded regions around the corresponding solid lines. (E) PCA plot of protein abundances in the high (orange circles) vs. low (yellow circles) protein responders. (F) Volcano plot showing differential protein abundances between high and low protein responders.
Figure 5
Figure 5
Nutrient responses and proteomic profiles of stem cell-derived islet-like clusters (A) Summary of the human embryonic stem cell-derived islet-like clusters differentiation protocol. (B) Representative images of unsorted (day 35) stem cell-derived islet-like clusters (left) and FAC-sorted (day 35) stem cell-derived beta cell-like clusters (right). (C) Averaged traces of dynamic insulin secretion measurements in response to glucose (15 or 6 mM), leucine (5 mM), oleate and palmitate (1.5 mM, 1:1 mixture), or KCl (30 mM) in stem cell-derived islet-like clusters (average of 8 younger-immature and 8 older-maturing preparations). Basal glucose was 3 mM. For comparison, the average human islet dynamic insulin secretion measurement traces are shown in the dashed lines. Error bars (SEM) are depicted by continous shaded regions around the corresponding solid lines. (D) PCA plot of protein abundances in the stem cell-derived islet-like clusters (n = 25) (blue circles) compared with donors with T2D (salmon circles, n = 16) and ND donors (teal circles) (n = 118). (E) Volcano plot showing differential protein abundances between stem cell-derived islet-like clusters (blue circles, n = 25) and ND donors (teal circles, n = 118). The top 40 most significant differentially abundant proteins are highlighted by labeling with gene name. (F) (Left) Compares average dynamic insulin secretion stimulated by glucose (15 or 6 mM) or KCl (30 mM) between younger-immature (dashed brown lines, n = 8) and older-maturing (solid brown lines, n = 8) clusters. Basal glucose was 3 mM. Floating dot plot inserts illustrate the AUC responses for the corresponding section of the perfusion curve between younger-immature clusters (black circles) and older-maturing clusters (open circles). Error bars (SEM) are depicted by continous shaded regions around the corresponding dashed or solid lines. (Middle) Illustrates the same as (left) except stem cell-derived islet-like clusters were stimulated with leucine (5 mM) alone or in combination with 6 mM glucose as depicted in the figure panel. (Right) Illustrates the same as (left), except islet-like clusters were stimulated with oleate/palmitate (1.5 mM, 1:1 mixture) alone or in combination with 6 mM glucose. (G and H) (G) PCA plot and (H) volcano plot of protein abundances comparing the younger-immature clusters (light green, n = 14) and older-maturing clusters (dark green, n = 10).

Update of

References

    1. Kayton N.S., Poffenberger G., Henske J., Dai C., Thompson C., Aramandla R., Shostak A., Nicholson W., Brissova M., Bush W.S., Powers A.C. Human islet preparations distributed for research exhibit a variety of insulin-secretory profiles. Am. J. Physiol. Endocrinol. Metab. 2015;308:E592–E602. doi: 10.1152/ajpendo.00437.2014. - DOI - PMC - PubMed
    1. Lyon J., Manning Fox J.E., Spigelman A.F., Kim R., Smith N., O'Gorman D., Kin T., Shapiro A.M.J., Rajotte R.V., MacDonald P.E. Research-Focused Isolation of Human Islets From Donors With and Without Diabetes at the Alberta Diabetes Institute IsletCore. Endocrinology. 2016;157:560–569. doi: 10.1210/en.2015-1562. - DOI - PubMed
    1. Alcazar O., Buchwald P. Concentration-Dependency and Time Profile of Insulin Secretion: Dynamic Perifusion Studies With Human and Murine Islets. Front. Endocrinol. (Lausanne) 2019;10:680. doi: 10.3389/fendo.2019.00680. - DOI - PMC - PubMed
    1. Cen J., Sargsyan E., Bergsten P. Fatty acids stimulate insulin secretion from human pancreatic islets at fasting glucose concentrations via mitochondria-dependent and -independent mechanisms. Nutr. Metab. (Lond.) 2016;13:59. doi: 10.1186/s12986-016-0119-5. - DOI - PMC - PubMed
    1. Henquin J.C., Dufrane D., Nenquin M. Nutrient control of insulin secretion in isolated normal human islets. Diabetes. 2006;55:3470–3477. doi: 10.2337/db06-0868. - DOI - PubMed

LinkOut - more resources