. 2024 Aug 22;187(17):4605-4620.e17.
doi: 10.1016/j.cell.2024.06.010. Epub 2024 Jul 2.

The germline coordinates mitokine signaling

Affiliations

The germline coordinates mitokine signaling

Koning Shen et al. Cell. .

Abstract

The ability of mitochondria to coordinate stress responses across tissues is critical for health. In C. elegans, neurons experiencing mitochondrial stress elicit an inter-tissue signaling pathway through the release of mitokine signals, such as serotonin or the Wnt ligand EGL-20, which activate the mitochondrial unfolded protein response (UPRMT) in the periphery to promote organismal health and lifespan. We find that germline mitochondria play a surprising role in neuron-to-periphery UPRMT signaling. Specifically, we find that germline mitochondria signal downstream of neuronal mitokines, Wnt and serotonin, and upstream of lipid metabolic pathways in the periphery to regulate UPRMT activation. We also find that the germline tissue itself is essential for UPRMT signaling. We propose that the germline has a central signaling role in coordinating mitochondrial stress responses across tissues, and germline mitochondria play a defining role in this coordination because of their inherent roles in germline integrity and inter-tissue signaling.

Keywords: C. elegans; aging; germline; lipids; mitochondria; mtUPR; proteostasis; stress response.


Conflict of interest statement

Declaration of interests The authors declare no competing interests.

Figures

Figure 1:
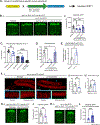
Figure 1:. Mutagenesis screen reveals the requirement of ucr-2.3 in neuron-to-intestine UPRMT signaling
a. Schematic of cell non-autonomous UPRMT signaling model in C. elegans. b. Fluorescence imaging (i) and quantification (ii) of intestinal UPRMT. The Q40::YFP signal in neurons is denoted with an orange arrowhead. The intestinal UPRMT transcriptional reporter signal hsp-6p::GFP is denoted with green brackets. ****p<0.0001; n > 3. c. Fluorescence imaging (i) and quantification (ii) of intestinal UPRMT ****p<0.0001; n > 3. d. Fluorescence imaging (i) and quantification (ii) of intestinal UPRMT. p = 0.6372; n > 3. See also Figure S1 and Figure S2.
Figure 2:
Figure 2:. UCR-2.3 is a mitochondrial protein in C. elegans with a non-canonical role in cell non-autonomous UPRMT signaling
a. (i) Sub-cellular fractionation schematic. (ii) Cytosolic and mitochondrial fractions run on a western blot probed with antibodies to detect HA-tag (for the UCR-2.3 protein), NDUFS3 (a mitochondrial protein), and a-tubulin (a cytosolic protein). b. (i) Live-cell imaging showing sub-cellular localization of C. elegans UCR-2.3 in human RPE1 hTert cells. Scale bar = 5 μm. (ii) Close up of two example regions shown in (i). Scale bar = 1 μm. Data shown is representative of at least two independent imaging experiments with 5–10 images collected per cell line. c. Measurement of mitochondrial respiration (OCR, oxygen consumption rate). **p = 0.0079; n > 4. d. Fluorescence imaging comparison (i) and quantification (ii) of intestinal UPRMT between wild-type and a ucr-2.3 mutant with a deletion of the predicted mitochondrial targeting sequence (MTS). *p = 0.0103; n = 3. See also Figure S2.
Figure 3:
Figure 3:. ucr-2.3 is part of the UCR-2 family of genes that differ in their tissue expression and role in cell non-autonomous UPRMT signaling
a. Human UQCRC2 is homologous to a family of UCR-2 genes in C. elegans including ucr-2.1, ucr-2.2, and ucr-2.3. b. Fluorescence imaging comparison (i) and quantification (ii) of intestinal UPRMT. *p < 0.05, ****p < 0.0001; n = 3. c. Fluorescence imaging comparison of tissue expression patterns across the UCR-2 family genes using an endogenous transcriptional expression reporter for each gene: ucr-2.1 (i), ucr-2.2 (ii), and ucr-2.3 (iii). d. Close up head images of the endogenous transcriptional reporter as described in (C). e. Close up head imaging of ucr-2.3 endogenous transcriptional reporter crossed to a rgef-1p::GFP reporter strain, expressing GFP in neurons. See also Figure S3.
Figure 4:
Figure 4:. ucr-2.3 acts in the germline to mediate cell non-autonomous UPRMT signaling and germline mitochondrial integrity
a. Single-copy (mosSCI) tissue-specific rescue experiment for intestinal UPRMT signal in the ucr-2.3 mutant background. b. Fluorescence imaging comparison (i) and quantification (ii) of intestinal UPRMT in the tissue-specific mosSCI rescue experiment. ****p< 0.0001, all non-significant p values > 0.3924; n = 3. c. Measurement of mitochondrial respiration (OCR) at the restrictive temperature 25°C. All strains were fed control HT115 RNAi bacteria, except for the glp-4(bn2) mutant animals fed cco-1 RNAi. **p = 0.0019, ****p < 0.0001, non-significant p = 0.1051; n = 3. d. Measurement of total brood size. **p=0.0011, all non-significant p values > 0.1507; n = 3. e. qRT-PCR comparison of hsp-6 transcript levels in gonads. Transcript levels normalized by rpl-32. *p = 0.0326; n = 3. f. Fluorescence widefield imaging of germline mitochondria (i). Scale bar = 25 μm. Distal germ cells (green arrowhead) and oocytes (blue arrowhead) are shown in zoomed in images (scale bar = 10 μm). Images shown are representative of at least 5–10 animals imaged per strain in at least three independent experiments each. Quantification of mitochondrial number (ii) and mitochondrial length (iii). **p = 0.0010, *p = 0.0205; n > 2. g. Fluorescence imaging comparison (i) and quantification (ii) of of intestinal UPRMT. **p = 0.0015; n > 3. h. Fluorescence imaging comparison (i) and quantification (ii) of intestinal UPRMT. ***p=0.001; n = 2. See also Figure S4 and Table S1.
Figure 5:
Figure 5:. The germline is required for UPRMT non-autonomous signaling.
a. Comparison of fluorescence imaging and quantification of intestinal UPRMT signal in germline deficient mutants at the restrictive temperature 25°C. ****, ***p<0.0001; n = 3. b. Comparison of fluorescence imaging and quantification of intestinal UPRMT signal upon FUDR treatment. **p = 0.0034, ****p<0.0001; n = 3. See also Figure S5.
Figure 6:
Figure 6:. ucr-2.3 operates downstream of established neuronal factors in mediating cell non-autonomous UPRMT
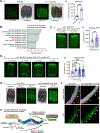
a. Known neuronal molecular players that mediate cell non-autonomous UPRMT signaling in C. elegans. b. Fluorescence imaging comparison (i) and quantification (ii) of intestinal UPRMT signal. ***p=0.0004; n = 3. c. Fluorescence imaging comparison (i) and quantification (ii) of intestinal UPRMT signal. **p=0.0052; n = 3. d. Fluorescence imaging comparison (i) and quantification of fold change increase in intestinal UPRMT signal (ii) for exogenous addition of serotonin (5-HT). *p = 0.0296, non-significant p-value = 0.3129; n = 4. See also Figure S6.
Figure 7:
Figure 7:. The germline regulates intestinal UPRMT activation in the intestine through alteration of lipid synthesis and transport pathways.
a. Nile red staining (i) and quantification (ii) of intestinal lipid levels. ****p <0.0001; n = 3. b. Enriched GO terms (biological process) in up-regulated transcripts in the ucr-2.3(uth252); rgef-1p::Q40::YFP mutant compared to rgef-1p::Q40::YFP alone. Shown are Fold enrichment values determined by the PANTHER statistical overrepresentation test. c. Fluorescence comparison (i) and quantification (ii) of intestinal UPRMT signal. **p = 0.0020; n = 2. d. Fluorescence comparison (i) and quantification (ii) of intestinal UPRMT signal. ****p < 0.0001, ***p < 0.001; n > 3. e. Comparison of vitellogenin lipoprotein levels and tissue localization. (i) Low magnification imaging at different levels of GFP exposure to illustrate differences in vitellogenin lipoprotein levels. (ii) High magnification comparison of vitellogenin localization. White and yellow arrowheads indicate location of oocyte and embryos, respectively. f. Parallel Signaling model for how germline mitochondria mediate neuron-to-intestine UPRMT stress signaling. See also Figure S7.

Update of

References

    1. Smith HJ, Sharma A, and Mair WB (2020). Metabolic Communication and Healthy Aging: Where Should We Focus Our Energy? Dev. Cell 54, 196–211. 10.1016/j.devcel.2020.06.011. - DOI - PMC - PubMed
    1. Van Oosten-Hawle P (2023). Exploiting inter-tissue stress signaling mechanisms to preserve organismal proteostasis during aging. Front. Physiol. 14, 1228490. 10.3389/fphys.2023.1228490. - DOI - PMC - PubMed
    1. Chandel NS (2014). Mitochondria as signaling organelles. BMC Biol. 12, 34. 10.1186/1741-7007-12-34. - DOI - PMC - PubMed
    1. Mottis A, Herzig S, and Auwerx J (2019). Mitocellular communication: Shaping health and disease. Science 366, 827–832. 10.1126/science.aax3768. - DOI - PubMed
    1. Shen K, Pender CL, Bar-Ziv R, Zhang H, Wickham K, Willey E, Durieux J, Ahmad Q, and Dillin A (2022). Mitochondria as Cellular and Organismal Signaling Hubs. Annu. Rev. Cell Dev. Biol. 38, annurev-cellbio-120420–015303. 10.1146/annurev-cellbio-120420-015303. - DOI - PubMed

LinkOut - more resources