. 2024 Aug 7;32(8):2676-2691.
doi: 10.1016/j.ymthe.2024.06.004. Epub 2024 Jul 2.

Human plasma cells engineered to secrete bispecifics drive effective in vivo leukemia killing

Affiliations

Human plasma cells engineered to secrete bispecifics drive effective in vivo leukemia killing

Tyler F Hill et al. Mol Ther. .

Abstract

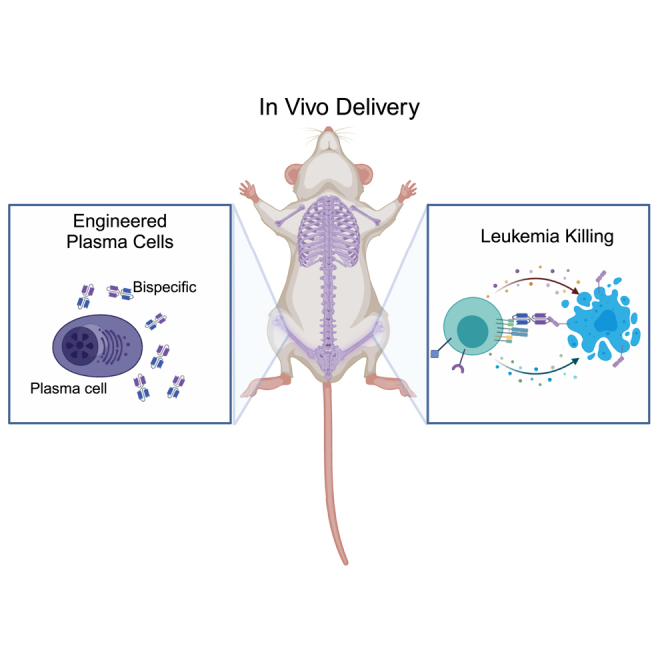
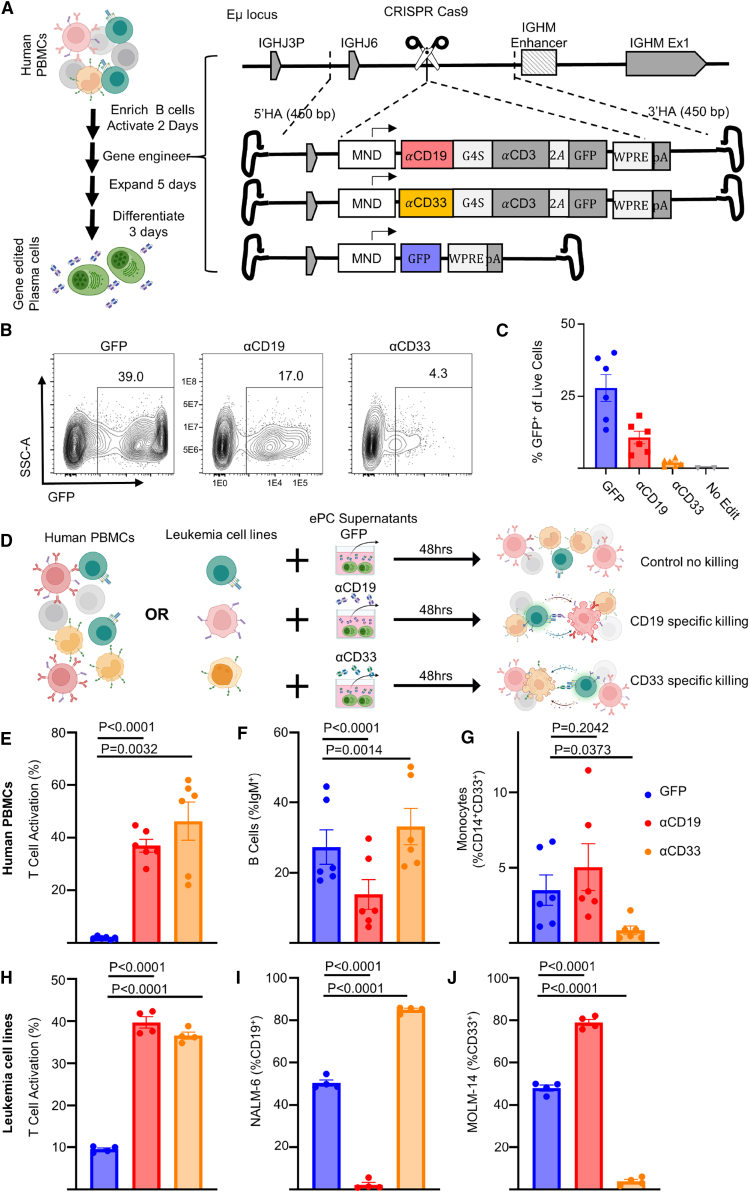
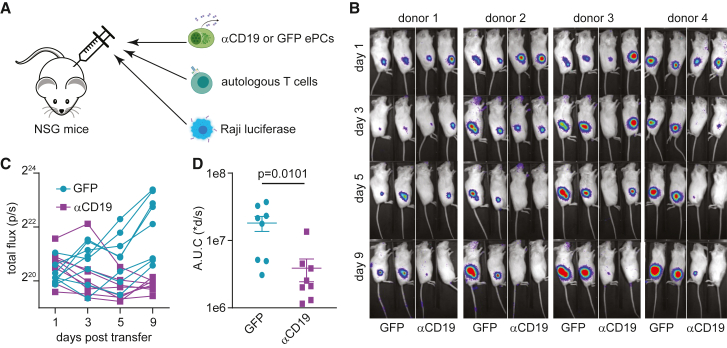
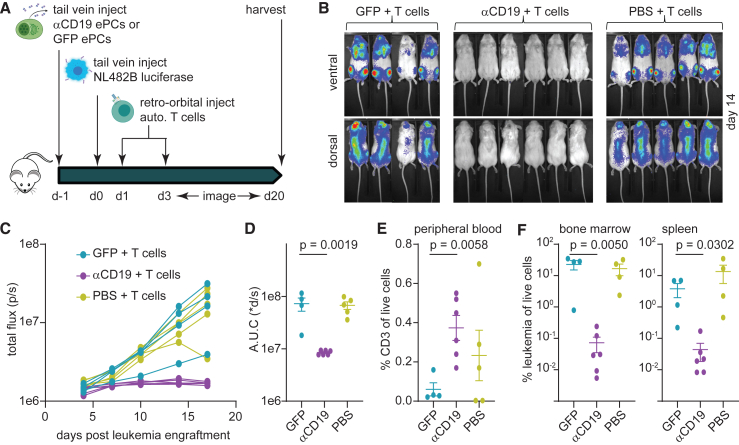
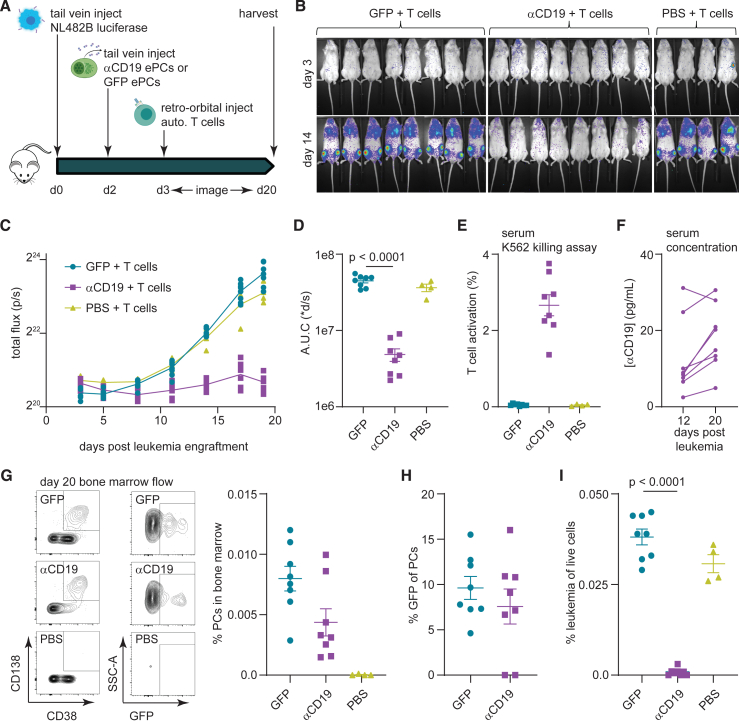
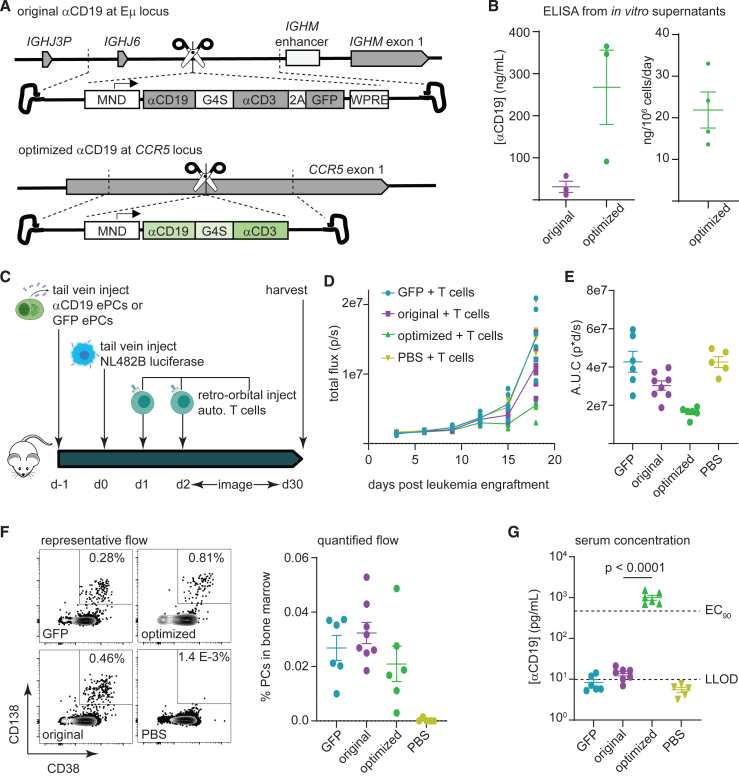
Bispecific antibodies are an important tool for the management and treatment of acute leukemias. As a next step toward clinical translation of engineered plasma cells, we describe approaches for secretion of bispecific antibodies by human plasma cells. We show that human plasma cells expressing either fragment crystallizable domain-deficient anti-CD19 × anti-CD3 (blinatumomab) or anti-CD33 × anti-CD3 bispecific antibodies mediate T cell activation and direct T cell killing of B acute lymphoblastic leukemia or acute myeloid leukemia cell lines in vitro. We demonstrate that knockout of the self-expressed antigen, CD19, boosts anti-CD19-bispecific secretion by plasma cells and prevents self-targeting. Plasma cells secreting anti-CD19-bispecific antibodies elicited in vivo control of acute lymphoblastic leukemia patient-derived xenografts in immunodeficient mice co-engrafted with autologous T cells. In these studies, we found that leukemic control elicited by engineered plasma cells was similar to CD19-targeted chimeric antigen receptor-expressing T cells. Finally, the steady-state concentration of anti-CD19 bispecifics in serum 1 month after cell delivery and tumor eradication was comparable with that observed in patients treated with a steady-state infusion of blinatumomab. These findings support further development of ePCs for use as a durable delivery system for the treatment of acute leukemias, and potentially other cancers.

Keywords: T cell engager; bispecific; engineered plasma cells; engineering; engraftment; gene editing; in vivo; leukemia; plasma cells.


Conflict of interest statement

Declaration of interests R.G.J and D.J.R. have an equity ownership position in Be Biopharma Incorporated. J.N.E., M.D.L., K.M.M, and R.A.M. are employees of and shareholders in Be Biopharma Incorporated. A provisional patent application covering applications of binders secreted from B cells and plasma cells has been filed by T.F.H., R.G.J., and D.J.R.

Figures

None
Graphical abstract
Figure 1
Figure 1
Genome-engineered primary human B cells secrete functional αCD19-bispecific in a locus-dependent manner (A) Schematic showing the experimental flow of a primary B cell experiment. Briefly, after isolation from PBMCs, B cells were edited to express either BFP or αCD19.T2A.GFP transgenes at CCR5 genetic loci via HDR-gene editing with AAV6 delivered DNA repair templates. Five days later, genomic DNA and supernatant was collected from 1 × 106 cells and supernatants were analyzed as indicated. (B) Transgene integration at CCR5 locus shown here as HDR allele frequency was measured by digital droplet PCR (ddPCR) from 25 ng genomic DNA. (C) Representative flow cytometry plots showing transgene expression of fluorescent proteins in engineered B cells shown and quantified as percent edited of live cells. (D) Ratio of engineering rate as determined by ddPCR vs. flow cytometry. (E) Schematic showing the editing strategies for delivery of GFP or αCD19.T2A.GFP to antibody-associated loci. (F) Representative flow cytometry plots of αCD19.T2A.GFP edited B cells with (G) the quantification of percent edited and GFP mean fluorescent intensity of edited cells. (H) K562 killing assay schema. Supernatants from edited B cells were incubated with target (CD19+) and control (CD19) K562 cells with CD8+ T cells for 48 h. Cells were harvested for flow cytometry to obtain (I) specific lysis of CD19+ K562 and (J) T cell activation (%CD69+CD137+ of CD3+ cells). (K) The concentration of bispecific in the supernatants as interpolated from percent T cell-activated data. Data are from five donors in five independent experiments. Error bars represent SEM. p values calculated using (D) a paired Student’s t test and (G, I–K) paired one-way ANOVAs with Dunnett’s post-test. Illustrations were created in part with biorender.com.
Figure 2
Figure 2
Human plasma cells engineered to secrete anti-leukemia bispecifics specifically target cells expressing physiological levels of antigen Primary human B cells were isolated and cultured for 2 days in activating media then edited. (A) Schematic showing how primary activated human B cells were edited to express GFP, αCD19.T2A.GFP, or αCD33.T2A.GFP. After editing activated B cells, the engineered cells were then cultured in expansionary media for 5 days followed by differentiation into PCs over 3 days and cells and supernatants. (B) Representative flow cytometry plots assessing editing via expression of GFP and (C) quantification as percent of live cells. (D) Schematic illustrating in vitro PBMC or leukemia cell line killing assays. Briefly, autologous CD8+ T cells are co-cultured with PBMCs or mixed leukemia cell populations (NALM-6 and MOLM-14) in the presence of supernatants from ePCs for 48 h. Flow cytometry was used to quantify (E) T cell activation (%CD69+CD137+ of CD3+ cells), (F) the percent B cells (IgM+) of live cells, (G) the percent monocytes (CD14+CD33+) of live cells in PBMC cultures at the end of the 48-h co-culture. Likewise flow cytometry was used to quantify (H) T cell activation (%CD69+,CD137+ of CD8+ cells), the frequency of (I) NAML-6 (CD19+) and (J) MOLM-14 (CD33+) in the leukemia cell line killing assay. In (E–G), data were obtained from six donors in three independent experiments, and in (H–J), data were obtained from four donors. Error bars represent SEM. The p values were calculated using paired one-way ANOVAs with Dunnett’s posttest. Illustrations were created in part with biorender.com.
Figure 3
Figure 3
CD19 knockout prevents self-targeting of αCD19-ePCs and increases αCD19-bispecific secretion (A) Schematic showing the self-targeting assay of ePCs with and without CD19 knockout. Primary human B cells were engineered to express either GFP or αCD19.T2A.GFP at the Eμ locus, and/or to eliminate CD19. These engineered cells were incubated with the indicated ratios of autologous T cells. (B) After 24 h, flow cytometry was used to calculate the percentage of GFP+ of live CD20+ B cells. The relative quantity of transgene-expressing cells was plotted. sgRNAs targeting CD19 were included to elicit knock out CD19 while engineering into the Eμ. Representative flow cytometry images (C) and quantification (D) of CD19 expression in engineered cells is shown. (E) CD19KO cells were incubated with the indicated ratios of T cells for 24 h. After incubation of edited cells with T cells, we used flow cytometry to quantify the percent GFP+ of CD20+ cells. (F) Combined data showing the GFP percentage after incubation of edited cells with T cells at a 9:1 ratio. (G–I) Engineered B cells were further differentiated over 3 days into ePCs. Supernatants from CD19KO and WT αCD19 ePCs were incubated with T cells, K562 CD19+, and K562 CD19 cells for 48 h. (G) Specific lysis of CD19+ K562 and (H) T cell activation (%CD69+CD137+ of CD3+ cells) was quantified. (I) αCD19 bispecific concentration was interpolated using recombinant αCD19 bispecific standards curves. These data are from four donors. Error bars represent SEM. The p values were calculated by paired one-way ANOVA with Dunnett’s posttest (F) and paired Student’s t test (G–I). Illustrations created in part with biorender.com.
Figure 4
Figure 4
CD19KO PCs engineered to secrete αCD19 bispecific have anti-lymphoma efficacy in vivo (A) Schematic showing an in vivo model for lymphoma growth. Briefly, GFP.CD19KO or αCD19.GFP.CD19KO ePCs, autologous T cells, and luciferase expressing Raji cells were injected subcutaneously into the right flank of immunodeficient NSG mice. (B) Representative bioluminescence images were obtained via in vivo imaging (color scale; minimum: 8 × 103 and maximum: 1 × 105). (C) Bioluminescence was quantified from each mouse as total flux and graphed over time. (D) Area under the curve analysis was conducted with baseline correction of 6 × 105 flux. (A–D) Data across four donors in two independent experiments with p values calculated by unpaired Student’s t test. Illustrations created in part with biorender.com.
Figure 5
Figure 5
CD19KO PCs engineered to secrete αCD19 bispecific can prevent leukemia engraftment (A) Schematic showing prophylactic treatment of a patient-derived xenograft model of high-risk ALL. Either PBS, GFP.CD19KO or αCD19.GFP.CD19KO ePCs were injected intravenously into immunodeficient NSG mice. We administered, 24 h later, luciferase-labeled patient-derived NL482B (Children’s Oncology Group unique specimen identifier PALJDL) cells. Finally, we delivered T cells derived from the same genetic donor as the ePCs in two doses by retro-orbital injection. (B) Bioluminescent images showing dissemination of the luciferase-expressing leukemia cells (color scale; minimum: 8 × 103 and maximum: 1 × 105). (C) Leukemia growth was quantified via total bioluminescent flux at the indicated time points. (D) Area under the curve analysis was conducted with baseline correction 1 × 106 flux. (E) Peripheral blood flow analysis showing the percent of CD3+ cells of singlet live cells is elevated in the αCD19 cohort. Mice were euthanized 34 days after leukemia engraftment and tissues were stained and analyzed by flow. (F) The percent CD19+ of live CD45+ singlet cells shows suppression of leukemic cells in bone and spleens of the αCD19 ePC cohort. (A–F) Data from one donor with p values calculated by one-way unpaired ANOVA with Šídák’s posttest (D) and unpaired Student’s t test between GFP and αCD19 cohorts (E and F). Illustrations created in part with biorender.com.
Figure 6
Figure 6
αCD19 bispecific secreting ePCs can persist in bone marrow and treat established leukemia (A) Schematic showing therapeutic treatment of a patient-derived xenograft model of high-risk ALL. Luciferase-labeled patient-derived NL482B (Children’s Oncology Group unique specimen identifier PALJDL) cells were administered intravenously. After 48 h, either PBS, GFP.CD19KO, or αCD19.GFP.CD19KO ePCs were injected intravenously into immunodeficient NSG mice. We delivered T cells syngeneic to the ePCs via retro-orbital injection 24 h later. (B) Bioluminescent images showing dissemination of the luciferase-expressing leukemia cells (color scale; minimum: 5 × 10e3 and maximum: 5 × 10e4). (C) Leukemia growth was quantified via total bioluminescent flux at the indicated time points. (D) Area under the curve analysis was conducted with baseline correction 1.25 × 106 flux. Peripheral blood sera from mice at day 12 and day 20 was collected and used in the previously described K562 Killing assay. (E) T cell action (%CD69+CD137+) caused by sera from mice 20 days after tumor engraftment is shown. (F) Concentration of αCD19 bispecific in the mouse sera were interpolated from a standard curve. Twenty days after tumor engraftment, bone marrow cells were harvested, stained, and analyzed by flow cytometry. (G) The percent of tumor (huCD19+huCD45+moCD45) of live cells was quantified. (H) Representative flow plots of human cells show plasma cells present in the bone marrow of mice that received ePCs. The percent of plasma cells (huCD38+huCD45+moCD45-huCD138+) of live cells was calculated. (I) The percentage of plasma cells that were GFP+ was quantified and plotted. Data from one donor with p values calculated by one-way unpaired ANOVA with Šídák’s post-test. Illustrations created in part with Biorender.com.
Figure 7
Figure 7
Optimized bispecific expression construct achieved clinically relevant levels of bispecific in the peripheral blood 30 days after ePC engraftment (A) Schematic illustrating alterations between the original αCD19 and the optimized αCD19 expression constructs. (B) Levels of αCD19 bispecific from day 14 αCD19-ePCs supernatants as measured by ELISA. (C) Schematic of a sub-therapeutic leukemia treatment model for comparing original and optimized αCD19 ePCs. Immunodeficient NSG mice were intravenously injected with PBS, GFP.CD19KO, original αCD19.GFP.CD19KO, or optimized αCD19.GFP.CD19KO ePCs, followed 24 h later by luciferase-labeled patient-derived NL482B cells. Finally, we delivered suboptimal doses of T cells derived from the same genetic donor as the ePCs. (D) Leukemia growth was quantified via total bioluminescent flux at the indicated time points. (E) Area under the curve analysis was conducted with baseline correction 1.25 × 106 flux. Bone marrow and peripheral blood were harvested from the mice 30 days after the engraftment of ePCs. Red blood cells were lysed. (F) Bone marrow samples were stained for human plasma cell markers and quantified relative to total bone marrow cells. (G) αCD19 levels were measured in the peripheral sera via a K562 killing assay. Error bars represent standard error (B) Data from three to four biologic donors. (D, E, and G). Data from one biologic donor (6 mice per condition) with p value calculated by one-way unpaired ANOVA t test with Šídák’s post-test. Illustrations created in part with Biorender.com.
Figure 8
Figure 8
Optimized αCD19 ePCs eradicate leukemia as well as FCM63 CAR-T cells Anti-CD3/CD28 bead activated T cells were transduced to express a CAR containing the CD19-targeting FCM63 single chain variable fragment (scFv). (A) NSG mice were inoculated with 1 × 105 NL482 luciferase expressing B-ALL. Five days later they received 2–5 × 106 αCD19-ePCs, or 2–5 × 106 αCD33-ePCs or PBS. The following day, ePC engrafted and one-half of the PBS treat mice received 3 × 106 autologous T cells while the remaining PBS treated mice received 3 × 106 CAR-T cells. (B) Bioluminescent images showing dissemination of the luciferase-expressing leukemia cells (color scale; minimum: 6.5 × 103 and maximum: 7 × 104). (C) Leukemia growth was quantified via total bioluminescent flux at the indicated time points. (D) Area under the curve analysis was conducted with baseline correction 5 × 105 flux. Bone marrows were harvested from the mice 25 days after the engraftment of leukemia. Red blood cells were lysed. (E) Bone marrow samples were stained for human plasma cell, T cell, and leukemia markers and quantified relative to total bone marrow cells. Error bars represent the SE. Data from one donor with p values calculated by one-way unpaired ANOVA with Šídák’s posttest (D and E). Illustrations created in part with Biorender.com.

Update of

References

    1. Mullard A. FDA approves first CAR T therapy. Nat. Rev. Drug Discov. 2017;16:669. - PubMed
    1. Waldman A.D., Fritz J.M., Lenardo M.J. A guide to cancer immunotherapy: from T cell basic science to clinical practice. Nat. Rev. Immunol. 2020;20:651–668. - PMC - PubMed
    1. Siegel R.L., Miller K.D., Fuchs H.E., Jemal A. Cancer Statistics, 2021. CA. Cancer J. Clin. 2021;71:7–33. - PubMed
    1. Kantarjian H., Stein A., Gökbuget N., Fielding A.K., Schuh A.C., Ribera J.-M., Wei A., Dombret H., Foà R., Bassan R., et al. Blinatumomab versus Chemotherapy for Advanced Acute Lymphoblastic Leukemia. N. Engl. J. Med. 2017;376:836–847. - PMC - PubMed
    1. Przepiorka D., Ko C.-W., Deisseroth A., Yancey C.L., Candau-Chacon R., Chiu H.-J., Gehrke B.J., Gomez-Broughton C., Kane R.C., Kirshner S., et al. FDA Approval: Blinatumomab. Clin. Cancer Res. 2015;21:4035–4039. - PubMed

LinkOut - more resources