. 2024 Aug:86:101983.
doi: 10.1016/j.molmet.2024.101983. Epub 2024 Jul 1.

Deletion of miPEP in adipocytes protects against obesity and insulin resistance by boosting muscle metabolism

Affiliations

Deletion of miPEP in adipocytes protects against obesity and insulin resistance by boosting muscle metabolism

Alexis Diaz-Vegas et al. Mol Metab. 2024 Aug.

Abstract

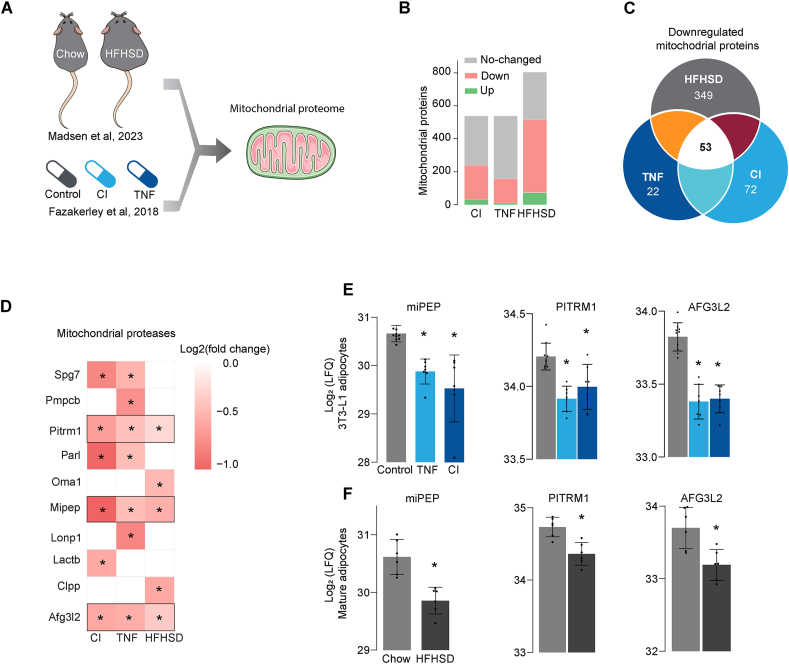
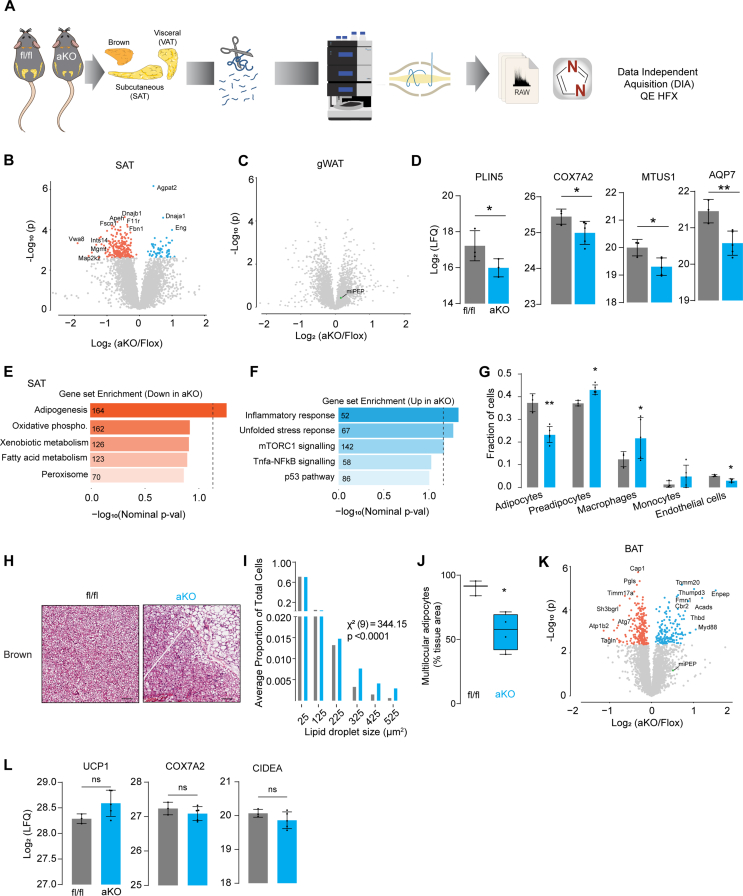
Mitochondria facilitate thousands of biochemical reactions, covering a broad spectrum of anabolic and catabolic processes. Here we demonstrate that the adipocyte mitochondrial proteome is markedly altered across multiple models of insulin resistance and reveal a consistent decrease in the level of the mitochondrial processing peptidase miPEP.

Objective: To determine the role of miPEP in insulin resistance.

Methods: To experimentally test this observation, we generated adipocyte-specific miPEP knockout mice to interrogate its role in the aetiology of insulin resistance.

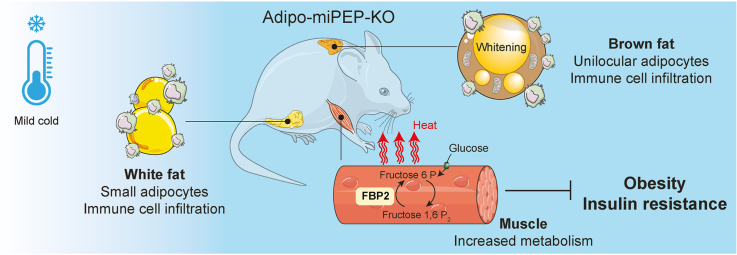
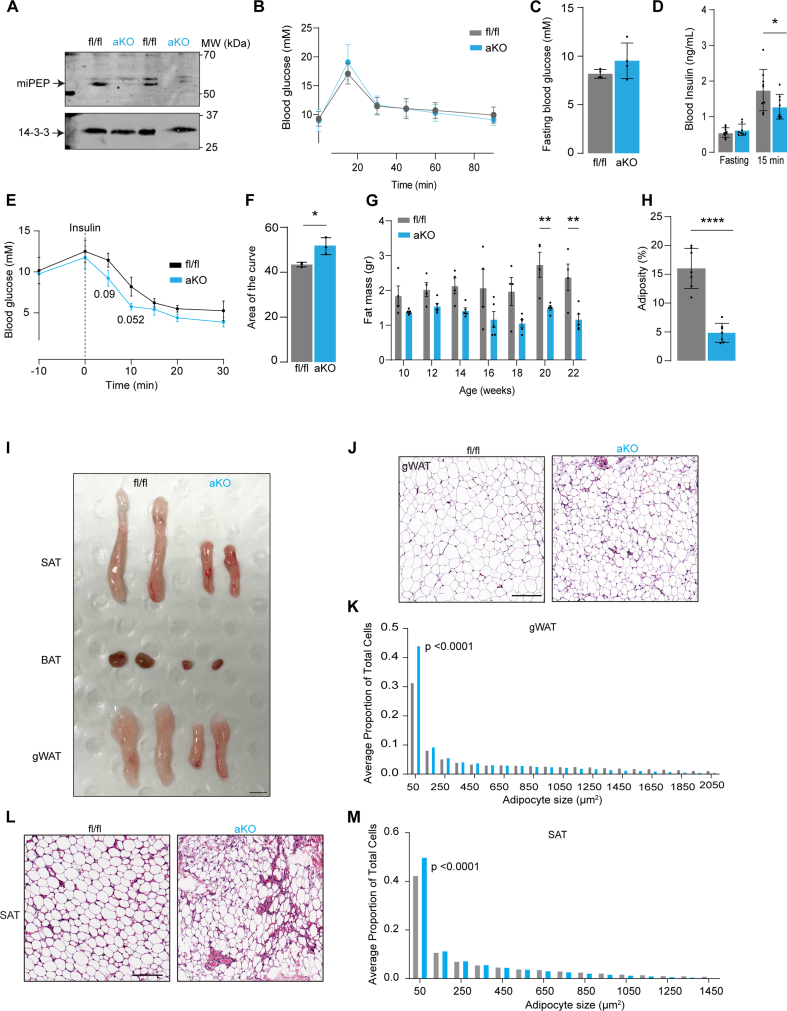
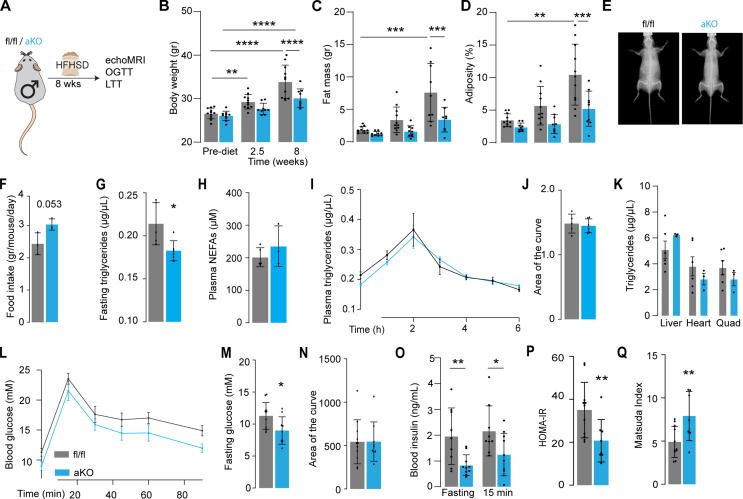
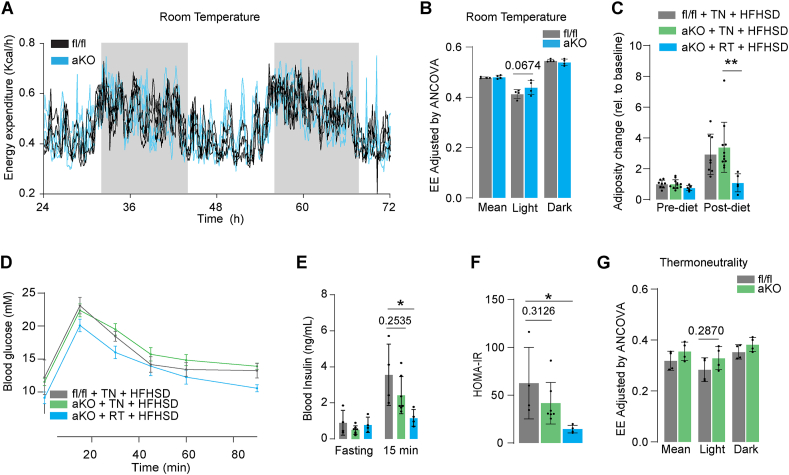
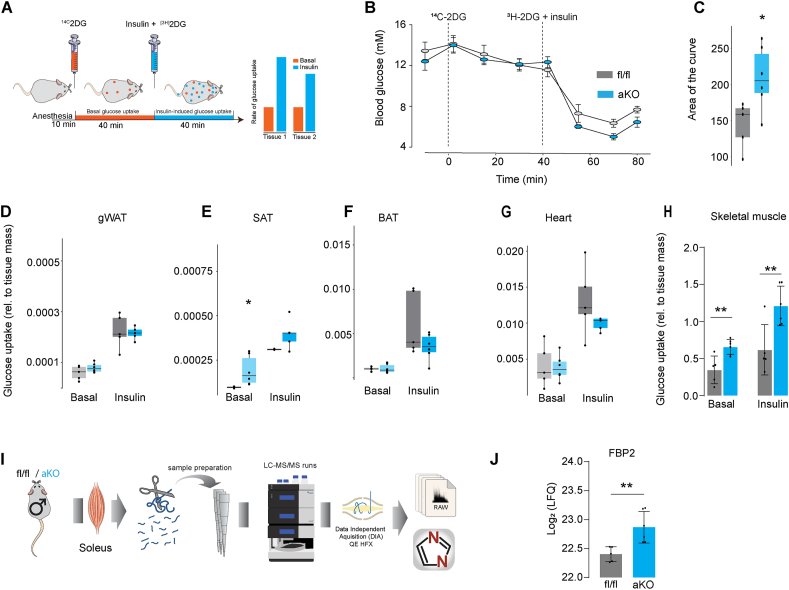
Results: We observed a strong phenotype characterised by enhanced insulin sensitivity and reduced adiposity, despite normal food intake and physical activity. Strikingly, these phenotypes vanished when mice were housed at thermoneutrality, suggesting that metabolic protection conferred by miPEP deletion hinges upon a thermoregulatory process. Tissue specific analysis of miPEP deficient mice revealed an increment in muscle metabolism, and upregulation of the protein FBP2 that is involved in ATP hydrolysis in the gluconeogenic pathway.

Conclusion: These findings suggest that miPEP deletion initiates a compensatory increase in skeletal muscle metabolism acting as a protective mechanism against diet-induced obesity and insulin resistance.

Keywords: Adipose tissue; Insulin resistance; Metabolism; Mitochondria; Peptidases; Skeletal muscle.


Conflict of interest statement

Declaration of competing interest The authors declare that there are no competing financial interests that could have influenced the work reported in this paper.

Figures

Image 1
Graphical abstract
Figure 1
Figure 1
The mitochondrial protease miPEP is downregulated in insulin resistant adipocytes (A) Schematic of the analysis of two public available datasets [11,14]. (B) Overview of the mitochondrial proteome differentially regulated across insulin resistant models (Padj < 0.05). (C) Venn Diagram showing overlap between down regulated mitochondrial proteins across insulin resistant models. (D) Heatmap of canonical mitochondrial proteases proteins differentially regulated in at least one model of insulin resistanc (Padj < 0.05 and FC > −1.25). (E) Levels of mitochondrial proteases downregulated in insulin resistant 3T3-L1 adipocytes (F) and adipocytes isolated from mice exposed to high fat high sugar diet (HFHSD) or chow control N = 6–9 for 3T3-L1 adipocytes and 4–6 for mature adipocytes. Mean ± S.D. ∗p < 0.05 versus control. CI: Chronic insulin, TNF: Tumour Necrosis Factor ∝.
Figure 2
Figure 2
Adipocyte specific miPEP deletion reduces adiposity and increases insulin sensitivity (A) Western blotting against miPEP in control (miPEPfl/fl) or adipocyte specific KO mice (aKO) obtained from isolated adipocytes. (B) Oral Glucose tolerance test (C) Fasting blood glucose (D) Blood insulin (fasting and at 15 min during Oral Glucose tolerance test). Mean ± S.D., N = 7, ∗p < 0.05 vs miPEPfl/fl mice. (E) Intraperitoneal insulin tolerance test (F) Area of the curve during insulin tolerance test. Mean ± S.D., N = 3, ∗p < 0.05 vs miPEPfl/fl mice. (G) Temporal changes in fat mass (H) Adiposity at 22 wks old. N = 4–6, mean ± S.D. ∗∗p < 0.01, ∗∗∗∗p < 0.0001 vs miPEPfl/fl. (I) Representative image of adipose depots in miPEPfl/fl and aKO mice. gWAT: Gonadal white adipose tissue, SAT: Subcutaneous white adipose tissue, BAT: Brown adipose tissue. Scale bar 1 cm. Haematoxylin and eosin staining of gWAT (J) and SAT (L) of miPEPfl/fl and aKO mice. Scale bar 100 μm. Quantification of the adipocyte size distribution for gWAT (K) and SAT (M) from the H&E staining, N = 5, p-value reported.
Figure 3
Figure 3
miPEP deficient mice are protected against diet induced obesity and glucose intolerance. (A) Experimental workflow HFHSD = High fat, high sugar diet. OGTT = Oral glucose tolerance test, LTT = Lipid Tolerance Test. Changes in (B) body weight, (C) fat mass and (D) adiposity pre-diet, at 2.5 wks and 8 wks of diet is shown. Mean ± S.D., N = 9–11, ∗∗p < 0.01, ∗∗∗p < 0.001, ∗∗∗∗p < 0.0001. (E) Representative dual energy X-ray absorptiometry (DEXA) image scan for control (miPEPfl/fl, fl/fl) and adipo-miPEP-KO (aKO) after 8 wks of diet intervention. (F) Food intake Mean ± S.D., p-value is reported. (G) Fasting triglycerides and (H) plasma NEFAs. Mean ± S.D., N = 5–6. ∗p < 0.05 vs miPEPfl/fl mice. (I) Kinetic and (J) area of the curve of lipid tolerance test using oral gavage of intralipids. Mean ± S.D., N = 5–6 (K) Triglycerides levels across tissues in miPEPfl/fl (fl/fl, grey) and adipo-miPEP-KO (aKO, light blue) mice. Mean ± S.D., N = 3–6. (L) Oral Glucose tolerance test, (M) Fasting glucose was determined after 8 wks of HFHSD. (N) Area of the curve was determined from the Oral Glucose tolerance test. (O) Fasting Blood insulin and at 15 min during the Oral Glucose tolerance test. (P) HOMA-IR (Q) Matsuda Index. Mean ± S.D., N = 8–10, ∗p < 0.05, ∗∗p < 0.01 vs miPEPfl/fl mice.
Figure 4
Figure 4
Thermoneutrality reverses the protective phenotype observed in miPEP deficient mice. (A) Raw energy expenditure (Kcal/h) for adipo-miPEP-KO (aKO, light blue) and miPEPfl/fl (black) mice housed at room temperature over 48 h period (B) Quantification of energy expenditure ANCOVA adjusted during light and dark circles every 24 h Mean ± S.D., N = 4. p-value reported (C) Change in adiposity in miPEPfl/fl (fl/fl, grey) and adipo-miPEP-KO mice (aKO, light green) in response to a high fat, high sugar diet (HFHSD) in thermoneutrality (TN) or room temperature (RT) relative to baseline. Mean ± S.D., N = 4–7, ∗p < 0.05, ∗∗∗p < 0.001 vs miPEPfl/fl mice. (D) Oral Glucose tolerance test, (E) Blood insulin in fasting and at 15 min during the oral glucose tolerance test and (F) HOMA-IR after 4 wks of HFHSD in thermoneutrality (TN) or age-matched mice housed at room temperature (RT). Mean ± S.D., N = 4–7. ∗p < 0.05. Mean ± S.D., N = 4. p-value reported. (G) Mice were housed at thermoneutrality (TN) and fed a HFHSD for 4 weeks. Following this period, their EE was measured over 48 h under TN. EE was quantified (ANCOVA adjusted). Data are presented as mean ± S.D. (N = 4). The p-value is reported.
Figure 5
Figure 5
adipo-miPEP-KO mice do not exhibit adipose tissue browning. (A) Experimental workflow for global proteomics of gonadal white adipose tissue (gWAT), subcutaneous white adipose tissue (SAT) and brown adipose tissue (BAT) in aKO mice. (B–C) Volcano plot of relative protein abundance across adipose tissues. Orange, significatively downregulated proteins. Light blue, significatively upregulated proteins (−log10(p-val) = 2.2). (D) Abundance of proteins associated with browning, N = 3–5, Mean ± S.D. ∗p < 0.05 vs miPEPfl/fl. Gene set enrichment analysis of downregulated (E) and upregulated (F) proteins in adipo-miPEP-KO mice. Number of proteins associated with each pathway is shown within each bar. (G) Cell type deconvolution using proteomic data from SAT whole tissue aKO and miPEPfl/fl (fl/fl) mice. Mean ± S.D., N = 3–5, ∗p < 0.05, ∗∗p < 0.01 vs miPEPfl/fl mice. (H) Haematoxylin and eosin staining of brown adipose tissue (BAT). Scale bar 50 μm. (I) Quantification of the adipocyte size distribution for BAT (N = 5). (J) Percentage of cells with multilocular lipids droplets relative to the whole tissue area. N = 4, Median ± S.D. ∗p < 0.05 vs miPEPfl/fl. (K) Volcano plot of relative protein abundance in BAT. Orange, significatively downregulated proteins. Light blue, significatively upregulated proteins. (L) Abundance of proteins associated with BAT activity, N = 3–5, Mean ± S.D. ∗p < 0.05 vs miPEPfl/fl.
Figure 6
Figure 6
Deletion of miPEP increases muscle metabolism. (A) Experimental summary of the Dual Tracer Test (DTT) workflow and hypothetical data. (B) Blood glucose levels during the DTT. (C) Area of the curve after insulin administration in control (miPEPfl/fl, fl/fl) and adipocyte specific miPEP KO (aKO, light blue) mice. (D–H) Accumulation of basal [14C]2DG-6P and insulin-stimulated [3H]2DG-6P in Gonadal white adipose tissue (gWAT) (D), Subcutaneous adipose tissue (SAT) (E), Brown adipose tissue (BAT) (F), Heart (G), and skeletal muscle (H) was determined across genotypes. N = 5–6, ∗p < 0.05, ∗∗p < 0.01 vs miPEPfl/fl mice. (I) Experimental workflow for global proteomics of soleus muscle in miPEPfl/fl and aKO mice. (J) Abundance of Fbp2 in soleus, N = 5–6 Mean ± S.D. ∗∗p < 0.05 vs miPEPfl/fl.

Similar articles

Cited by

References

    1. Gray M.W., Burger G., Lang B.F. Mitochondrial evolution. Science. 1999;283(5407):1476–1481. - PubMed
    1. Picard M., Shirihai O.S. Mitochondrial signal transduction. Cell Metab. 2022;34(11):1620–1653. - PMC - PubMed
    1. Morgenstern M., Peikert C.D., Lübbert P., Suppanz I., Klemm C., Alka O., et al. Quantitative high-confidence human mitochondrial proteome and its dynamics in cellular context. Cell Metabol. 2021;33(12):2464–2483.e18. - PMC - PubMed
    1. Chella Krishnan K., El Hachem E.-J., Keller M.P., Patel S.G., Carroll L., Vegas A.D., et al. Genetic architecture of heart mitochondrial proteome influencing cardiac hypertrophy. eLife. 2023;12 doi: 10.7554/eLife.82619. - DOI - PMC - PubMed
    1. Diaz-Vegas A., Sanchez-Aguilera P., Krycer J.R., Morales P.E., Monsalves-Alvarez M., Cifuentes M., et al. Is mitochondrial dysfunction a common root of noncommunicable chronic diseases? Endocr Rev. 2020;41(3) doi: 10.1210/endrev/bnaa005. - DOI - PMC - PubMed