

Noninvasive Diagnostic Method to Objectively Measure Olfaction and Diagnose Smell Disorders by a Molecularly Targeted Fluorescence Imaging Agent
- PMID: 38960711
- PMCID: PMC11294062
- DOI: 10.2967/jnumed.123.266123
Noninvasive Diagnostic Method to Objectively Measure Olfaction and Diagnose Smell Disorders by a Molecularly Targeted Fluorescence Imaging Agent
Abstract
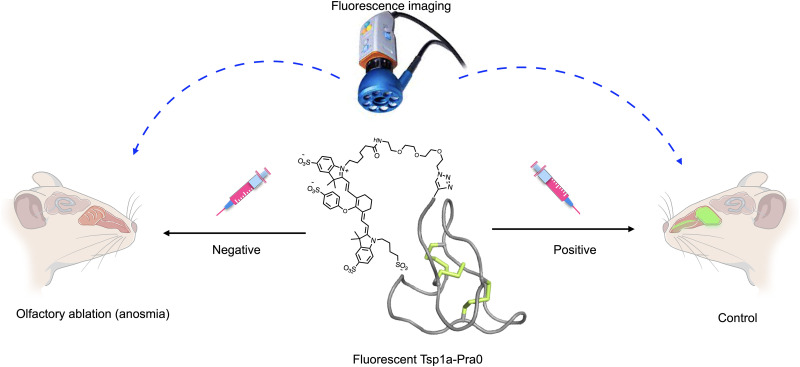
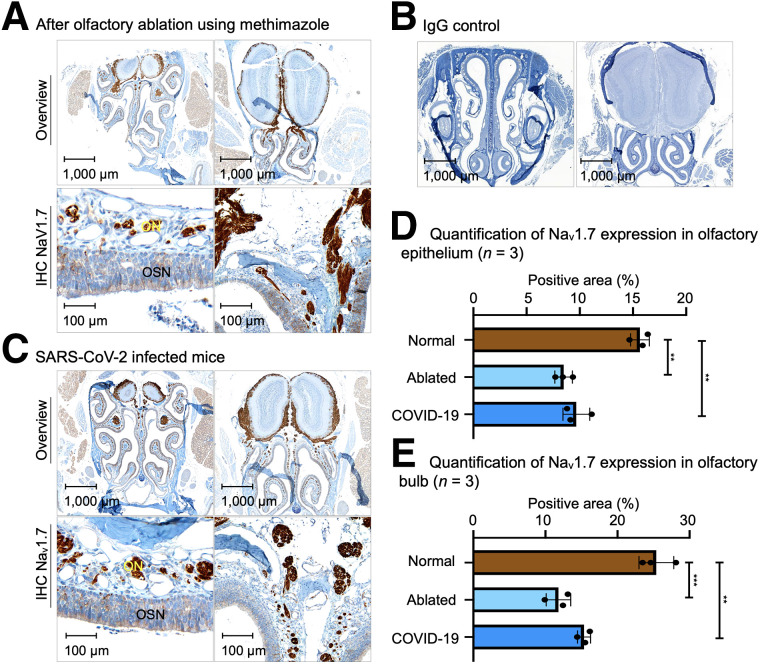
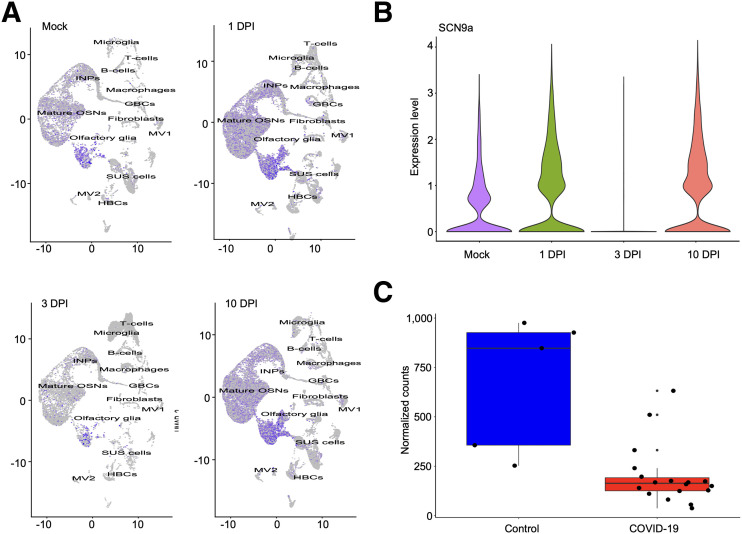
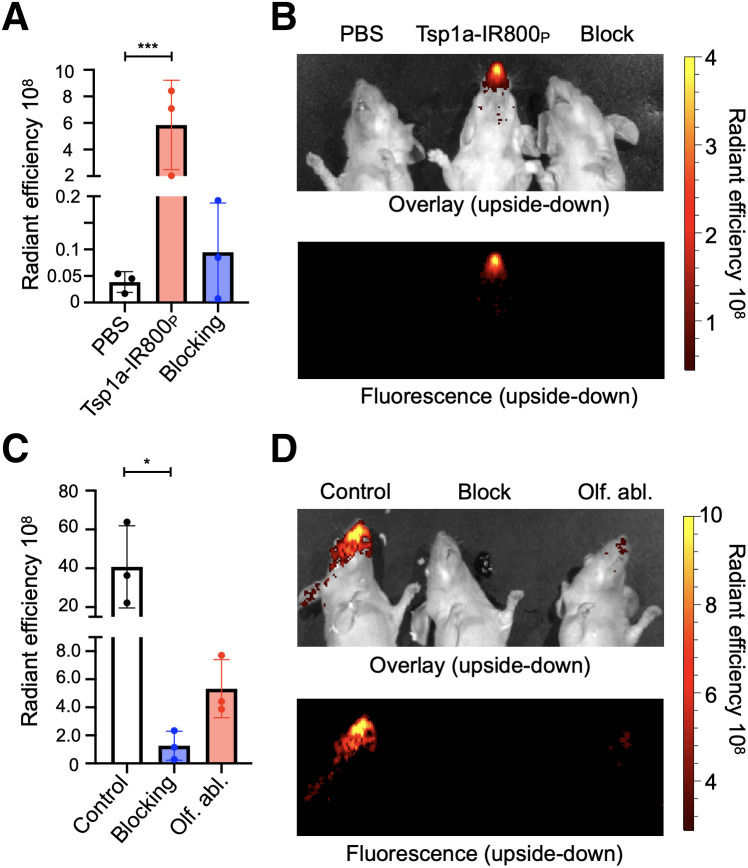
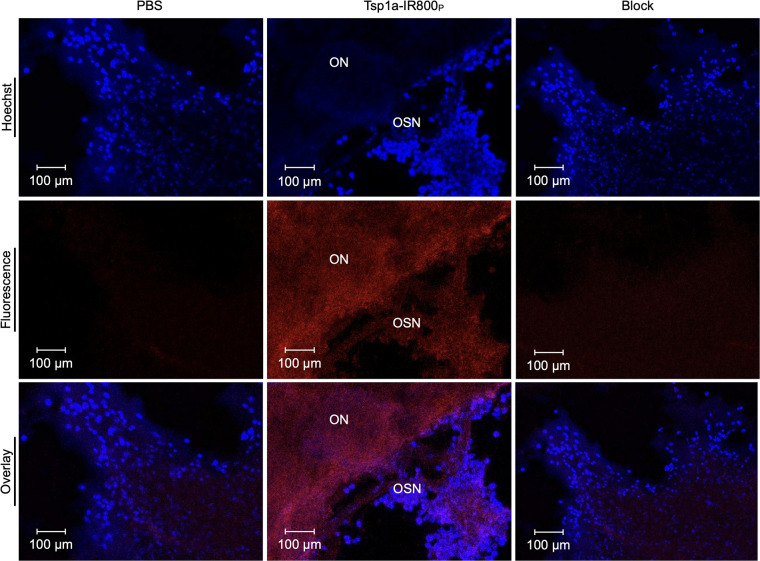
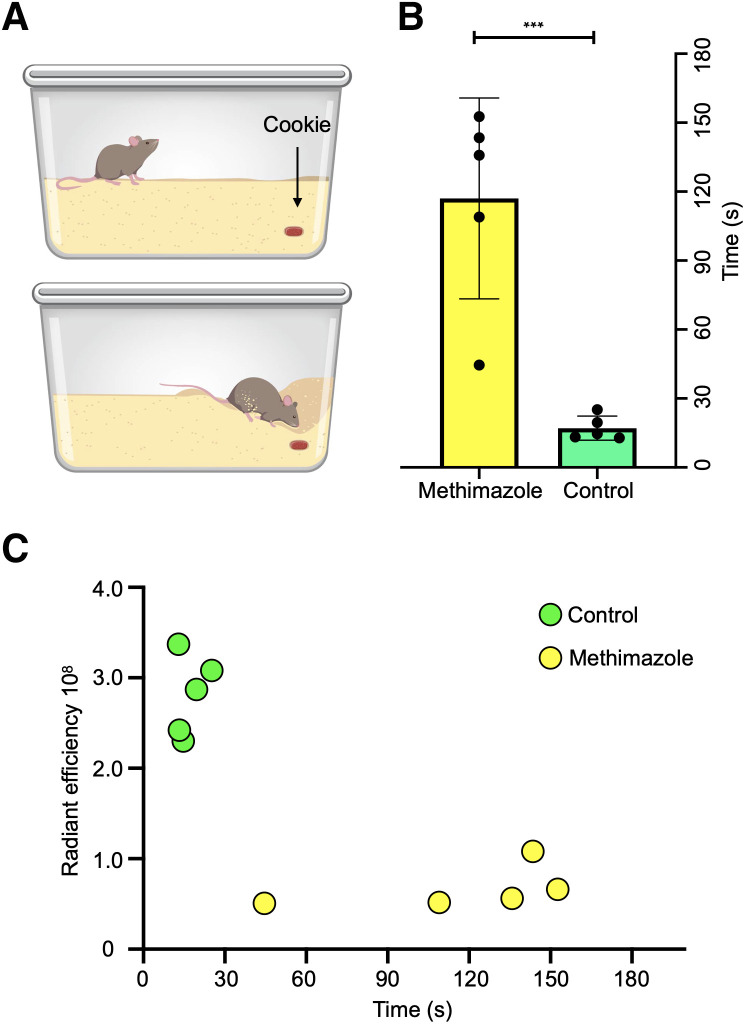
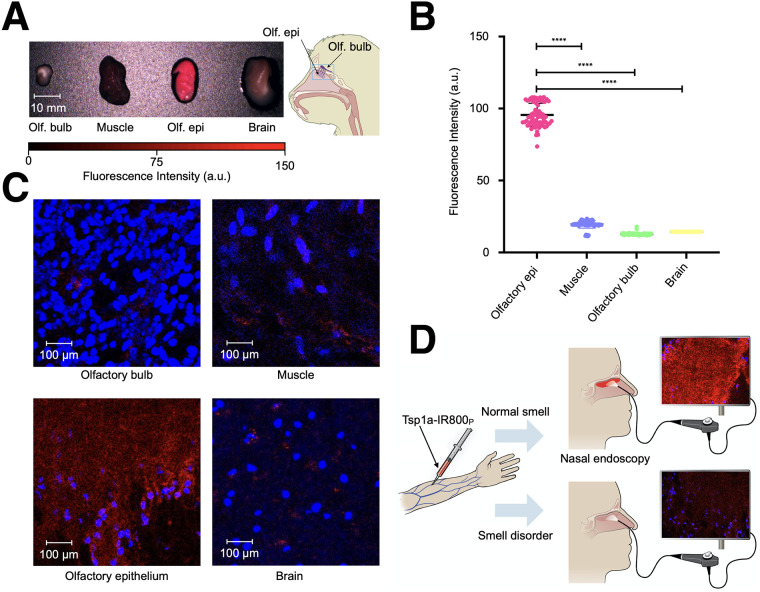
Despite the recent advances in understanding the mechanisms of olfaction, no tools are currently available to noninvasively identify loss of smell. Because of the substantial increase in patients presenting with coronavirus disease 2019-related loss of smell, the pandemic has highlighted the urgent need to develop quantitative methods. Methods: Our group investigated the use of a novel fluorescent probe named Tsp1a-IR800P as a tool to diagnose loss of smell. Tsp1a-IR800P targets sodium channel 1.7, which plays a critical role in olfaction by aiding the signal propagation to the olfactory bulb. Results: Intuitively, we have identified that conditions leading to loss of smell, including chronic inflammation and coronavirus disease 2019, correlate with the downregulation of sodium channel 1.7 expression in the olfactory epithelium, both at the transcript and at the protein levels. We demonstrated that lower Tsp1a-IR800P fluorescence emissions significantly correlate with loss of smell in live animals-thus representing a potential tool for its semiquantitative assessment. Currently available methods rely on delayed subjective behavioral studies. Conclusion: This method could aid in significantly improving preclinical and clinical studies by providing a way to objectively diagnose loss of smell and therefore aid the development of therapeutic interventions.
Keywords: COVID-19; anosmia; fluorescence imaging; olfaction; optical; smell.
© 2024 by the Society of Nuclear Medicine and Molecular Imaging.
Figures

Update of
-
Non-invasive diagnostic method to objectively measure olfaction and diagnose smell disorders by molecularly targeted fluorescent imaging agent.bioRxiv [Preprint]. 2022 Nov 29:2021.10.07.463532. doi: 10.1101/2021.10.07.463532. bioRxiv. 2022. Update in: J Nucl Med. 2024 Aug 1;65(8):1293-1300. doi: 10.2967/jnumed.123.266123. PMID: 36482968 Free PMC article. Updated. Preprint.
Similar articles
-
Signs and symptoms to determine if a patient presenting in primary care or hospital outpatient settings has COVID-19.Cochrane Database Syst Rev. 2022 May 20;5(5):CD013665. doi: 10.1002/14651858.CD013665.pub3. Cochrane Database Syst Rev. 2022. PMID: 35593186 Free PMC article.
-
Interventions for the prevention of persistent post-COVID-19 olfactory dysfunction.Cochrane Database Syst Rev. 2022 Sep 5;9(9):CD013877. doi: 10.1002/14651858.CD013877.pub3. Cochrane Database Syst Rev. 2022. PMID: 36063364 Free PMC article.
-
Non-invasive diagnostic method to objectively measure olfaction and diagnose smell disorders by molecularly targeted fluorescent imaging agent.bioRxiv [Preprint]. 2022 Nov 29:2021.10.07.463532. doi: 10.1101/2021.10.07.463532. bioRxiv. 2022. Update in: J Nucl Med. 2024 Aug 1;65(8):1293-1300. doi: 10.2967/jnumed.123.266123. PMID: 36482968 Free PMC article. Updated. Preprint.
-
Risk of thromboembolism in patients with COVID-19 who are using hormonal contraception.Cochrane Database Syst Rev. 2023 Jan 9;1(1):CD014908. doi: 10.1002/14651858.CD014908.pub2. Cochrane Database Syst Rev. 2023. Update in: Cochrane Database Syst Rev. 2023 May 15;5:CD014908. doi: 10.1002/14651858.CD014908.pub3. PMID: 36622724 Free PMC article. Updated.
-
Behavioral interventions to reduce risk for sexual transmission of HIV among men who have sex with men.Cochrane Database Syst Rev. 2008 Jul 16;(3):CD001230. doi: 10.1002/14651858.CD001230.pub2. Cochrane Database Syst Rev. 2008. PMID: 18646068
Cited by
-
Shining a Light on Venom-Peptide Receptors: Venom Peptides as Targeted Agents for In Vivo Molecular Imaging.Toxins (Basel). 2024 Jul 4;16(7):307. doi: 10.3390/toxins16070307. Toxins (Basel). 2024. PMID: 39057947 Free PMC article. Review.
-
Proteoform Analysis of the Human Olfactory System: A Window into Neurodegenerative Diseases.Proteomes. 2024 Mar 21;12(1):9. doi: 10.3390/proteomes12010009. Proteomes. 2024. PMID: 38535507 Free PMC article. Review.
-
Imaging advances to detect non-motor prodromal markers of Parkinson's disease and explore therapeutic translation opportunities.NPJ Parkinsons Dis. 2025 Jun 18;11(1):174. doi: 10.1038/s41531-025-01004-0. NPJ Parkinsons Dis. 2025. PMID: 40533452 Free PMC article. Review.
References
MeSH terms
Substances
Grants and funding
LinkOut - more resources
Full Text Sources
Medical