. 2024 Jul 3;15(1):5600.
doi: 10.1038/s41467-024-48188-2.

ezSingleCell: an integrated one-stop single-cell and spatial omics analysis platform for bench scientists

Affiliations

ezSingleCell: an integrated one-stop single-cell and spatial omics analysis platform for bench scientists

Raman Sethi et al. Nat Commun. .

Abstract

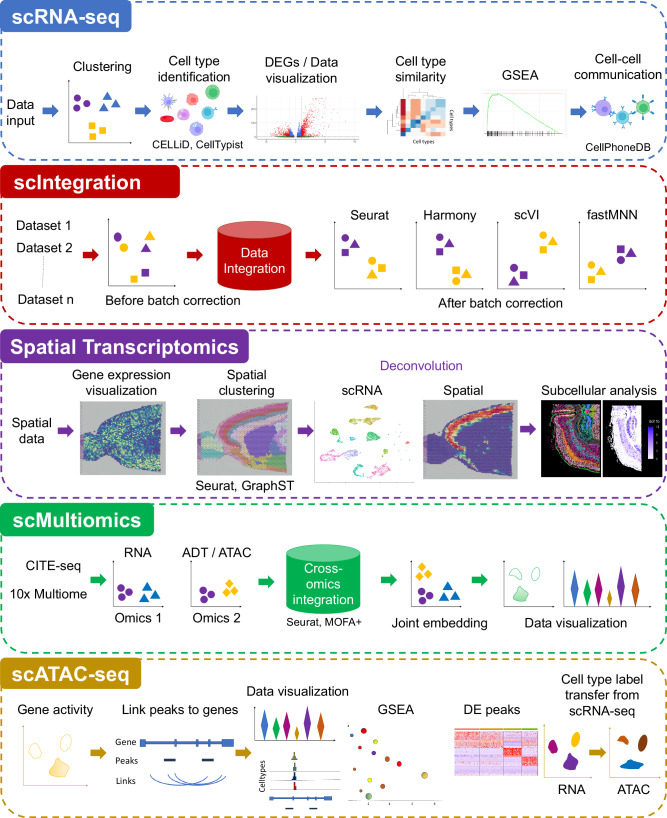
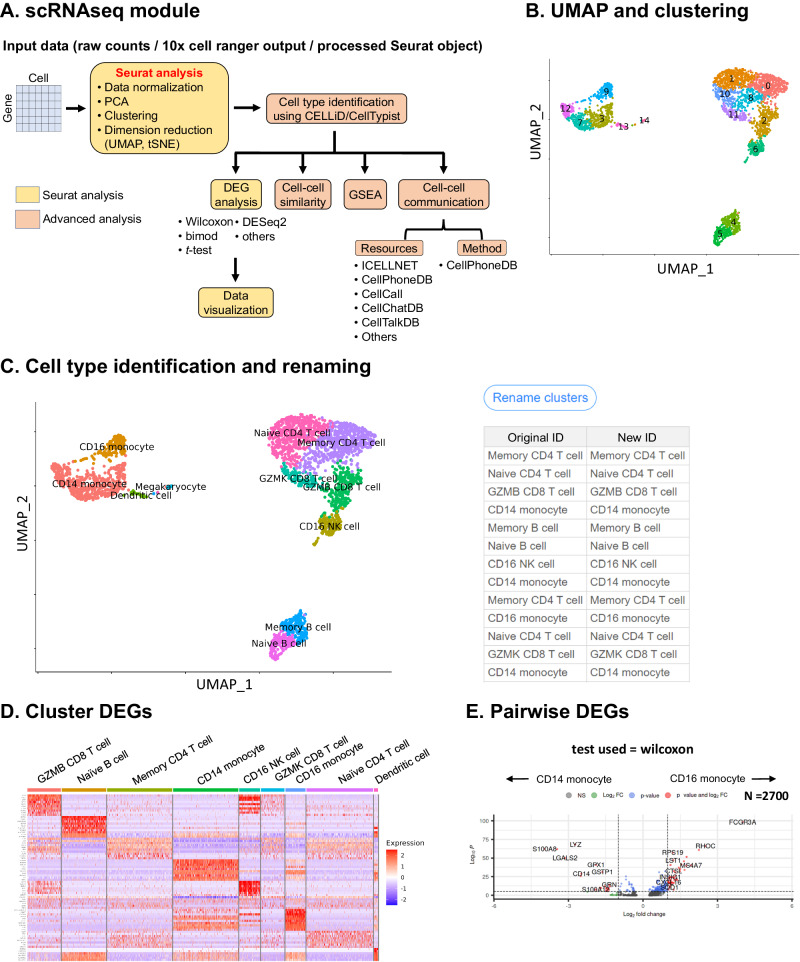
ezSingleCell is an interactive and easy-to-use application for analysing various single-cell and spatial omics data types without requiring prior programing knowledge. It combines the best-performing publicly available methods for in-depth data analysis, integration, and interactive data visualization. ezSingleCell consists of five modules, each designed to be a comprehensive workflow for one data type or task. In addition, ezSingleCell allows crosstalk between different modules within a unified interface. Acceptable input data can be in a variety of formats while the output consists of publication ready figures and tables. In-depth manuals and video tutorials are available to guide users on the analysis workflows and parameter adjustments to suit their study aims. ezSingleCell's streamlined interface can analyse a standard scRNA-seq dataset of 3000 cells in less than five minutes. ezSingleCell is available in two forms: an installation-free web application ( https://immunesinglecell.org/ezsc/ ) or a software package with a shinyApp interface ( https://github.com/JinmiaoChenLab/ezSingleCell2 ) for offline analysis.


Conflict of interest statement

The authors declare no competing interests.

Figures

Fig. 1
Fig. 1. Overview of the ezSingleCell webserver.
ezSingleCell comprises five modules, single-cell RNA-seq (scRNA-seq), single-cell data integration (scIntegration), Spatial Transcriptomics, single-cell Multiomics (scMultiomics), and single-cell ATAC-seq (scATAC-seq). The figure also shows the major tasks that each module can perform along with the tools available in each module. Source data is provided as a Source Data file.
Fig. 2
Fig. 2. ezSingleCell scRNA-seq module.
A Workflow of scRNA-seq analysis; (B) scRNA-seq UMAP and clustering visualization in ezSingleCell; (C) cell type identification using CELLiD and CellTypist. Users can also rename clusters in ezSingleCell; (D) Cluster-wise Differentially Expressed Gene (DEG) analysis using the ‘wilcoxon’ test; (E) Pairwise DEG analysis between two cell types of interest using the ‘wilcoxon’ test. Source data is provided as a Source Data file.
Fig. 3
Fig. 3. Advanced analyses in ezSingleCell scRNA-seq module.
A Cell type similarity analysis; (B) Gene Set Enrichment Analysis (GSEA) using the weighted Kolmogorov–Smirnov statistic; (C) Cell-cell communication analysis using CellphoneDB. Source data is provided as a Source Data file.
Fig. 4
Fig. 4. ezSingleCell scIntegration module.
Major functionalities of this module include quality control, normalization, UMAP visualization before batch effect correction and after batch correction  with Seurat, Harmony, or scVI, and iLISI scoring for integration assessment. A higher iLISI score indicates better batch mixing and performance. Source data is provided as a Source Data file.
Fig. 5
Fig. 5. ezSingleCell spatial transcriptomics module.
A Data input and pre-processing; (B) spatial clustering using Seurat and GraphST along with comparison with manual cell type annotation from pathologists; (C) cell type deconvolution using Seurat and GraphST showing the proportion of cell types deconvoluted with scRNA-seq reference data; (D) subcellular data (Xenium) analysis showing the clustering of molecules, visualization of expression profiles of molecules, and a zoomed in view of cell segmentation boundaries and individual molecules. Source data is provided as a Source Data file.
Fig. 6
Fig. 6. ezSingleCell scMultiomics module.
The workflow includes data quality control, pre-processing, clustering, dimension reduction, cross-omics integration, post-integration analysis, and visualization. Currently, Seurat Weighted Nearest Neighbors (WNN) and MOFA+ are provided for cross-omics integration. After integration, cell types can be identified with the RNA modality and the joint clustering of Seurat WNN or MOFA + .Users can visualize specific genes and proteins in the joint UMAP. Here, we visualized the expression levels of B cell marker gene MS4A1 and CD4 T cell protein marker CD4 in the joint UMAP visualizations from Seurat WNN and MOFA+ . Source data is provided as a Source Data file.
Fig. 7
Fig. 7. ezSingleCell scATAC-seq module.
A Workflow of scATAC-seq analysis; (B) transcriptional start site (TSS) enrichment; (C) data clustering and dimension reduction; (D) data visualization; (E) coverage plot; (F) link peaks to genes; (G) differentially expressed peak (DE peak) analysis between clusters; (H) integration of scRNA-seq and scATAC-seq data for cell type identification. Here, we loaded a processed human PBMCs scRNA-seq dataset and identified 12 cell types in the scATAC-seq dataset through cell type label transfer; (I) gene set enrichment analysis (GSEA) of scATAC-seq data using the rGREAT and fgsea packages. We used the weighted Kolmogorov–Smirnov statistic for GSEA analysis. Source data is provided as a Source Data file.
Fig. 8
Fig. 8. ezSingleCell cross-module interaction capabilities.
Users can process single-cell RNA-seq data and use individual sets or batch integrated data to deconvolute cell types in spatial omics data or perform label transfer to accomplish cell type annotation of scATAC-seq data. Source data is provided as a Source Data file.

References

    1. Chen G, Ning B, Shi T. Single-cell RNA-seq technologies and related computational data analysis. Front. Genet. 2019;10:317. doi: 10.3389/fgene.2019.00317. - DOI - PMC - PubMed
    1. Haque A, Engel J, Teichmann SA, Lönnberg T. A practical guide to single-cell RNA-sequencing for biomedical research and clinical applications. Genome Med. 2017;9:75. doi: 10.1186/s13073-017-0467-4. - DOI - PMC - PubMed
    1. Stoeckius M, et al. Simultaneous epitope and transcriptome measurement in single cells. Nat. Methods. 2017;14:865–868. doi: 10.1038/nmeth.4380. - DOI - PMC - PubMed
    1. Marx V. Method of the Year: Spatially resolved transcriptomics. Nat. Methods. 2021;18:9–14. doi: 10.1038/s41592-020-01033-y. - DOI - PubMed
    1. Moses L, Pachter L. Museum of spatial transcriptomics. Nat. Methods. 2022;19:534–546. doi: 10.1038/s41592-022-01409-2. - DOI - PubMed

LinkOut - more resources