. 2024 Jul 3;15(1):5589.
doi: 10.1038/s41467-024-49443-2.

Three SARS-CoV-2 spike protein variants delivered intranasally by measles and mumps vaccines are broadly protective

Affiliations

Three SARS-CoV-2 spike protein variants delivered intranasally by measles and mumps vaccines are broadly protective

Yuexiu Zhang et al. Nat Commun. .

Abstract

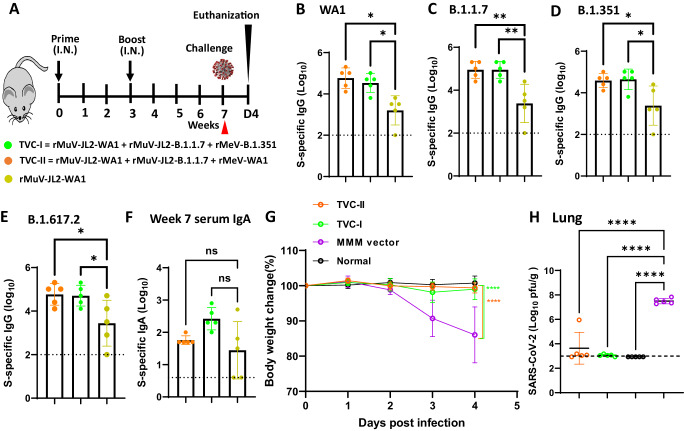
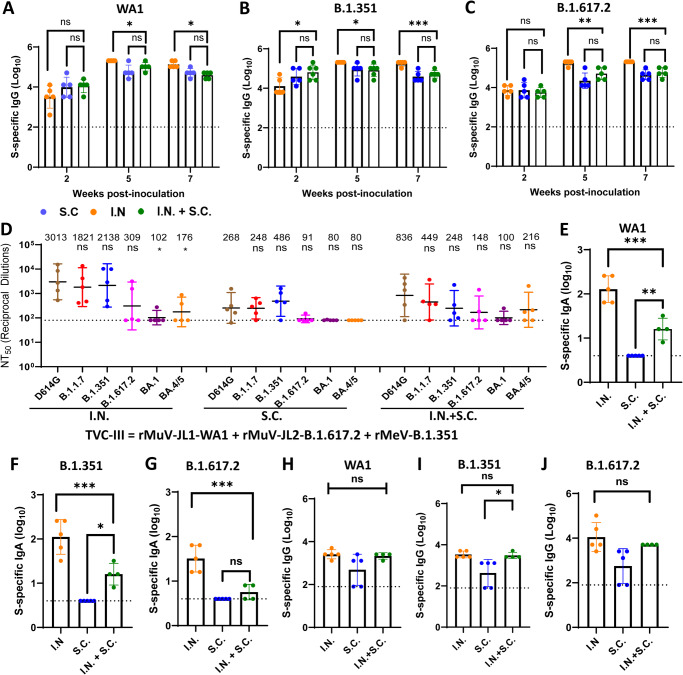
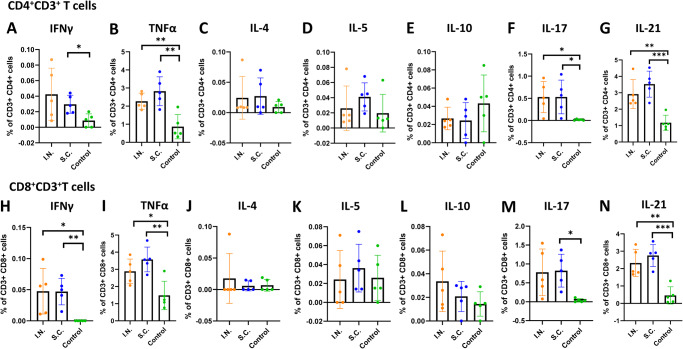
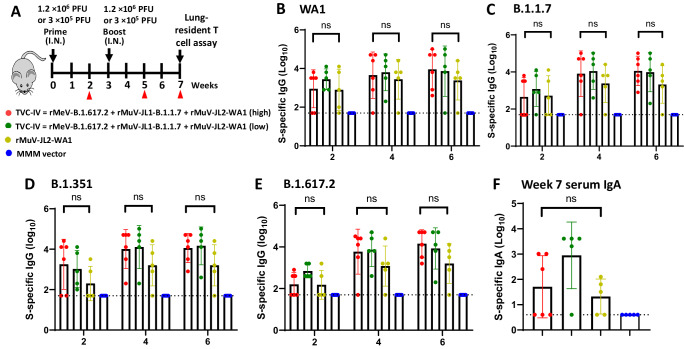
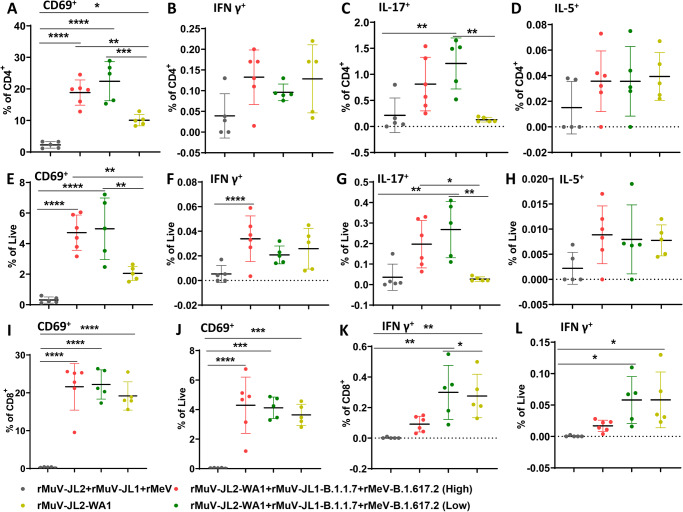
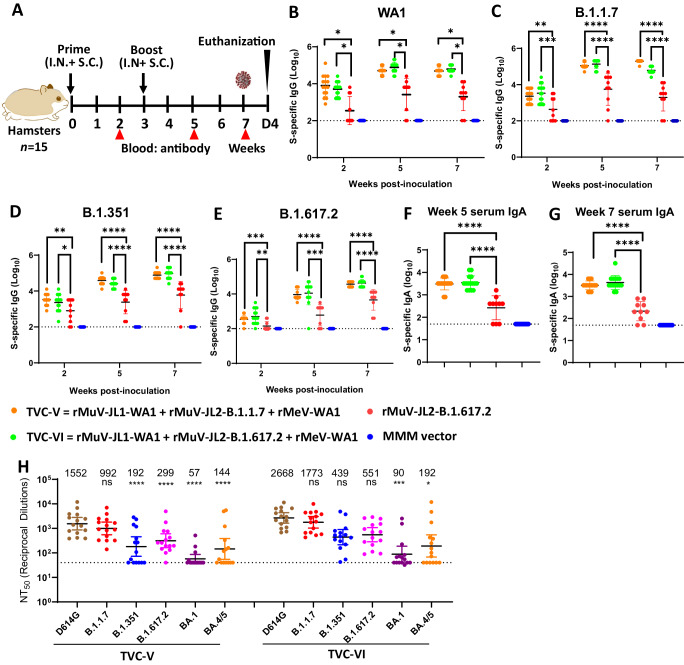
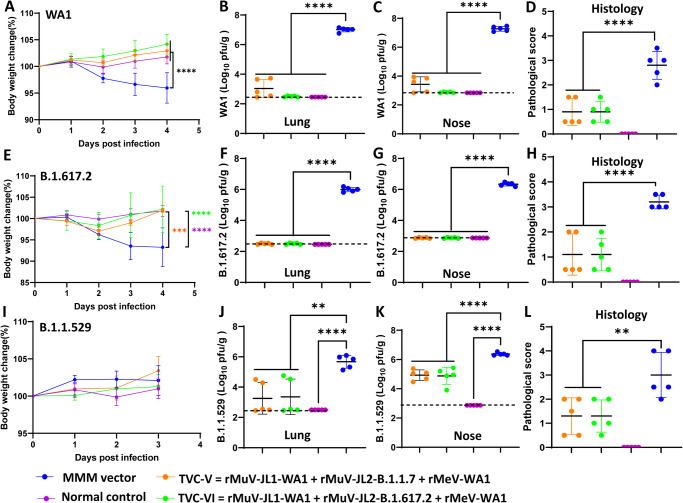
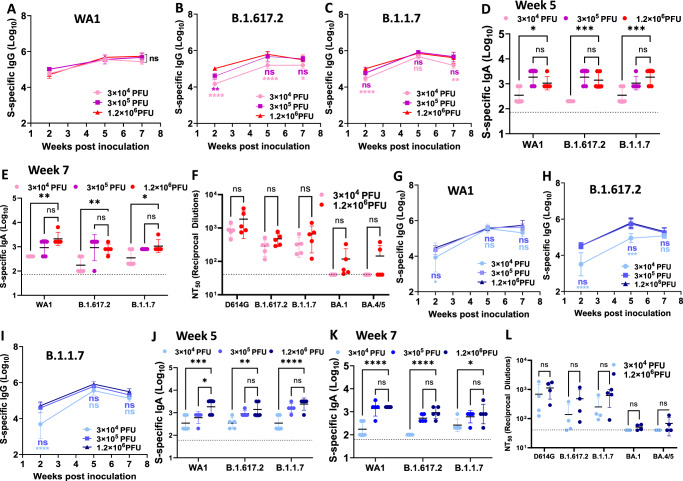
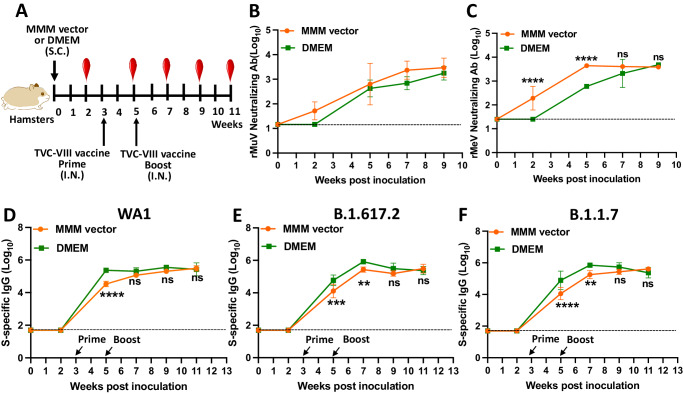
As the new SARS-CoV-2 Omicron variants and subvariants emerge, there is an urgency to develop intranasal, broadly protective vaccines. Here, we developed highly efficacious, intranasal trivalent SARS-CoV-2 vaccine candidates (TVC) based on three components of the MMR vaccine: measles virus (MeV), mumps virus (MuV) Jeryl Lynn (JL1) strain, and MuV JL2 strain. Specifically, MeV, MuV-JL1, and MuV-JL2 vaccine strains, each expressing prefusion spike (preS-6P) from a different variant of concern (VoC), were combined to generate TVCs. Intranasal immunization of IFNAR1-/- mice and female hamsters with TVCs generated high levels of S-specific serum IgG antibodies, broad neutralizing antibodies, and mucosal IgA antibodies as well as tissue-resident memory T cells in the lungs. The immunized female hamsters were protected from challenge with SARS-CoV-2 original WA1, B.1.617.2, and B.1.1.529 strains. The preexisting MeV and MuV immunity does not significantly interfere with the efficacy of TVC. Thus, the trivalent platform is a promising next-generation SARS-CoV-2 vaccine candidate.


Conflict of interest statement

The Ohio State University has filed an invention report on this approach to the development of intranasal trivalent SARS-CoV-2 vaccines. J.L., Y.Z., J.X., M.C. and X.L. are the inventors. Other authors do not have competing interests.

Figures

Fig. 1
Fig. 1. Immunogenicity of trivalent vaccine candidates (TVC-I and TVC-II) in IFNAR1−/− mice.
A Schematic diagram of mice immunization, sample collection, and challenge. IFNAR1−/− mice (n = 5 per group) were immunized intranasally with 1.2 × 106 PFU of TVC-I (a mixture of rMuV-JL2-WA1, rMuV JL2-B.1.1.7, and rMeV-B.1.351, 4 × 105 PFU per virus), TVC-II (a mixture of rMuV-JL2-WA1, rMuV-JL2-B.1.1.7, and rMeV-WA1, 4 × 105 PFU per virus), rMuV-JL2-WA1, or MMM vector control, and were boosted 3 weeks later. At week 7, sera were collected for detection of S-specific IgG titer using the preS-6P protein of SARS-CoV-2 WA1 (B), B.1.1.7 (C), B.1.351 (D), or B.1.617.2 (E) as ELISA coating antigen. (F) Serum IgA titer at week 7. The ELISA was conducted using the preS-6P protein of SARS-CoV-2 WA1 as the coating antigen. IgG and IgA titers are the geometric mean titer (GMT) of 5 mice ± standard deviation (SD). The P-value of TVC-I and TVC-II vs rMuV-JL2-WA1 in (B) is *P = 0.0327 and *P = 0.0116, C is *P = 0.0017 and *P = 0.0017, D is *P = 0.0219 and *P = 0.0292, and E is *P = 0.0472 and *P = 0.0361. G Changes in body weight of mice. At week 7, mice were challenged with SARS-CoV-2 MA10, and body weight was measured daily until day 4. Normal refers to animals inoculated with DMEM. Percent of initial body weight is shown. Data are the average of 5 mice (n = 5) ± SD. The P-value of TVC-I and TVC-II vs MMM vector is ****P = 2.893 × 10−7 and ****P = 2.03 × 10−8, respectively. H Viral burden in the lung. At day 4 post-challenge, SARS-CoV-2 MA10 titer in the lungs was measured by plaque assay. Data shown are the GMT of 5 mice (n = 5) ± SD. The P-value of TVC-I, TVC-II, and normal control vs MMM vector is ****P = 6.36 × 10−8, ****P = 4.414 × 10−7, and ****P = 4.35 × 10−8, respectively. The dotted line indicates the limit of detection (LoD) which is 2.7 Log10 PFU per gram of tissue. Statistical analyses in (BF) and (H) were conducted using one-way ANOVA. Statistical analyses in (G) were conducted using two-way ANOVA. (*P <0.05; **P < 0.01; ***P < 0.001; ****P < 0.0001; ns, not significant). Source data are provided in the Source Data file.
Fig. 2
Fig. 2. Intranasal immunization of trivalent vaccine (TVC-III) is superior to subcutaneous or a combination of intranasal and subcutaneous route.
IFNAR1−/− mice were immunized with 1.2×10⁶ PFU of TVC-III (rMuV-JL1-WA1 + rMuV-JL2-B.1.617.2 + rMeV-B.1.351) via I.N., S.C., or I.N. + S.C., and were boosted via the same route three weeks later. At weeks 2, 5, and 7, serum was collected for detection of S-specific IgG titer by ELISA using preS-6P protein of SARS-CoV-2 WA1 (A), B.1.351 (B), or B.1.617.2 (C) as the coating antigen. The P-value for I.N. vs I.N. + S.C. in (AC) is: A, *P = 0.013349 (week 5) and *P = 0.013349 (week 7); B, *P = 0.013349 (week 2), *P = 0.039969 (week 5), and ***P = 0.000478 (week 7); C, **P = 0.006271 (week 5) and ***P = 0.000478 (week 7). Sera at week 7 were used for detection of SARS-CoV-2 NAbs using a lentivirus pseudotyped neutralization assay against SARS-CoV-2 WA1 (D614G), B.1.1.7, B.1.351, B.1.617.2, Omicron BA.1 (B.1.1.529), or BA.4/5 spike. The 50% neutralization titer (NT50) was calculated for each serum sample (D). Data are the mean of five mice (n = 5) ± SD. The P-value for BA.1 and BA.4/5 vs WA1 (D614G) is *P = 0.0426 and *P = 0.0279, respectively. At week 7, mice were euthanized, and BAL was collected from the lungs of each mouse for detection of IgA titer by ELISA using the preS-6P protein of SARS-CoV-2 WA1 (E), B.1.351 (F), or B.1.617.2 (G), and for detection of IgG titer by ELISA using the preS-6P protein of SARS-CoV-2 WA1 (H), B.1.351 (I), or B.1.617.2 (J). All antibody titers are the GMT of 5 or 4 mice (n = 5 or 4) ± SD. The dotted line indicates the limit of detection. In E, the P-value for I.N. and S.C. vs I.N. + S.C. is ***P = 0.0002 and **P = 0.0036, respectively. In F, the P-value for I.N. and S.C. vs I.N. + S.C. is ***P = 0.0013 and *P = 0.0121, respectively. In G, the P-value for I.N. vs I.N. + S.C. is ***P = 0.0003. In I, the P-value for S.C. vs I.N. + S.C. is ***P = 0.0194. Statistical analyses were conducted using one-way ANOVA (*P < 0.05; **P <0.01; ***P < 0.001; ****P < 0.0001; ns not significant). Source data are provided in the Source Data file.
Fig. 3
Fig. 3. Intranasal or subcutaneous immunization of trivalent vaccine induces a systemic T cell response.
Spleens from the intranasal and subcutaneous group in Fig. 2A–C were isolated and homogenized, and spleen T cell suspensions were prepared and seeded in three wells (triplicate per mouse) in 96-well plates and stimulated with peptide pool of SARS-CoV-2 WA1 S for 5 h. The frequencies of S-specific IFN-γ+CD4+ (A), TNF-α+CD4+ (B), IL-4+CD4+ (C), IL-5+CD4+ (D), IL-10+CD4+ (E), IL-17+ CD4+ (F), IL-21+ CD4+ (G), IFN-γ+CD8+ (H), TNF-α+CD8+ (I), IL-4+CD8+ (J), IL-5+CD8+ (K), IL-10+CD8+ (L), IL-17+ CD8+ (M), and IL-21+ CD8+ (N) cells were determined by flow cytometry after intracellular staining with the corresponding anti-cytokine antibody. Data are the mean of five mice (n = 5) ± SD. In A, the P-value for S.C. vs control is *P = 0.0475. In B, the P-value for I.N. and S.C. vs control is **P = 0.0098 and **P = 0.003, respectively. In F, the P-value for I.N. and S.C. vs control is *P = 0.0339 and *P = 0.033, respectively. In G, the P-value for I.N. and S.C. vs control is **P = 0.0051 and ***P = 0.0005, respectively. In H, the P-value for I.N. and S.C. vs control is *P = 0.0178 and **P = 0.0012, respectively. In I, the P-value for I.N. and S.C. vs control is *P = 0.0232 and **P = 0.0017, respectively. In M, the P-value for S.C. vs control is *P = 0.0264. In N, the P-value for I.N. and S.C. vs control is **P = 0.0013 and ***P = 0.0002, respectively. Statistical analysis was conducted using one-way ANOVA (ns > 0.05, *P < 0.05; **P < 0.01; ***P < 0.001). Source data are provided in the Source Data file.
Fig. 4
Fig. 4. Intranasal immunization of a low and a high dose of a trivalent vaccine (TVC-IV) induces a similar level of serum IgG and IgA.
A Immunization schedule in IFNAR1−/− mice. IFNAR1−/− mice (n = 5 or 6) were immunized intranasally with a high (1.2 × 106 PFU) or a low (3 × 105 PFU) dose of TVC-IV (rMeV-B.1.617.2, rMuV-JL1-B.1.1.7, and rMuV-JL2-WA1), a high dose (1.2 × 106 PFU) of rMuV-JL2-WA1, or MMM vector, and boosted with the same dose 3 weeks later. At weeks 2, 5, and 7, serum was collected from each mouse and S-specific IgG titer was determined by ELISA using preS-6P protein of SARS-CoV-2 WA1 (B), B.1.1.7 (C), B.1.351 (D), or B.1.617.2 (E) as the coating antigen. In addition, sera at week 7 were used for the detection of serum IgA using preS-6P of SARS-CoV-2 WA1 as the coating antigen (F). IgG and IgA titers are the GMT of 5 or 6 mice (n = 5 or 6) ± SD. One-way ANOVA was used for statistical analyses. “ns” denotes no significant difference. Source data are provided in the Source Data file.
Fig. 5
Fig. 5. Intranasal immunization of a trivalent vaccine induces superior tissue-resident memory T cells in the lungs to the monovalent vaccine.
At week 7, mice from Fig. 4 were retroorbitally injected with anti-CD45-PE. Ten minutes later, mice were euthanized, lung T cell suspensions were prepared and stimulated with SARS-CoV-2 S-specific peptide pool, and total lung CD4+ and CD8+ tissue-resident T cells (CD45) were analyzed. AD: Percentage of CD4+of S specific CD4+CD69+ (A), IFN-γ (B), IL-17 (C), and IL-5 (D) CD4+ T cells. EH: Percentage of live cells of S specific CD4+CD69+ (E) IFN-γ (F), IL-17 (G), and IL-5 (H) CD4+ T cells in the lung. I-J: Percentage of CD8+ (I) and live (J) cells of S-specific CD8+CD69+ cells in the lung. K-L: Percentage of CD8+ (K) and live (L) cells of S specific IFN-γ CD8+ T cells in the lung. Data shown are the mean of 5 or 6 mice in each group (n = 5 or 6) ± SD. In A, the P-value for TVC-IV (High), TVC-IV (Low), and rMuV-JL2-WA1 vs MMM vector is ****P = 9.01 × 10−6, ****P = 1.20 × 10−6, and *P = 0.0233, respectively; TVC-IV (High) vs rMuV-JL2-WA1 is **P = 0.0074; and TVC-IV (Low) vs rMuV-JL2-WA1 is ***P = 0.0005. In C, the P-value for MMM vector vs TVC-IV (Low) is **P = 0.0054, and TVC-IV (Low) vs rMuV-JL2-WA1 is **P = 0.0027. In E, the P-value for TVC-IV (High) and TVC-IV (Low) vs MMM vector is ****P = 5.84 × 10−5 and ****P = 5.01 × 10−5, respectively; TVC-IV (High) and TVC-IV (Low) vs rMuV-JL2-WA1 is **P = 0.0084 and **P = 0.0057, respectively. In F, the P-value for TVC-IV (High) vs MMM vector is *P = 0.015. In G, the P-value for TVC-IV (Low) vs MMM vector is **P = 0.0071, TVC-IV (High) and TVC-IV (Low) vs rMuV-JL2-WA1 is *P = 0.0438 and **P = 0.0052, respectively. In I, the P-value for TVC-IV (High), TVC-IV (Low), and rMuV-JL2-WA1 vs MMM vector is ****P = 1.247 × 10−6, ****P = 1.531 × 10−6, and ****P = 1.107 × 10−5, respectively. In J, the P-value for TVC-IV (High), TVC-IV (Low), and rMuV-JL2-WA1 vs MMM vector is **** P = 6.07 × 10−5, ***P = 0.0002, and ***P = 0.0006, respectively. In K, the P-value for TVC-IV (Low) and rMuV-JL2-WA1 vs MMM vector is **P = 0.0035 and **P = 0.0069, respectively; TVC-IV (High) vs TVC-IV (Low) is *P = 0.0352. In L, the P-value for TVC-IV (Low) and rMuV-JL2-WA1 vs MMM vector is *P = 0.0251 and **P = 0.0245, respectively. One-way ANOVA with multiple comparisons was used to detect differences among groups (*P < 0.05; **P < 0.01; ***P < 0.001; ****P < 0.0001).
Fig. 6
Fig. 6. Trivalent vaccine candidates are highly immunogenic in hamsters.
A Immunization schedule in hamsters: female hamsters (n = 15) were immunized with 1.2×10⁶ PFU (half S.C. and half I.N.) of TVC-V (rMuV-JL1-WA1, rMuV-JL2-B.1.1.7, and rMeV-WA1), TVC-VI (rMuV-JL1-WA1, rMuV-JL2-B.1.617.2, and rMeV-WA1), rMuV-JL2-B.1.617.2, or MMM vector. Three weeks later, hamsters were boosted with the same vaccine. At weeks 2, 5, and 7, sera (n = 15) were collected for detection of S-specific serum IgG antibodies by ELISA using preS-6P of SARS-CoV-2 WA1 (B), B.1.1.7 (C), B.1.135 (D), B.1.617.2 (E) as the coating antigen. In addition, S-specific serum IgA titer at weeks 5 (F) and 7 (G) was determined by ELISA using preS-6P of SARS-CoV-2 WA1 as the coating antigen. H Serum NAbs against SARS-CoV-2 VoCs. Sera at week 7 were used for a lentivirus-pseudotyped neutralization assay against SARS-CoV-2 WA1 (D614G), B.1.1.7, B.1.351, B.1.617.2, Omicron BA.1 (B.1.1.529), or BA.4/5 spike. The 50% neutralization titer (NT50) was calculated for each serum sample. The mean titers of fifteen hamsters (n = 15) ± SD are shown. The limit of detection is indicated by the dotted line. The P-value for TVC-V and TVC-VI vs rMuV-JL2-B.1.617.2 in (BG) is: B, *P = 0.0389 and *P = 0.0356 (week 2), *P = 0.0389 and *P = 0.0356 (week 5), *P = 0.0389 and *P = 0.0356 (week 7); C, **P = 0.001467 and ***P = 0.000811 (week 2), ****P = 0.00001 and ****P = 0.000007 (week 5), ****P = 1.367 × 10−7 and ****P = 1.367 × 10−7 (week 7); D, **P = 0.003319 and *P = 0.047119 (week 2), ****P = 0.000001 and ****P = 0.00001 (week 5), ****P = 0.000014 and *P = 0.00001 (week 7); E, ***P = 0.000627 and **P = 0.001518 (week 2), ****P = 0.000002 and ***P = 0.000091 (week 5), ****P = 0.000007 and ****P = 0.000005 (week 7); F, ****P = 2.176 × 10−23 and **** P = 2.176 × 10−23 (week 5); G, ****P = 2.176 × 10−23 and ****P = 2.176 × 10−23 (week 7). In H, the P-value for B.1.351, B.1.617.2, Omicron BA.1, and BA.4/5 vs WA1(D614G) in TVC-V is ****P = 3.618 × 10−12; Omicron BA.1 and BA.4/5 vs WA1(D614G) in TVC-VI is ****P = 0.0005 and ****P = 0.0228, respectively. One-way ANOVA was used for statistical analysis (ns > 0.05, *P < 0.05; **P < 0.01; ***P < 0.001; ****P < 0.0001).
Fig. 7
Fig. 7. Trivalent vaccine candidates (TVC-V and TVC-VI) protect hamsters against challenge with SARS-CoV-2 WA1 and variants of concern.
At week 7, 5 hamsters (n = 5) in each group in Fig. 6A were challenged with SARS-CoV-2 WA1 (AD), B.1.617.2 (EH), or B.1.1.529 (IL). Changes in body weight after challenge with SARS-CoV-2 WA1 (A), B.1.617.2 (E) or B.1.1.529 (I). Normal refers to animals inoculated with DMEM. Percent of weight on the challenge day was shown. Data are the average of 5 hamsters (n = 5) ± SD. Viral burden in the lung after challenge with SARS-CoV-2 WA1 (B), B.1.617.2 (F), or B.1.1.529 (J). Viral burden in the nasal turbinate after challenge with SARS-CoV-2 WA1 (C), B.1.617.2 (G), or B.1.1.529 (K). Hamsters challenged with SARS-CoV-2 WA1 or B.1.617.2 were euthanized at day 4 whereas hamsters challenged with B.1.1.529 were euthanized at day 3. Lung histopathological score after challenge with SARS-CoV-2 WA1 (D), B.1.617.2 (H), or B.1.1.529 (L). Viral titers are the GMT of 5 hamsters ± SD. The dotted line indicates the detection limit. Pathology of each lung section was scored based on the severity of histologic changes. Score of 0, 1, 2, 3, and 4 represents no, mild, moderate, severe, and extremely severe pathological changes. Data are the mean of 5 hamsters ± SD. The P-value for TVC-V, TVC-VI, and normal vs MMM vector is: A, ****P < 1 × 10−15, ****P < 1 × 10−15, and ****P = 2.974 × 10−8; B, ****P = 6.38 × 10−12, ****P = 1.08 × 10−12, and ****P = 9.53 × 10−13; C, ****P = 1.34 × 10−12, ****P = 1.6 × 10−13, and ****P = 1.5 × 10−13; D, ****P < 1 × 10−15, ****P < 1 × 10−15, and ****P < 1 × 10−15; E, ***P = 4.19 × 10−4, ****P = 9.59 × 10−6, and ****P = 3.37 × 10−7; F, ***P = 2.3 × 10−14, ****P = 2.3 × 10−14, and ****P = 2.3 × 10−14; G, *** P = 2.3 × 10−14, **** P = 2.3 × 10−14, and **** P = 2.3 × 10−14; H, ****P < 1 × 10−15, **** P < 1 × 10−15, and **** P < 1 × 10−15; I, P = 0.8766, *P = 0.028, and ****P = 0.0086; J, **P = 0.0012, **P = 0.0018, and ****P = 7.208 × 10−5; K, ****P = 3.505 × 10−5, ****P = 2.170 × 10−5, and ****P = 1.575 × 10−10; L, **P = 0.0035, **P = 0.0035, and **** P < 1 × 10−15. Data were analyzed using two-way ANOVA and one-way ANOVA (*P < 0.05; **P < 0.01; ***P < 0.001; ****P < 0.0001).
Fig. 8
Fig. 8. The effects of doses and antigen compositions on the immune responses of trivalent vaccines.
30 female hamsters were randomly divided into 6 groups (n = 5). The first 3 groups (AF) were immunized I.N. with 3 × 104, 3 × 105, and 1.2 × 106 PFU of TVC-VII (rMuV-JL2-WA1 + rMuV-JL1-WA1 + rMeV-WA1) and the other 3 groups (GL) were immunized I.N. with 3 × 104, 3 × 105, and 1.2 × 106 PFU of TVC-VIII (rMeV-WA1+rMuV-JL1-B.1.617.2+rMuV-JL2-B.1.1.7). Three weeks later, each group was boosted I.N. with the same dose of the same vaccine. WA1 (A, G), B.1.617.2 (B, H), and B.1.1.7 (C, I) specific serum IgG titers were determined by ELISA. Week 5 (D, J) and week 7 (E, K) serum IgA titers were determined by ELISA. Week 7 sera were used for the determination of NAbs (F, L) against different VoCs by pseudotyped virus neutralization assay. IgG and IgA titers are the GMT of 5 hamsters (n = 5) ± SD. NAb titers are the mean titers of five hamsters (n = 5) ±  SD. In B, the P-value for 3 × 104 PFU vs 1.2 × 106 PFU at weeks 2, 5, and 7 is ****P < 1.0 × 10−15, ****P < 1.0 × 10−15, and *P = 0.0457, respectively. In C, the P-value for 3 × 104 PFU vs 1.2 × 106 PFU at weeks 2 and 7 is ***P = 0.0002 and **P = 0.0031, respectively. In D, the P-value for 3 × 104 PFU vs 1.2 × 106 PFU at weeks 2, 5, and 7 is *P = 0.0277, ***P = 0.000147, and ***P = 0.000966, respectively. In E, the P-value for 3 × 104 PFU vs 1.2 × 106 PFU at weeks 2, 5, and 7 is **P = 0.00103, **P = 0.0024, and *P = 0.0287, respectively. In G, the P-value for 3 × 104 PFU vs 1.2 × 106 PFU at weeks 2 is *P = 0.026. In H, the P-value for 3 × 104 PFU vs 1.2 × 106 PFU at weeks 2 and 5 is ****P < 1.0 × 10−15 and ***P = 0.000147, respectively. In I, the P-value for 3 × 104 PFU vs 1.2 × 106 PFU at weeks 2 is ****P < 1.0 × 10−15. In J, the P-value for 3 × 104 PFU vs 1.2 × 106 PFU at weeks 2, 5, and 7 is ***P = 0.0005, ***P = 0.0032, and ****P < 1.0 × 10−15, respectively. In K, the P-value for 3 × 104 PFU vs 1.2 × 106 PFU in WA1, B.1.617.2, and B.1.1.7 is ****P < 1.0 × 10−15, ****P < 1.0 × 10−15, and *P = 0.013, respectively. Statistical analyses were conducted using one-way (DF and JL) or two-way (AC and GI) ANOVA (*P < 0.05; **P < 0.01; ***P < 0.001; ****P < 0.0001; ns not significant).
Fig. 9
Fig. 9. The preexisting MMM vector immunity does not significantly interfere with SARS-CoV-2-specific antibodies induced by a trivalent vaccine.
A Immunization schedule. Two groups of female hamsters (n = 5) were inoculated S.C. with 1.2 × 106 PFU of MMM vectors (a mixture of rMeV, rMuV-JL1, and rMuV-JL2, 4 × 105 PFU per virus) or DMEM. Three weeks later, both groups were immunized with 1.2 × 106 PFU of TVC-VIII (a mixture of rMeV-WA1 + rMuV-JL1-B.1.617.2 + rMuV-JL2-B.1.1.7, 4 × 105 PFU per virus). At week 5, both groups were boosted with 1.2 × 106 PFU of TVC-VIII. B MuV-specific NAb response measured by plaque reduction neutralization assay. C MeV-specific NAb response measured by plaque reduction neutralization assay. The P-value at weeks 2 and 5 is ****P = 7.874 × 10−6 and ****P = 1.096 × 10−5, respectively. DF WA1 (D), B.1.617.2 (E), and B.1.1.7 (F) -specific serum IgG titers were measured by ELISA. In E, the P-value at weeks 5 and 7 is ***P = 0.000138 and **P = 0.0079, respectively. In F, the P-value at weeks 5 and 7 is ****P = 2.444 × 10−5 and **P = 0.0032, respectively. MeV NAb, MuV NAb, and IgG titers are the GMT of 5 hamsters (n = 5) ± SD. Two-way ANOVA was used for statistical analysis (ns > 0.05; **P < 0.01; ****P < 0.0001).
Fig. 10
Fig. 10. The impact of immune imprinting on the efficacy of trivalent vaccines.
20 female hamsters were divided into 4 groups (n = 5). Groups 1, 2, and 3 received two doses of rMuV-JL2-WA1 (1.2 × 106 PFU) at weeks 0 and 3, and Group 4 received two doses of rMuV-JL2 control. At week 5, Groups 1, 2, and 3 received 1.2 × 106 PFU of trivalent TVC IX (rMeV-BA.1, rMuV-JL1-B.1.617.2, and rMuV-JL2-WA1), monovalent rMeV-BA.1, and  monovalent rMuV-JL2-WA1, respectively. A WA1-specific IgG at weeks 2 and 5. B WA1-, B.1.617.2-, and BA.1-specific IgG at week 7. The P-value for WA1 vs. BA.1 in Group 1 is *P = 0.0439. The P-value for B.1.617.2 and BA.1 vs WA1 in Group 2 is ****P = 2.8251 × 10−5 and ***P = 0.000147, respectively. The P-value for B.1.617.2 and BA.1 vs WA1 in Group 3 is ***P = 0.0007 and ***P = 0.00015, respectively. C WA1-, B.1.617.2-, and BA.1-specific IgG at week 9. IgG titers are the GMT of 5 hamsters (n = 5) ± SD. D WA1(D614G)-, B.1.617.2-, and BA.1-specific NAb at week 9. NAb was detected by pseudotype neutralization assay. NAb titers are the mean of 5 hamsters ± SD are shown. The P-value for B.1.617.2 and BA.1 vs WA1 in Group 2 is ****P = 8.197 × 10−8 and ****P = 2.3 × 10−12, respectively. The P-value for BA.1 vs WA1 in Group 3 is **P = 0.0095. E Body weight changes in hamsters after Omicron BA.1 challenge. Percent of weight at the challenge day was shown. Data are the average of 5 hamsters (n = 5) ± SD. F Omicron BA.1 titer in lung of hamsters after BA.1 challenge. The P-value for Group 1, 2, 3, and 3 vs challenge control is ****P < 1.0 × 10−15, ****P < 1.0 × 10−15, ****P < 1.0×10⁻¹⁵, and ****P < 1.0 × 10−15, respectively. G Omicron BA.1 titer in nasal turbinate of hamsters after BA.1 challenge. Viral titers are the GMT of 5 hamsters (n = 5) ± SD. The dotted line indicates the detection limit. The P-value for Group 1, 2, 3, and 3 vs challenge control ****P < 1.0 × 10−15, ****P < 1.0 × 10−15, ****P < 1.0 × 10−15, and ****P < 1.0 × 10−15, respectively. Data were analyzed using two-way ANOVA and one-way ANOVA (ns > 0.05; **P < 0.01; ***P < 0.001; ****P < 0.0001).

Similar articles

Cited by

References

    1. Firouzabadi N, Ghasemiyeh P, Moradishooli F, Mohammadi-Samani S. Update on the effectiveness of COVID-19 vaccines on different variants of SARS-CoV-2. Int. Immunopharmacol. 2023;117:109968. doi: 10.1016/j.intimp.2023.109968. - DOI - PMC - PubMed
    1. Collier AY, et al. Differential kinetics of immune responses elicited by Covid-19 vaccines. N. Engl. J. Med. 2021;385:2010–2012. doi: 10.1056/NEJMc2115596. - DOI - PMC - PubMed
    1. Lau JJ, et al. Real-world COVID-19 vaccine effectiveness against the omicron BA.2 variant in a SARS-CoV-2 infection-naive population. Nat. Med. 2023;29:348–357. doi: 10.1038/s41591-023-02219-5. - DOI - PMC - PubMed
    1. Tregoning JS, Flight KE, Higham SL, Wang Z, Pierce BF. Progress of the COVID-19 vaccine effort: viruses, vaccines and variants versus efficacy, effectiveness and escape. Nat. Rev. Immunol. 2021;21:626–636. doi: 10.1038/s41577-021-00592-1. - DOI - PMC - PubMed
    1. Wrapp D, et al. Cryo-EM structure of the 2019-nCoV spike in the prefusion conformation. Science. 2020;367:1260–1263. doi: 10.1126/science.abb2507. - DOI - PMC - PubMed

MeSH terms

Supplementary concepts

Grants and funding